Release date
September 12, 2023
Data source parameters
Add a HUAWEI CLOUD GaussDB data source.
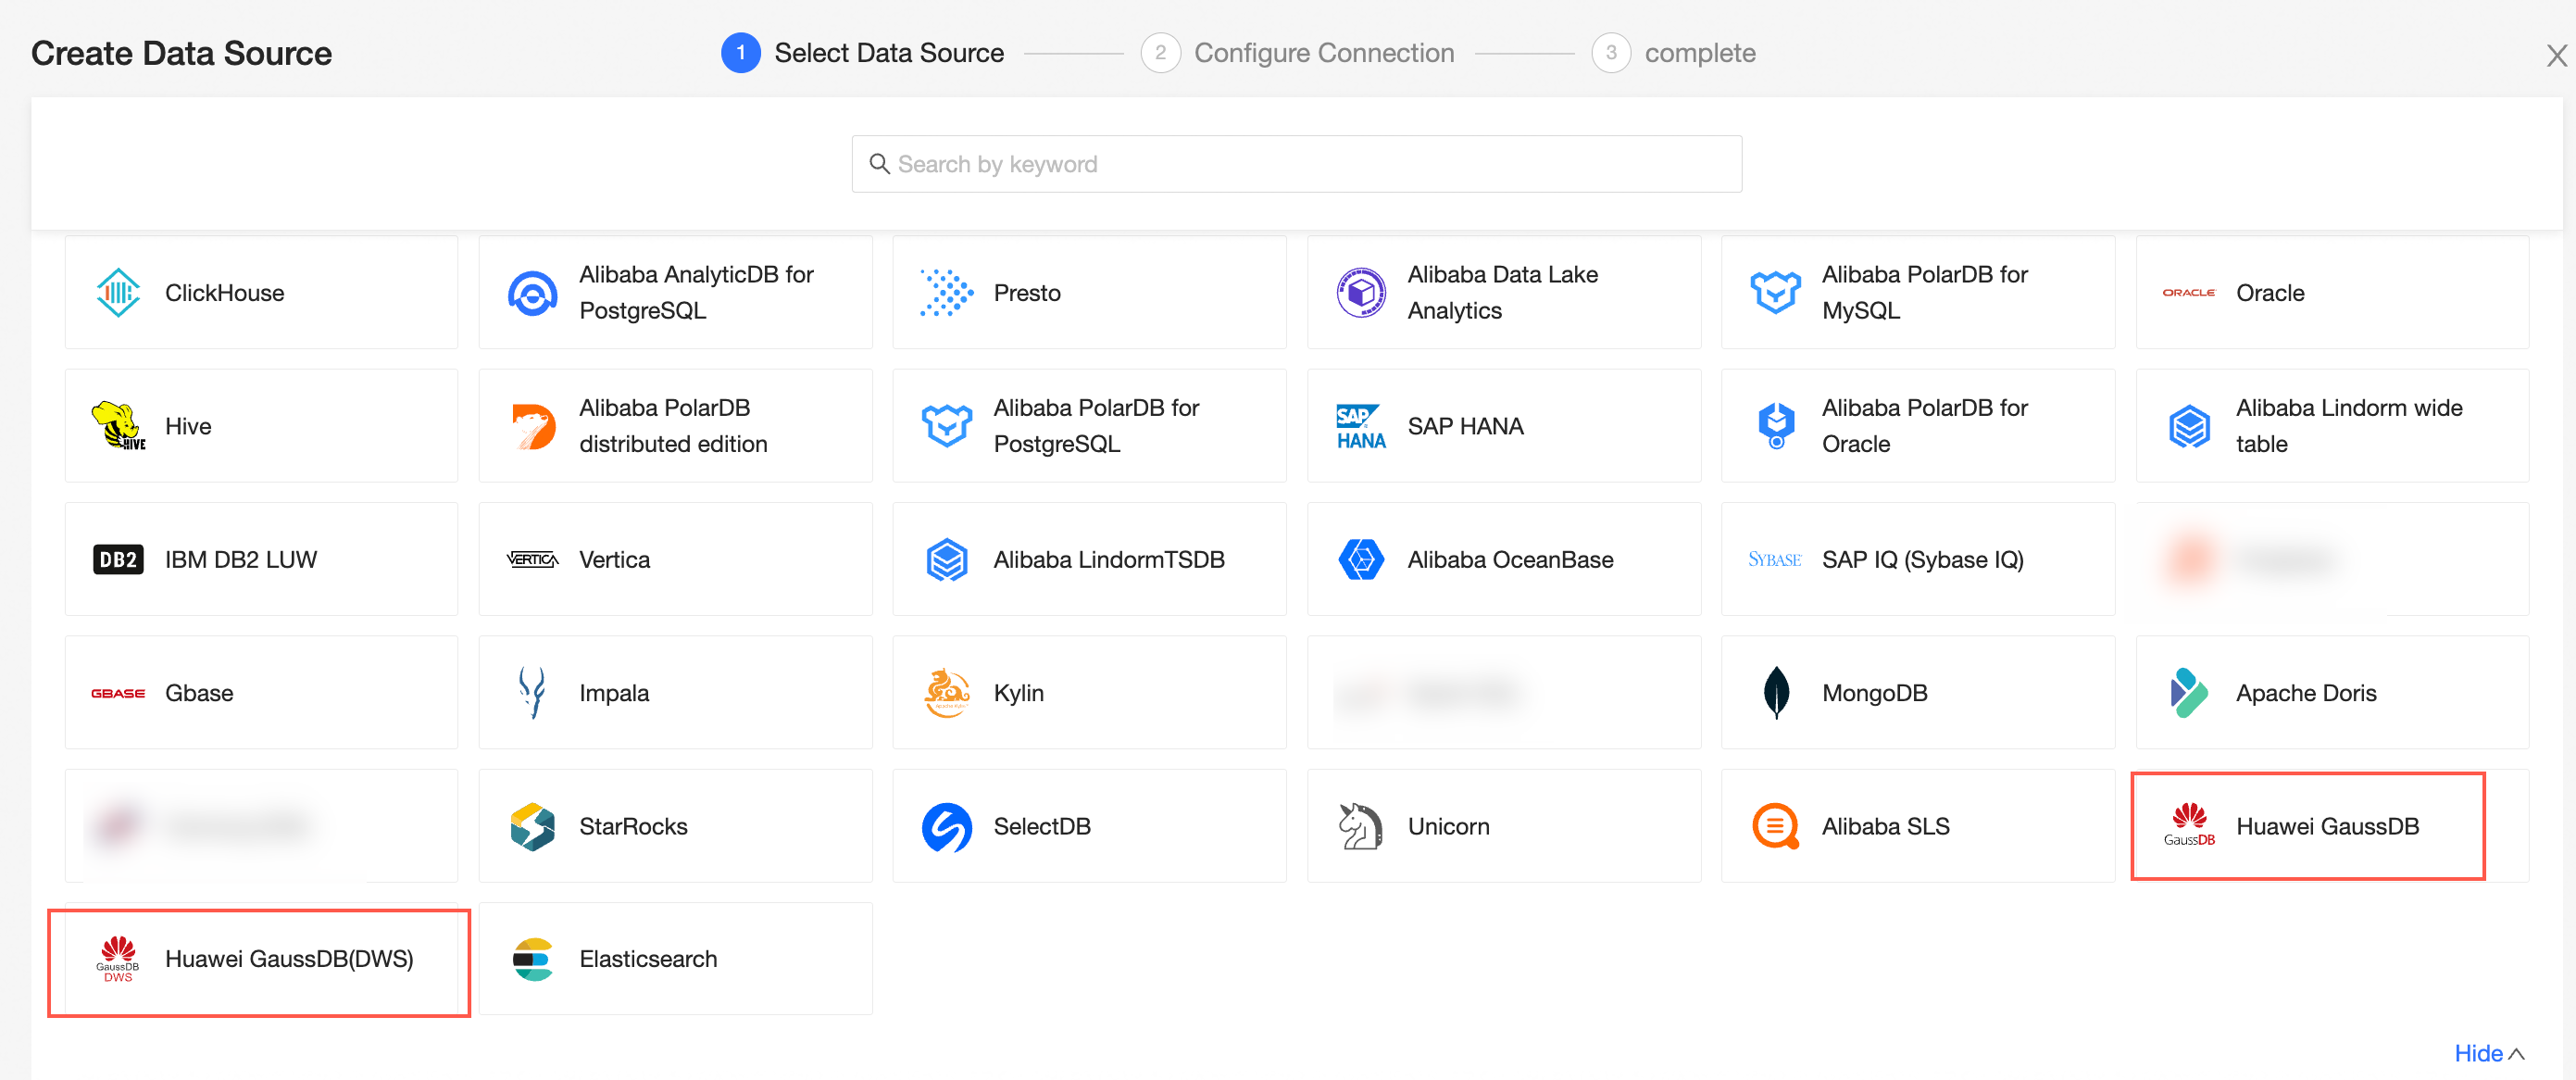
For more information, see HUAWEI CLOUD Data Source GaussDB and HUAWEI CLOUD Data Source GaussDB(DWS).
Added support for Elasticsearch data sources.
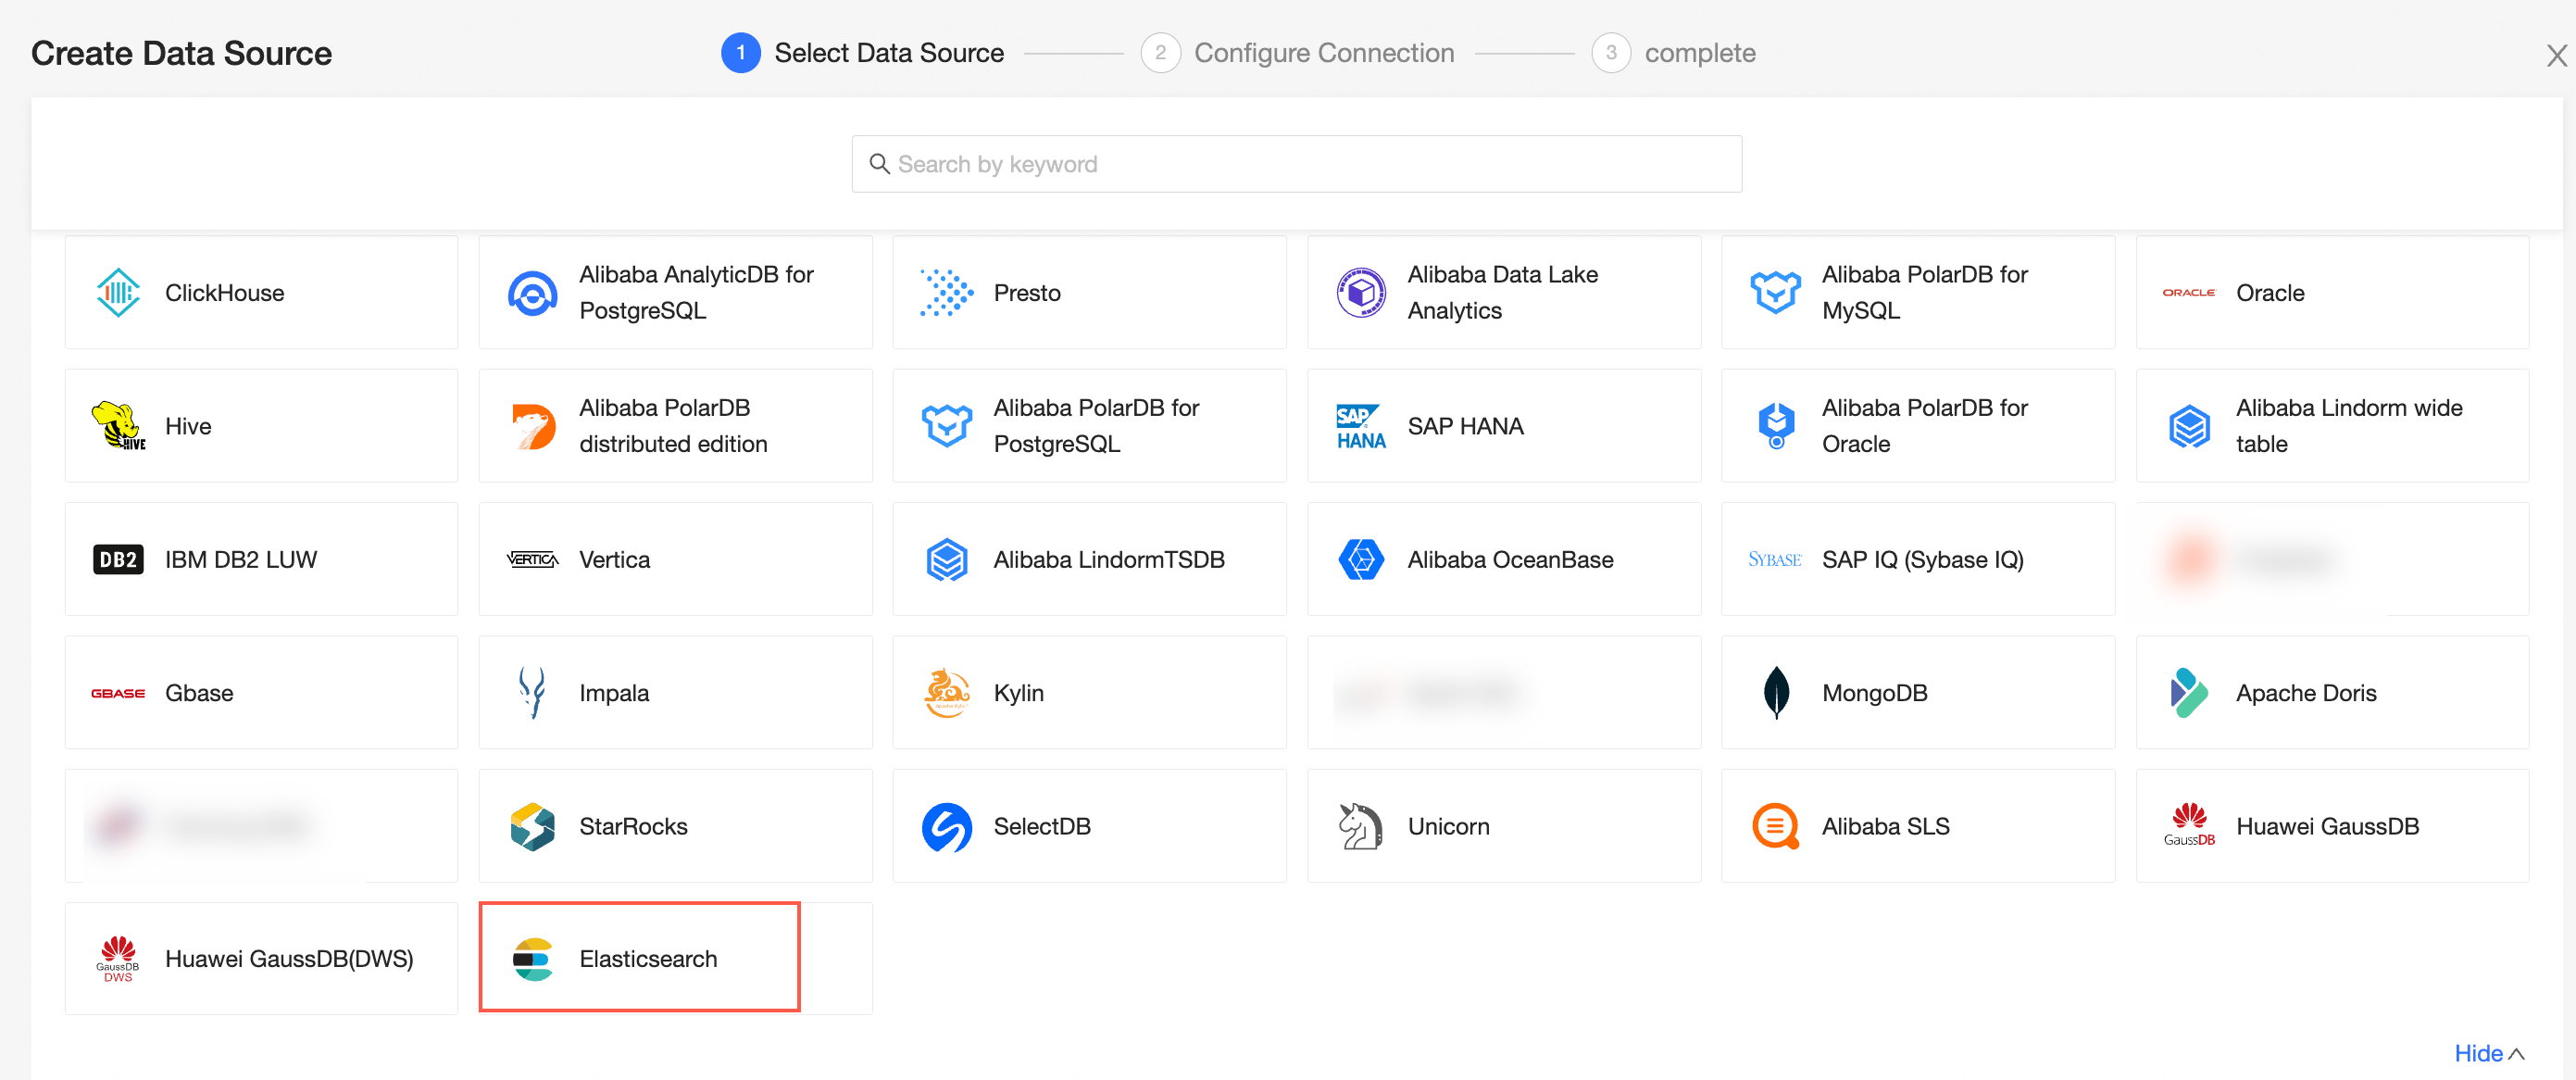
For more information, see Alibaba Cloud data source Elasticsearch and Self-built data source Elasticsearch.
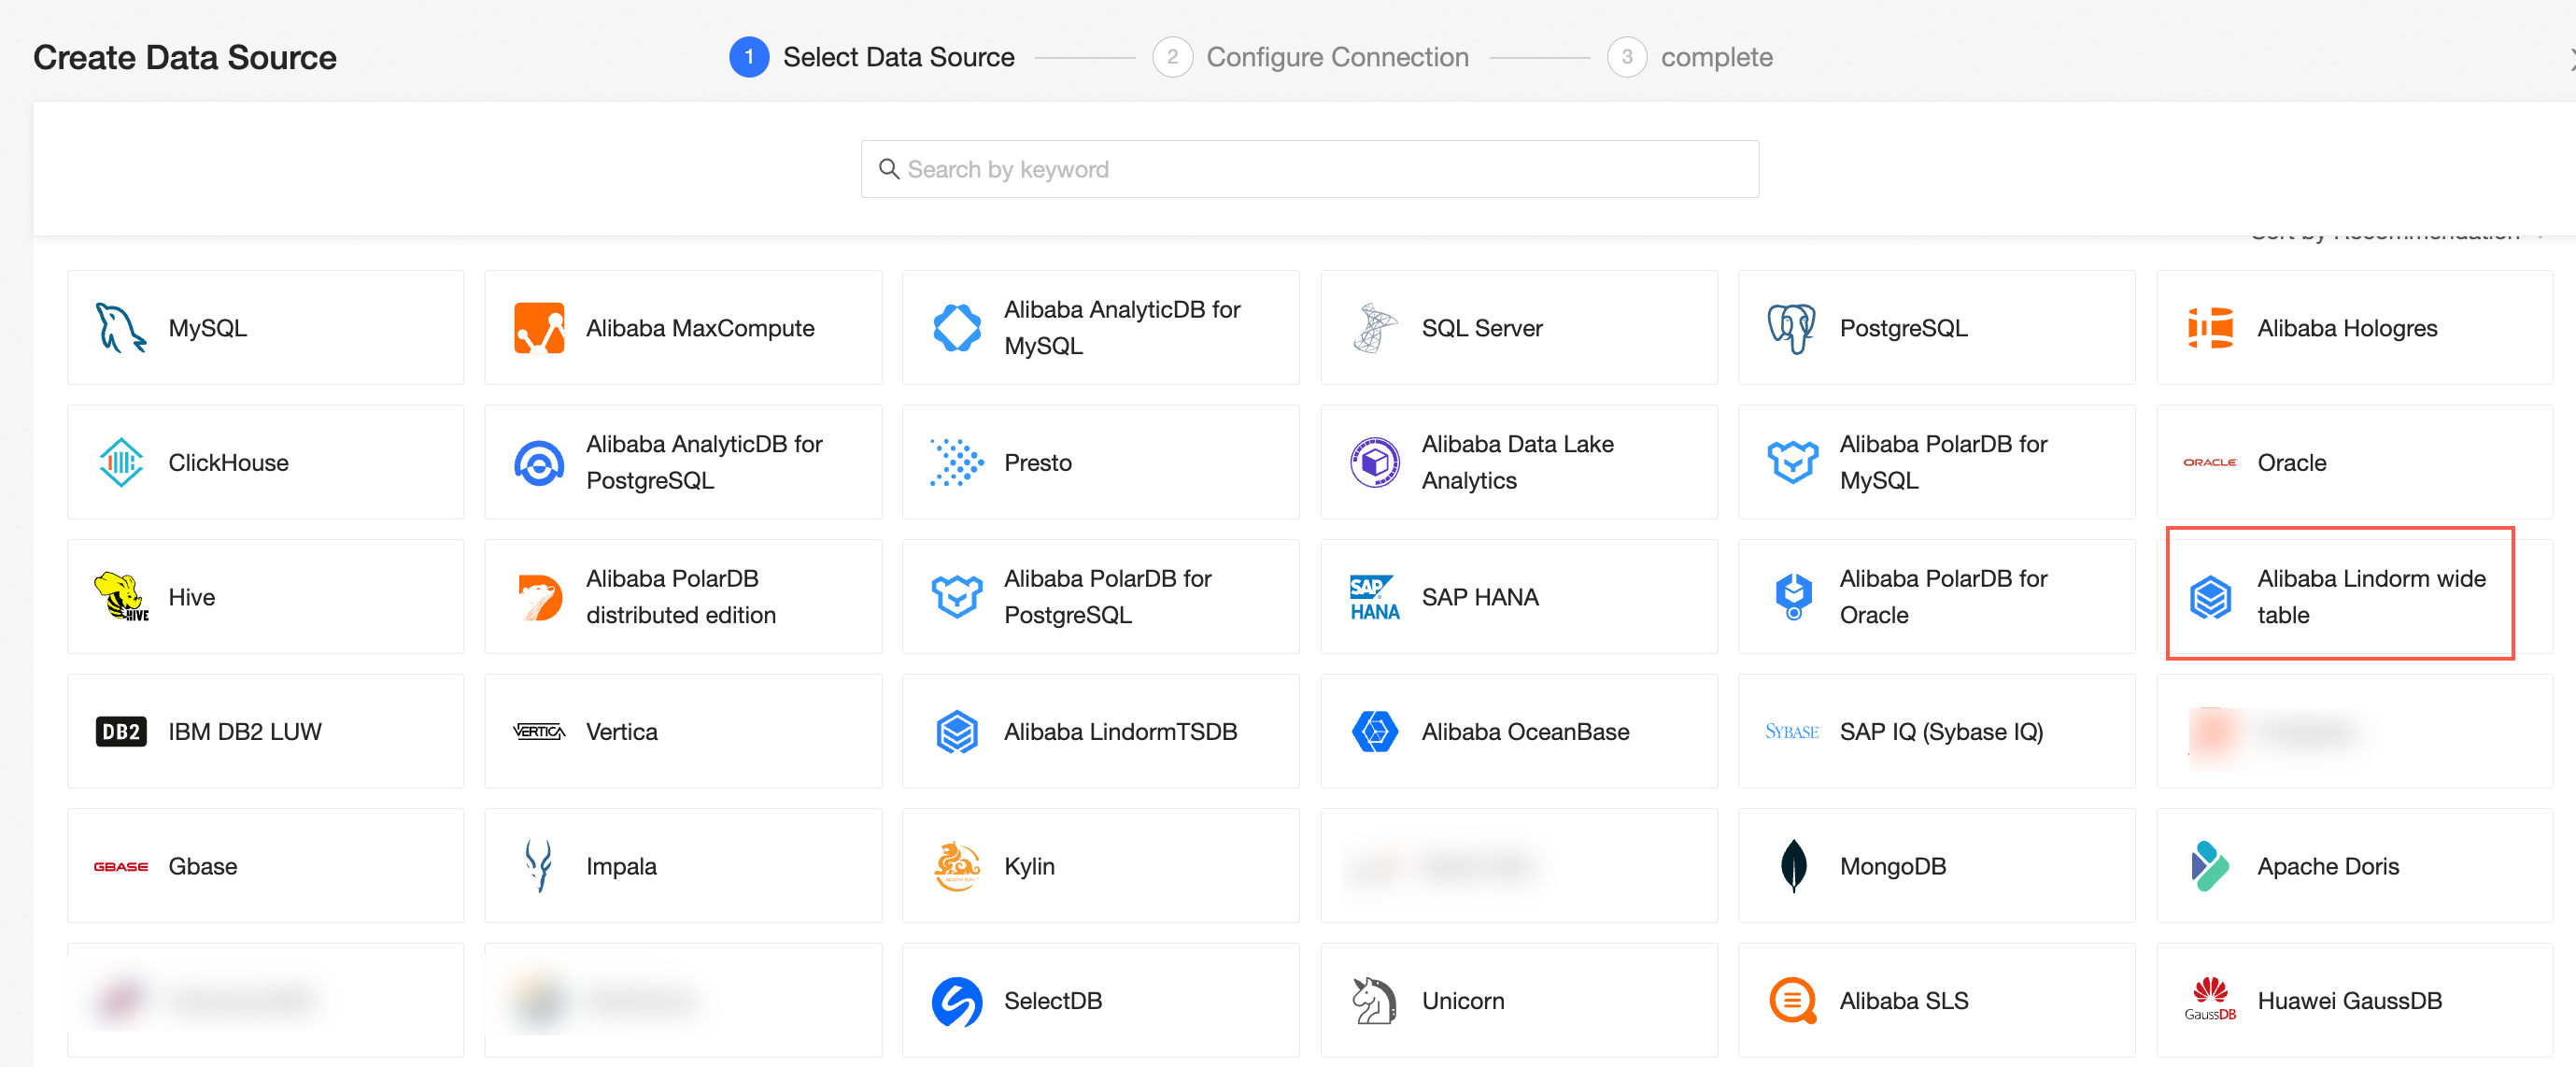
The Lindorm wide table engine is added as a data source.
Add SSL configurations for a ClickHouse or Hologres data source.
For more information, see ApsaraDB for ClickHouse, User-created ApsaraDB for ClickHouse, and ApsaraDB for Hologres.
Datasets
Dataset allows you to create and associate multiple tables by using SQL code.
For more information, see Build a Model.
The LOD function is supported for new calculated fields.
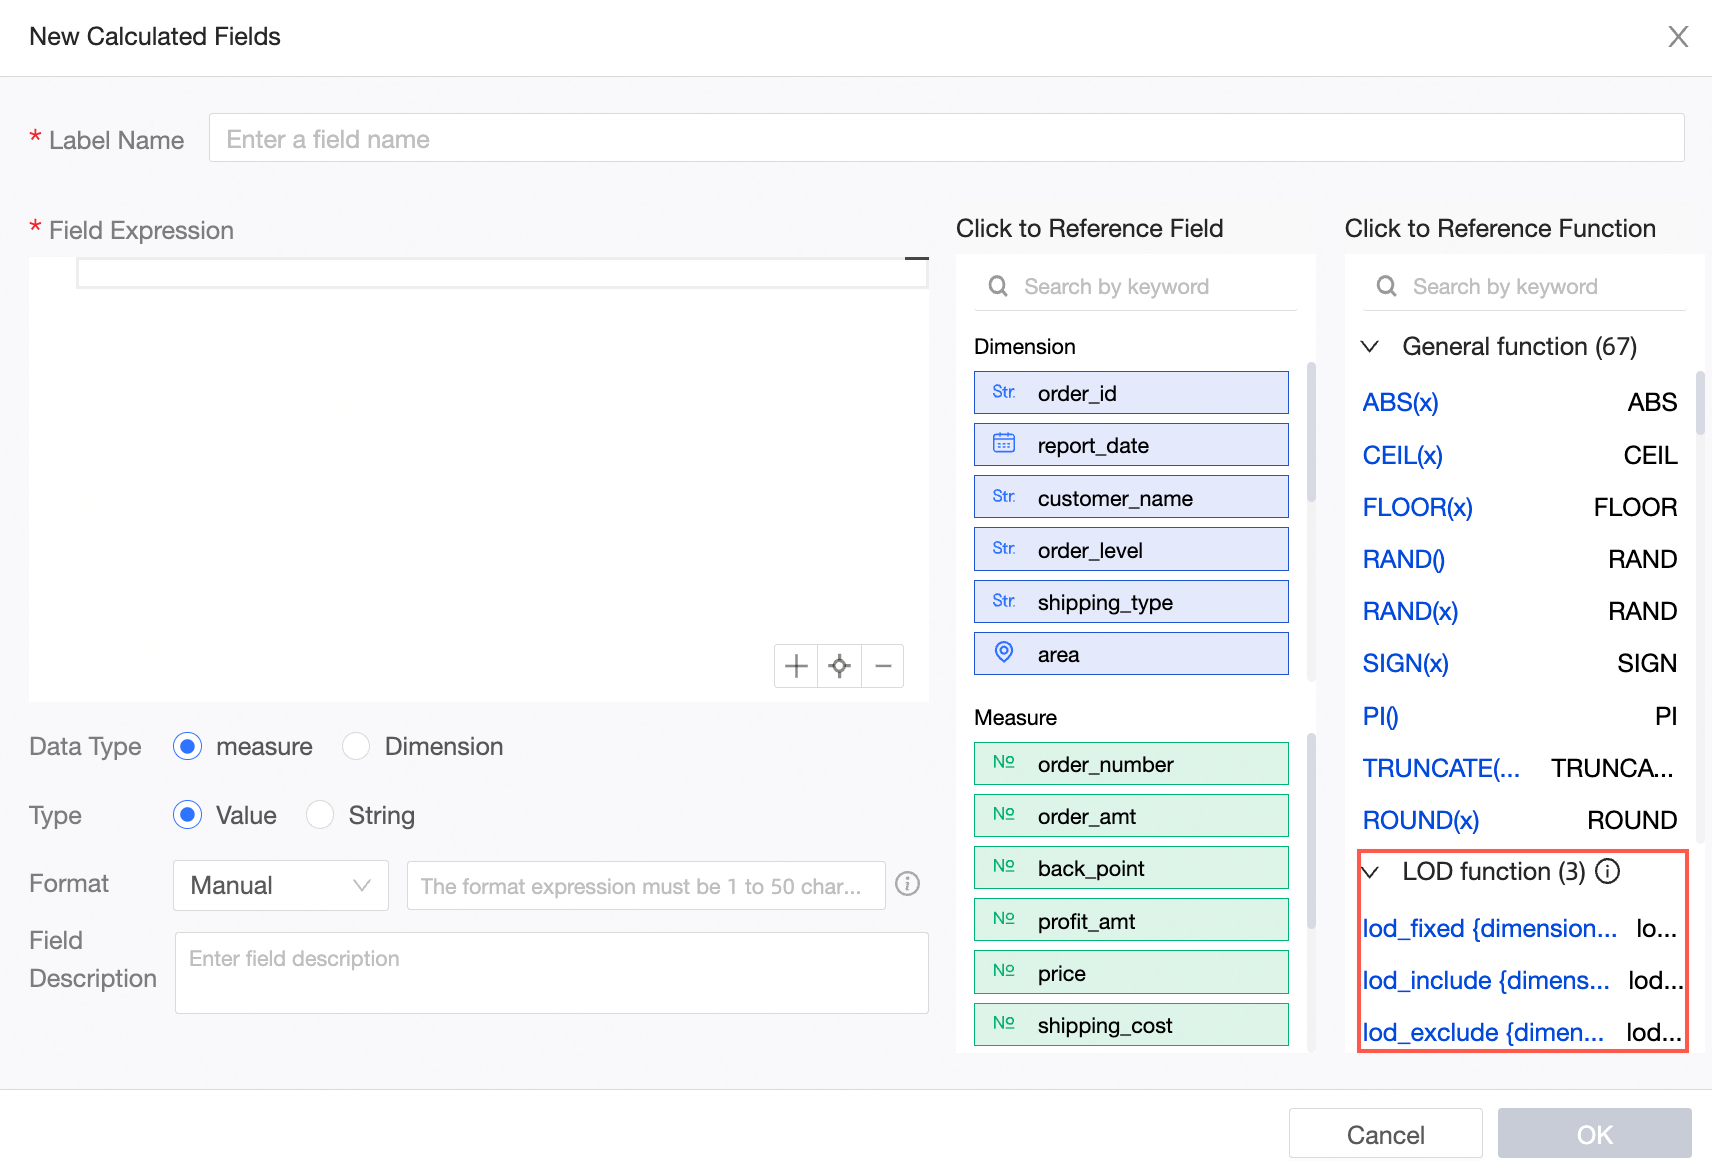
For more information, see LOD functions.
Dashboards
The configuration panel is optimized, and supports the search configuration items function and the one-click expansion and collapse function of chart configuration items to improve the efficiency of report building.
For more information, see Panel Search and Configure a chart data area.
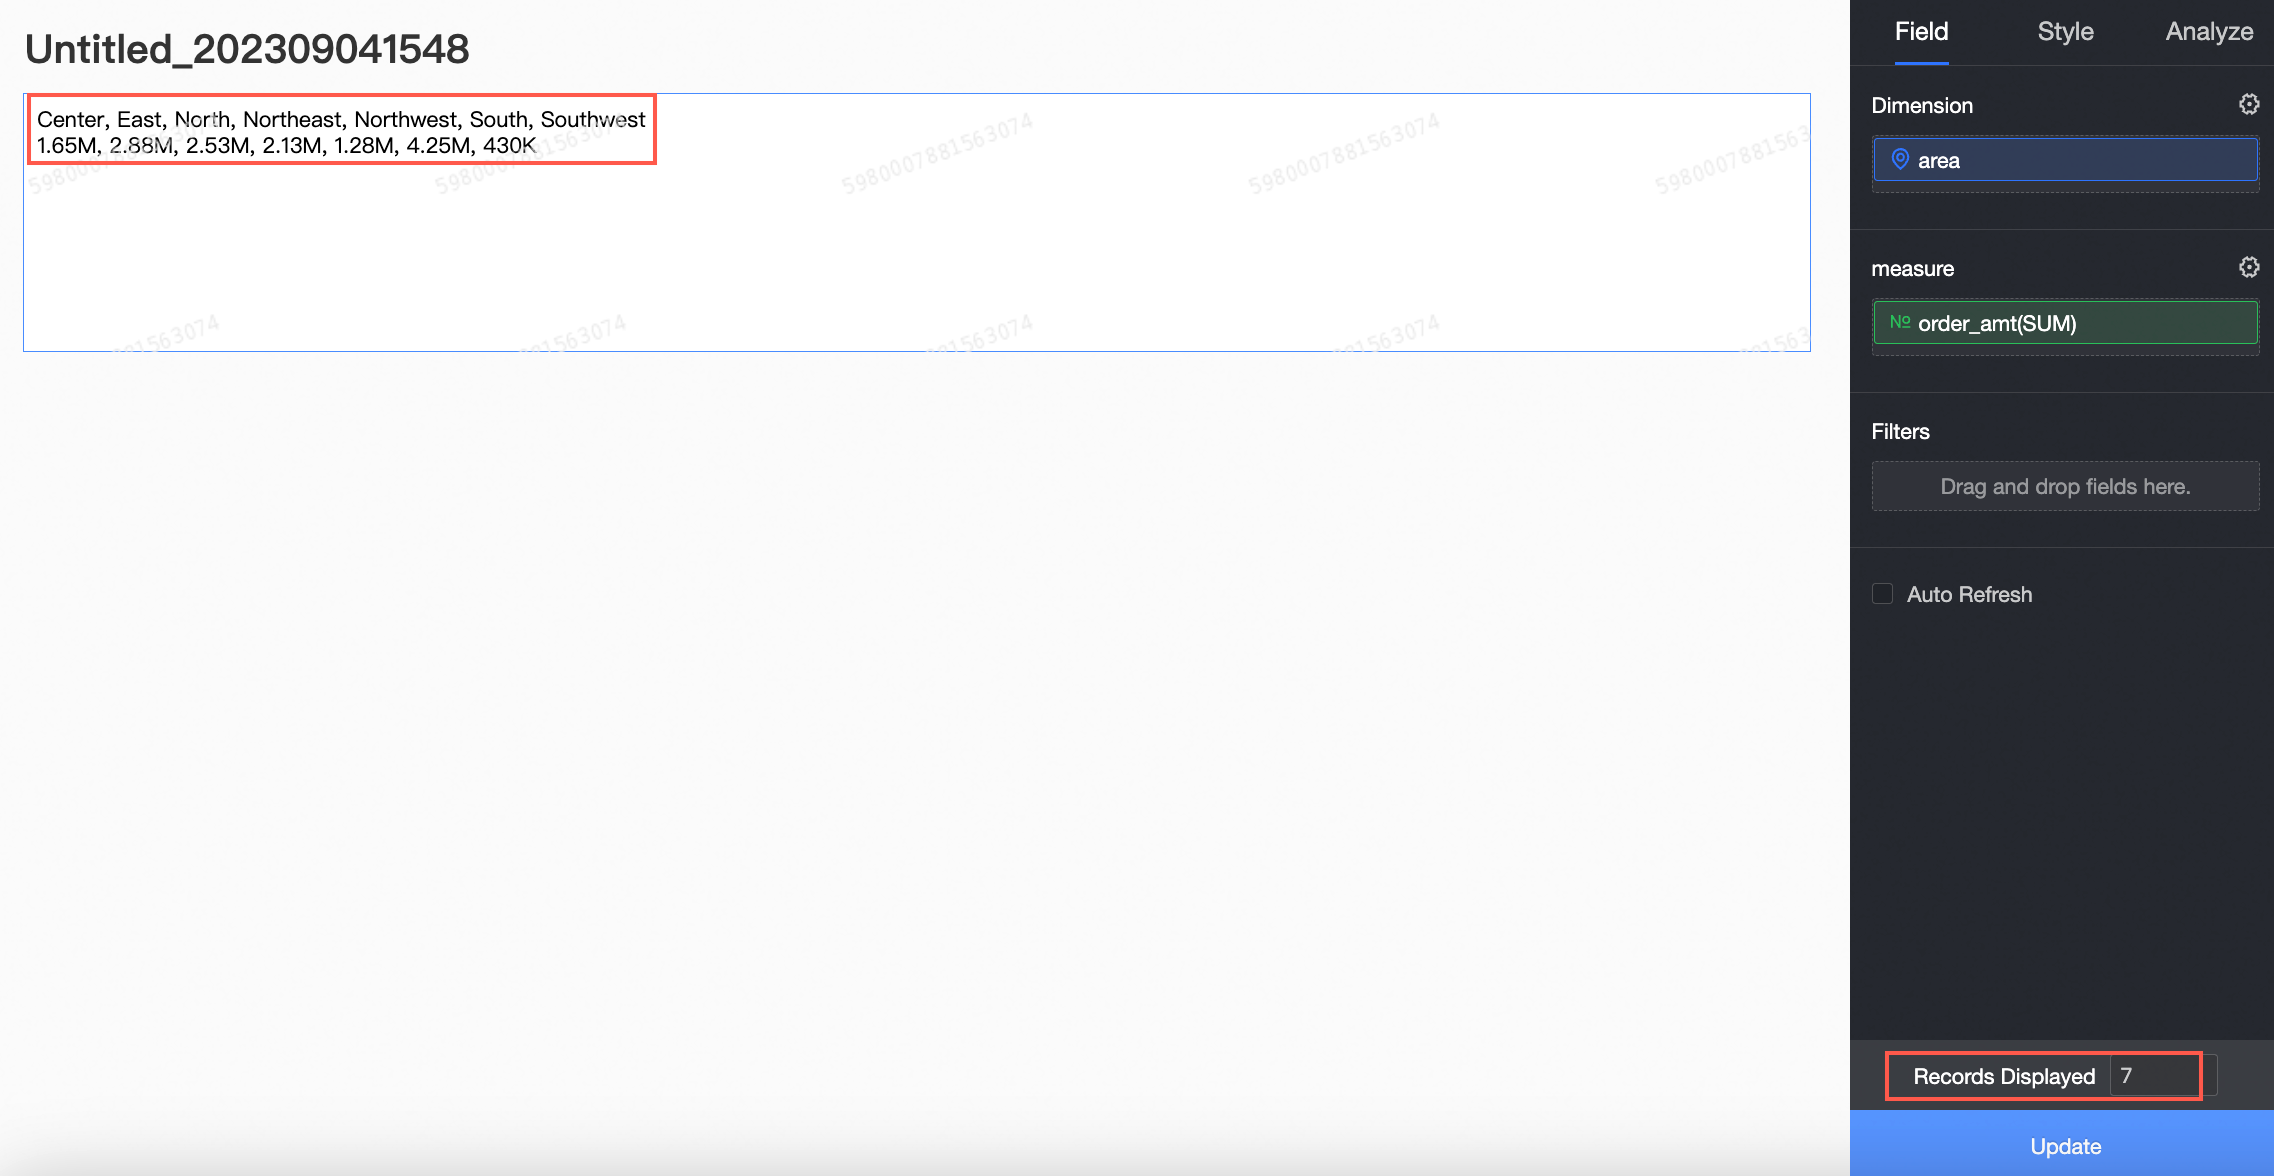
You can customize dimension fields in a chart on the Data tab.
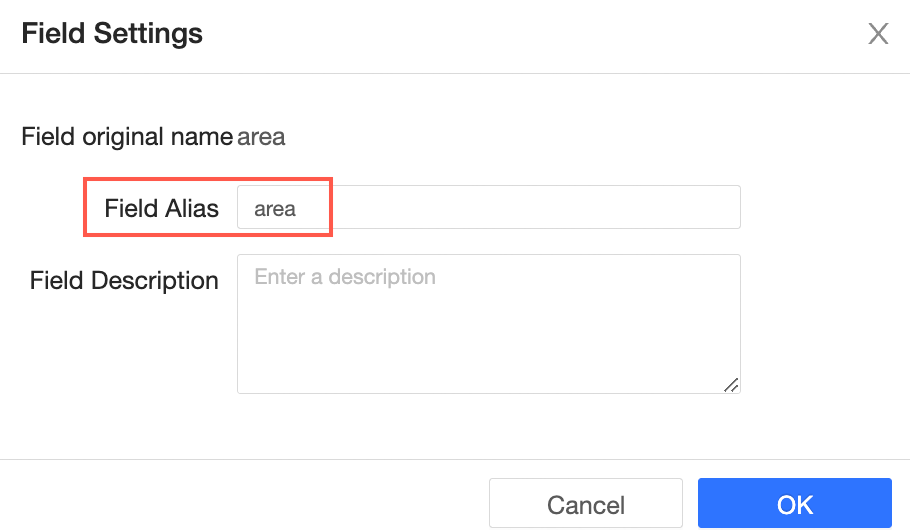
For more information, see Configure a chart.
Rich text supports multiple parallel dimension values in the same dimension.
For more information, see Rich text.
Linkage panel supports fixed&resize and position.
For more information, see Filter Interaction.
Dashboards support refreshing data in a single chart to improve data refresh efficiency.
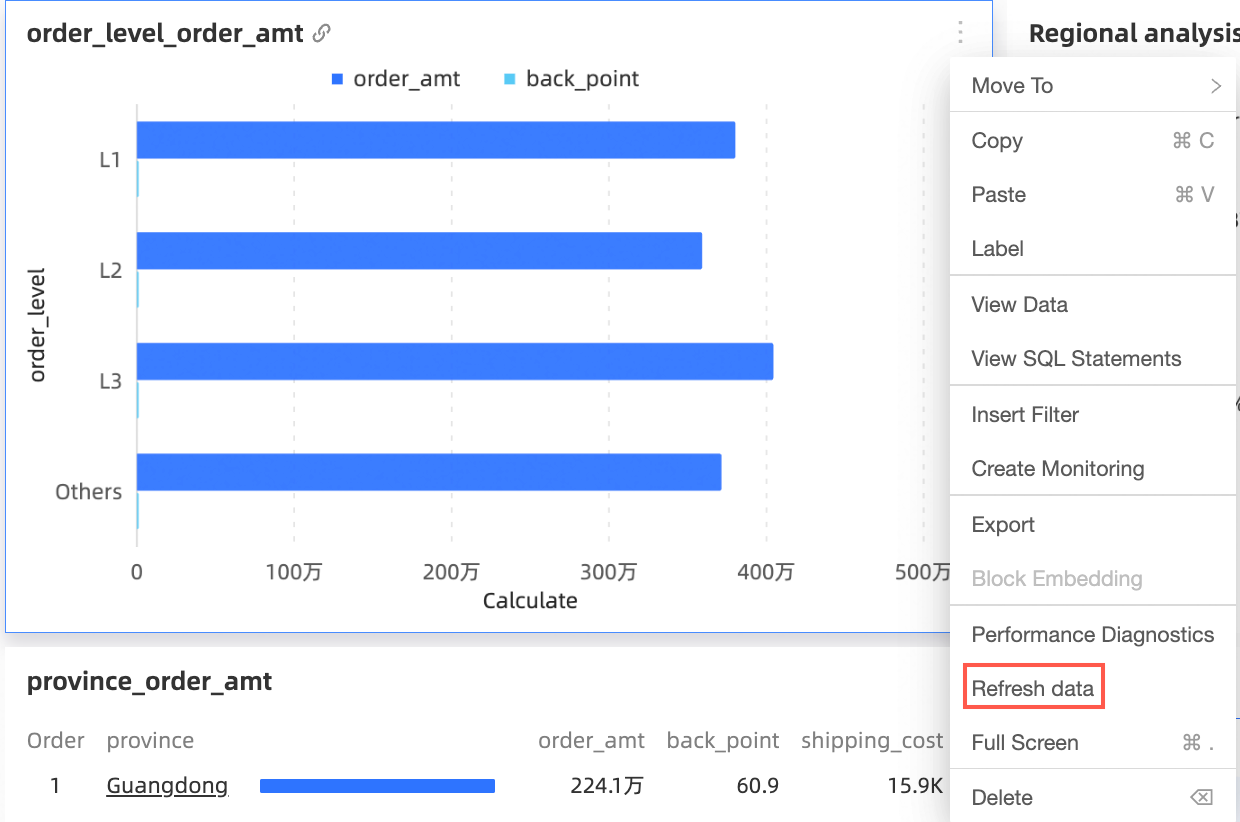
You can select specific charts for dashboard export.
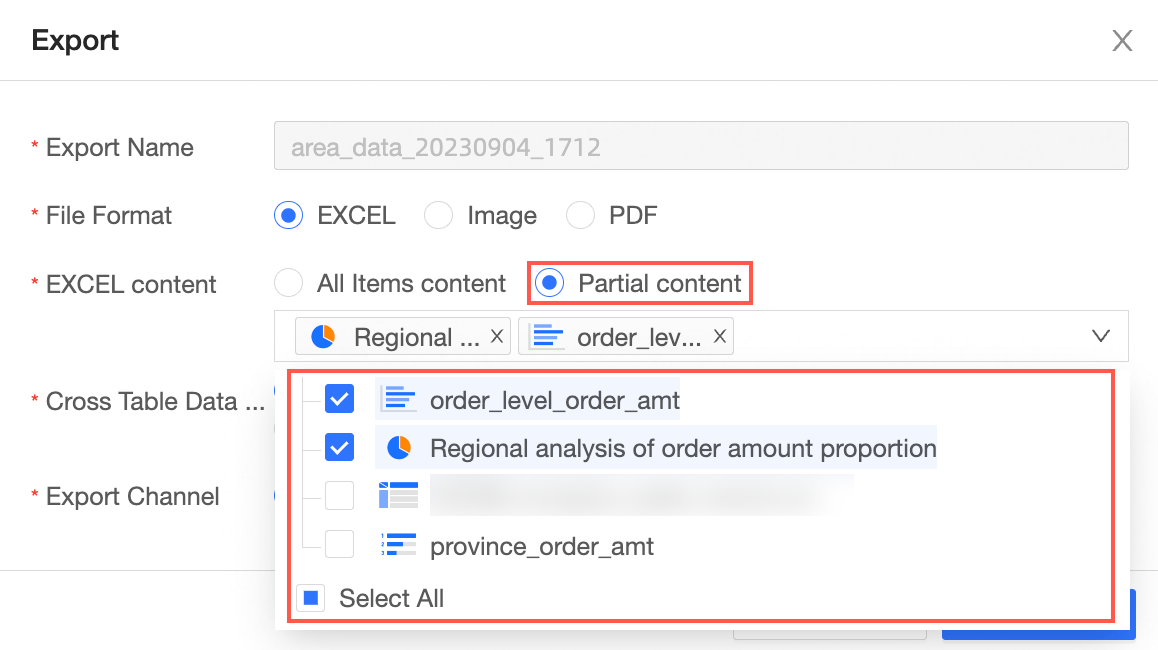
For more information, see Create a Bashboard.
The global query control supports moving to within tabs.
For more information, see Tab.
The query control mobile terminal supports the query, reset, and clear buttons.
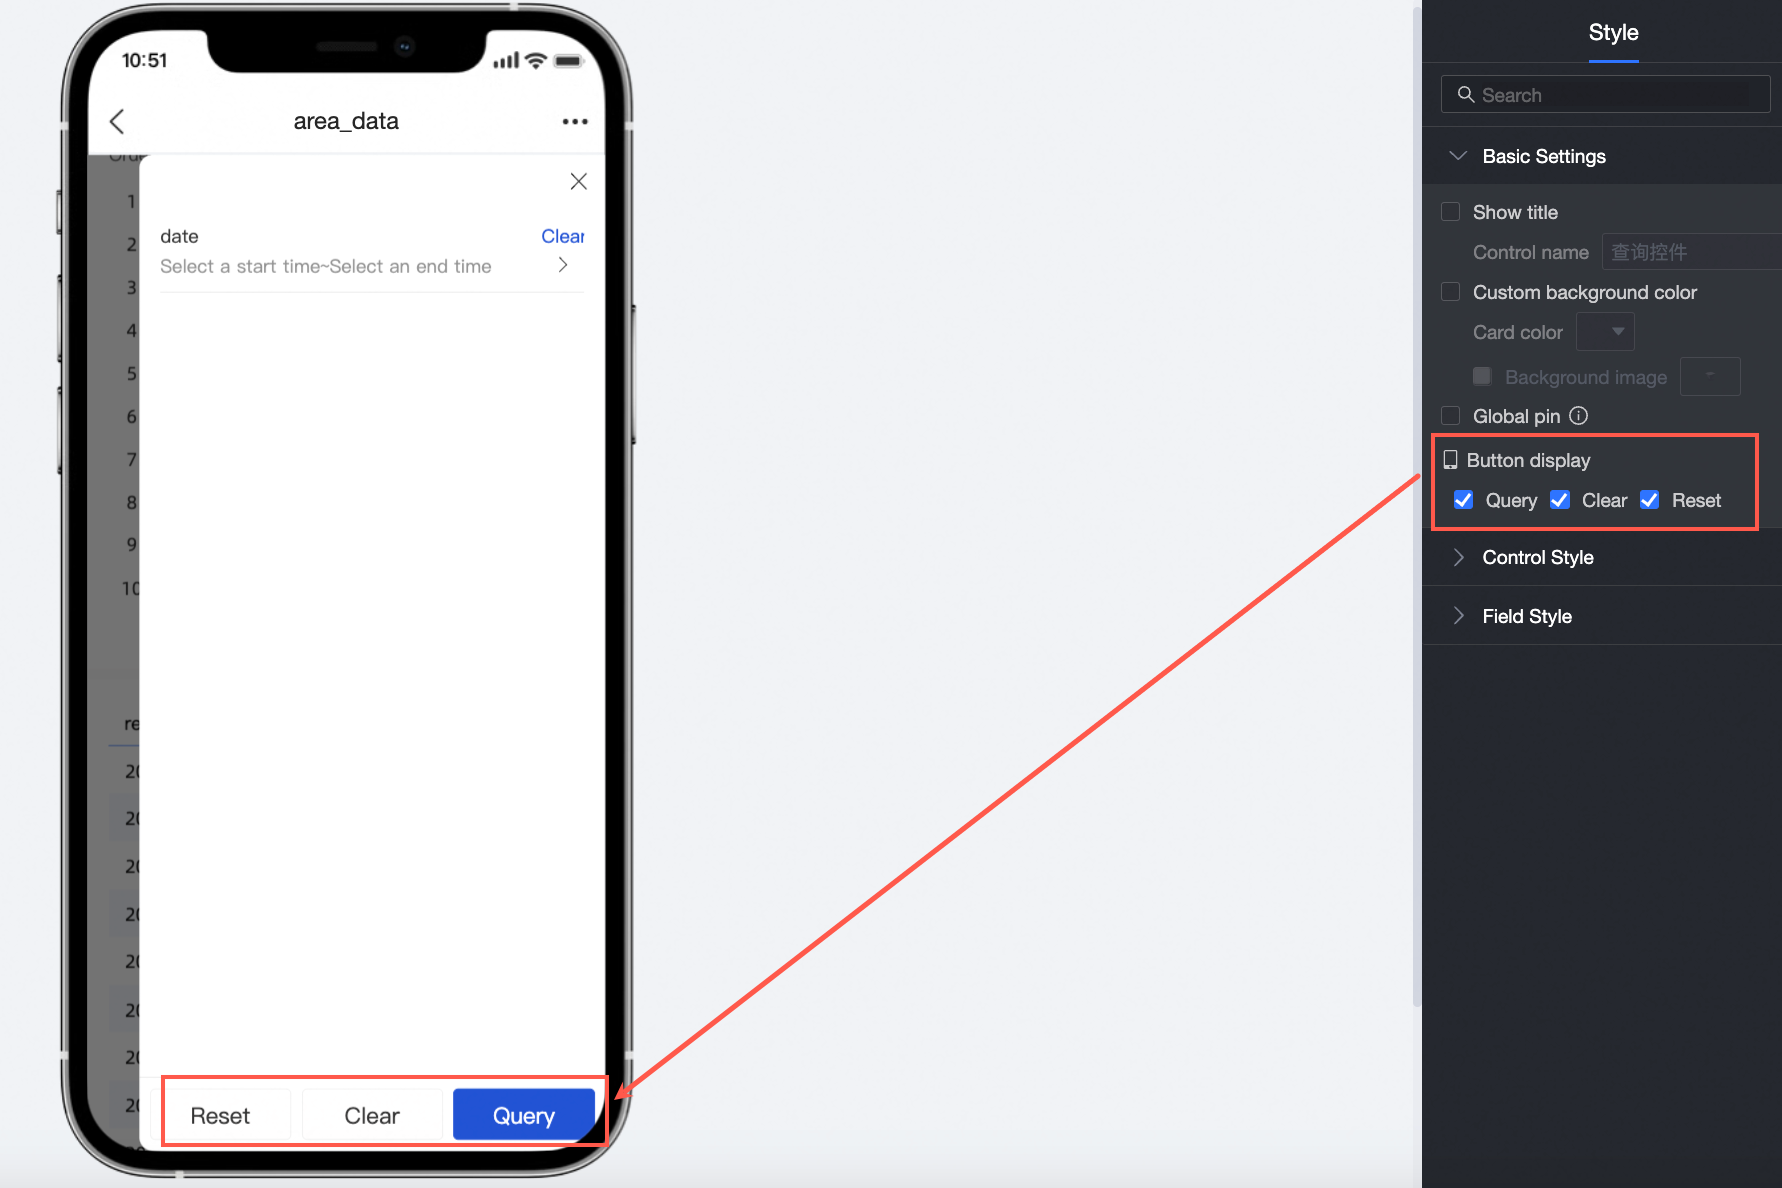
For more information, see Create a Query Control.
Create a chart
Building heatmap is added to collect statistics on the flow of people in offline venues. It supports displaying the heating data of multiple floors and venues and supports switching between floors.
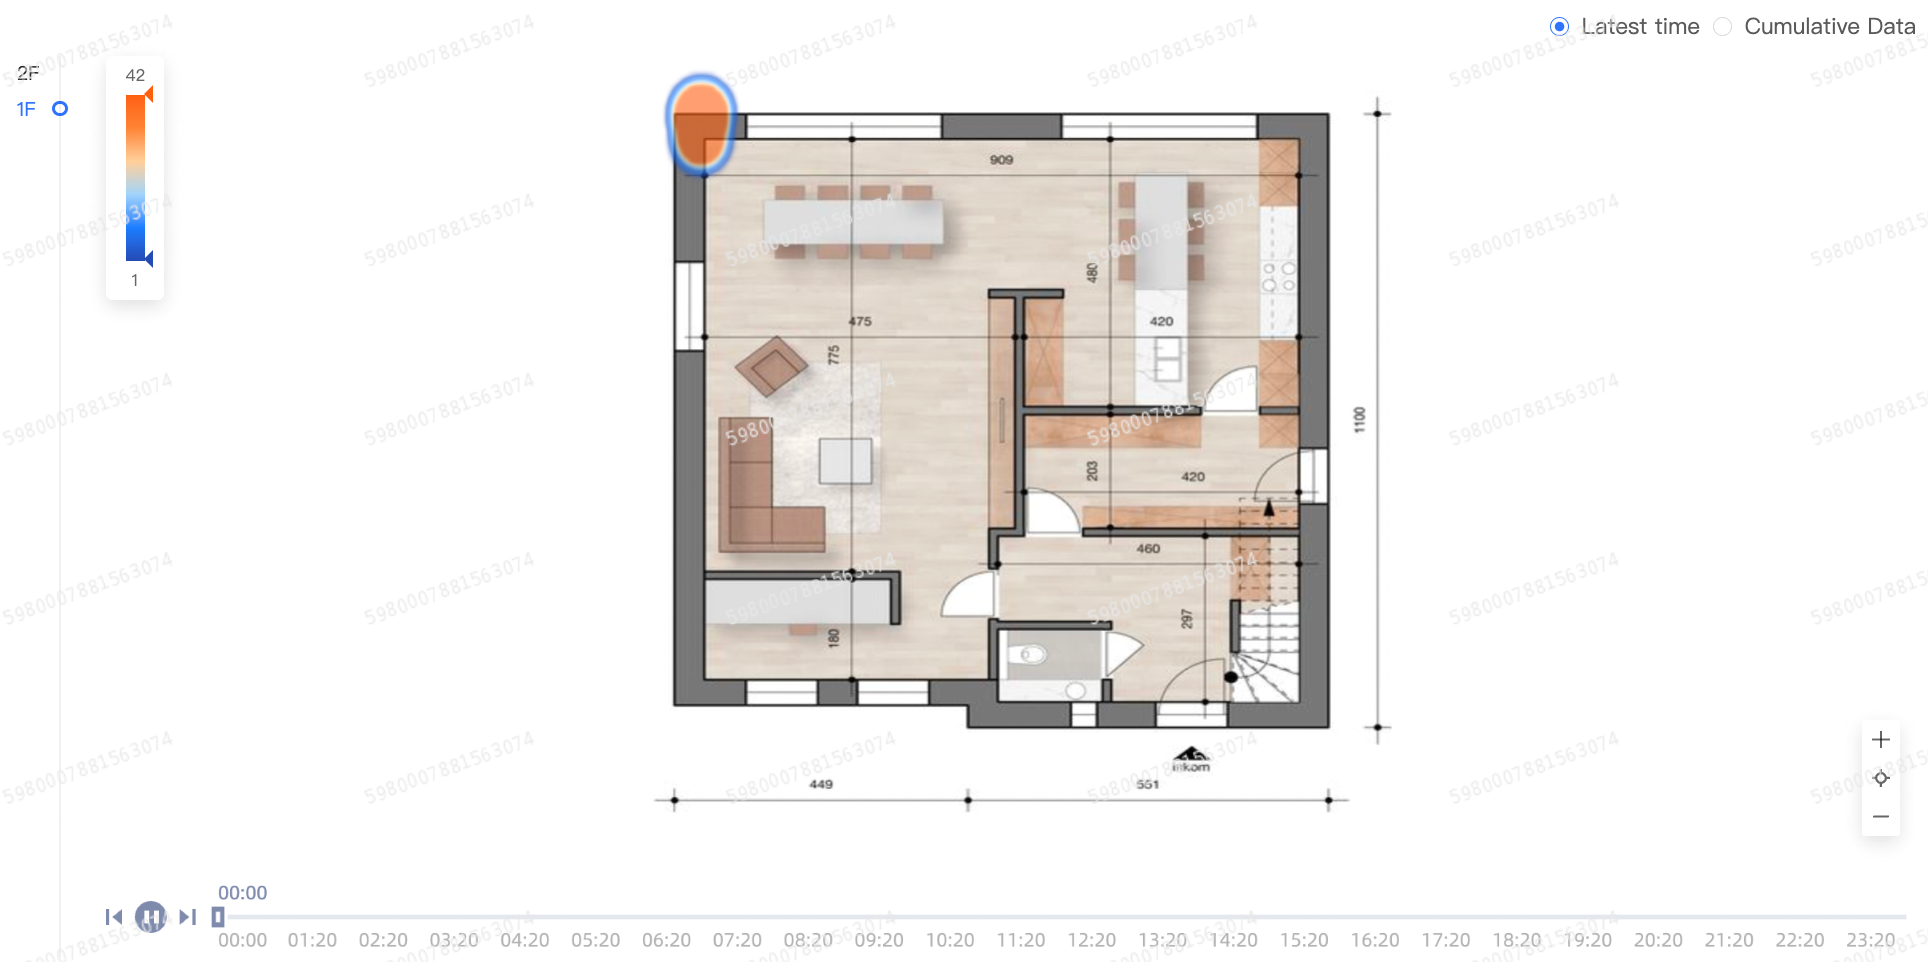
See Building heatmap.
The map configuration feature is extended. Custom GeoJSON allows you to configure multiple layers of geographic information. You can perform drill-down interaction at different levels when you display reports. You can also use standard geographic information, multiple layers of GeoJSON, and a combination of longitude and latitude to drill-down.
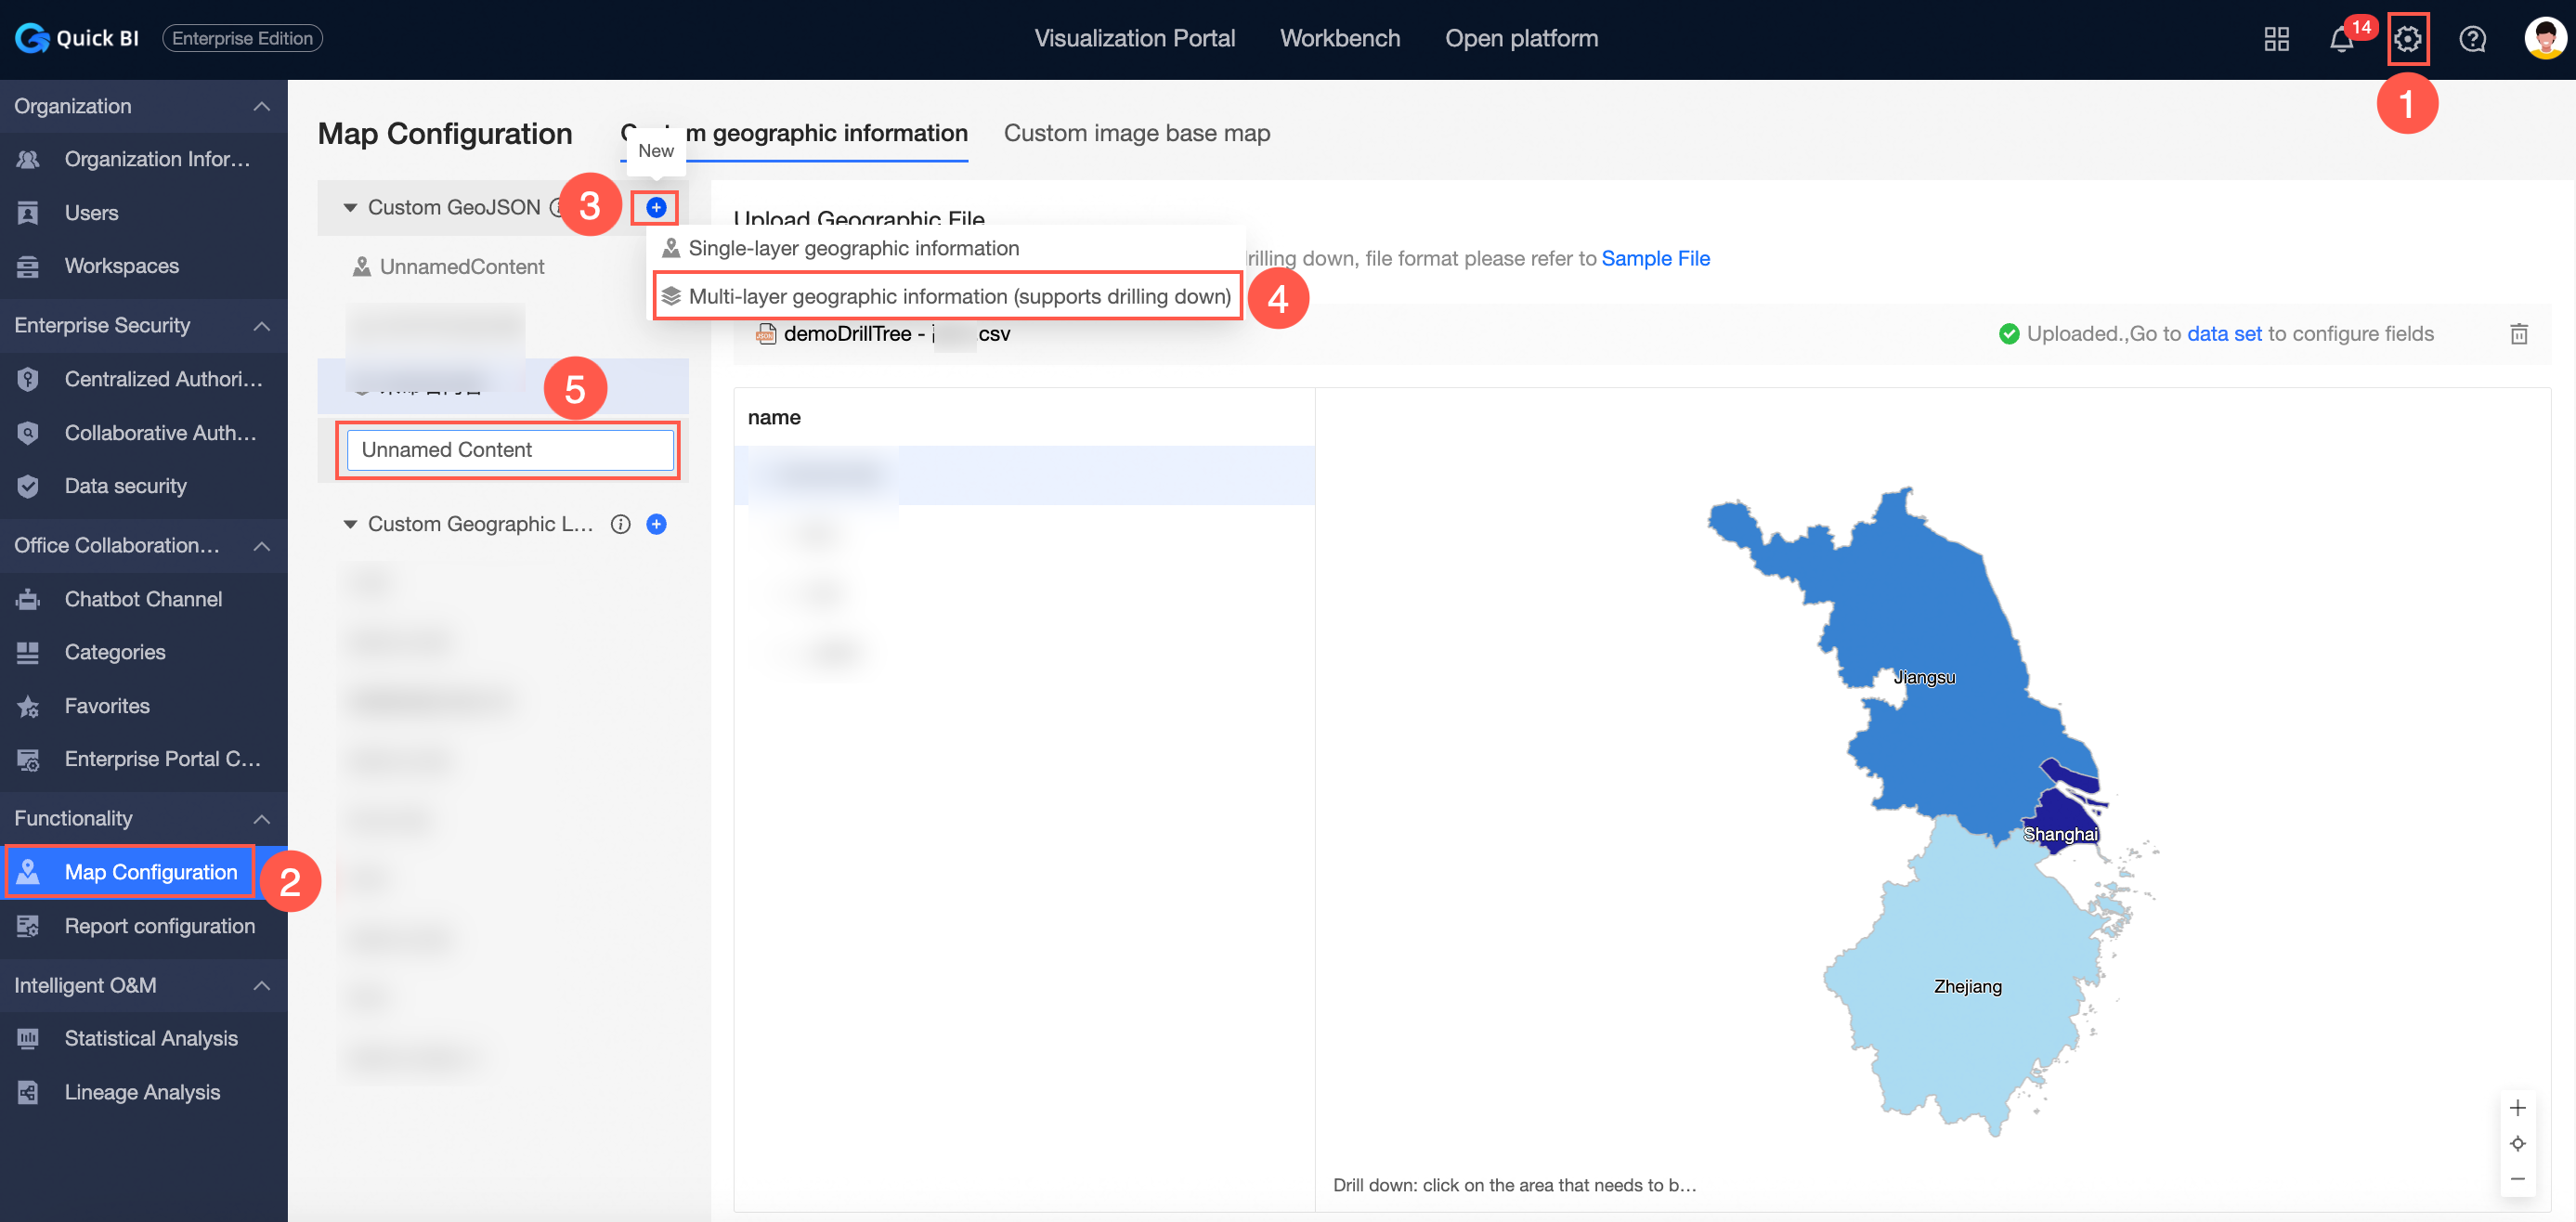
For more information, see Customize GeoJSON.
Coordinate charts (except bar charts) support the Y-axis flashback setting.
See line, area chart, column chart, combination chart.
In the single-measure scenario of the indicator trend chart, you can set the axis label format to follow the data format of the measure&sub-indicators support comparison over the same period.
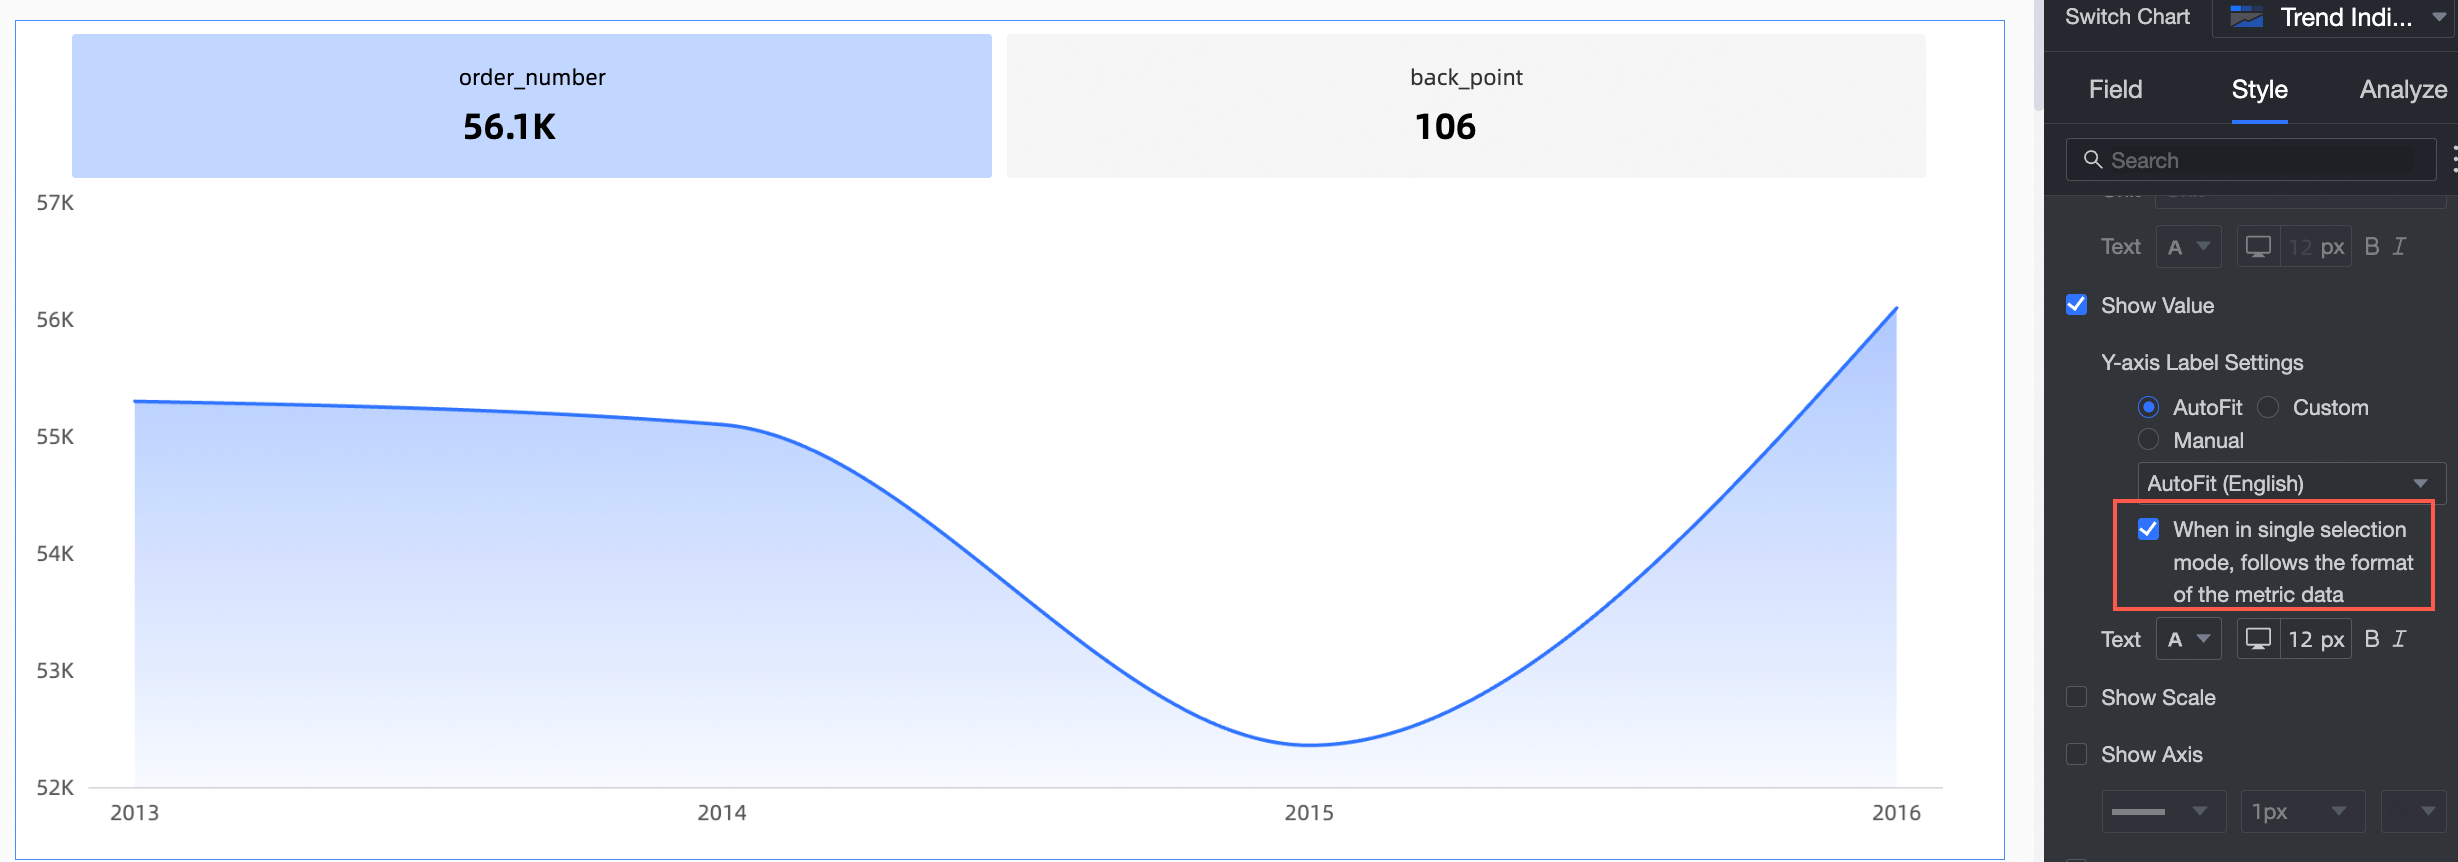
For more information, see Indicator Trend Chart.
Added "Start time point" for crosstab measure statistics.
For more information, see Cross tables.
progress bar, ring progress bar, water wave diagram support configuration progress bar width.
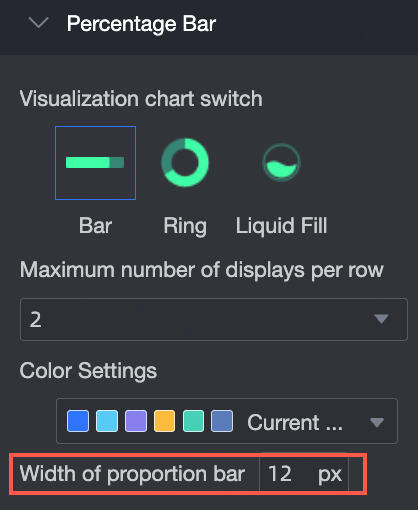
See progress bar.
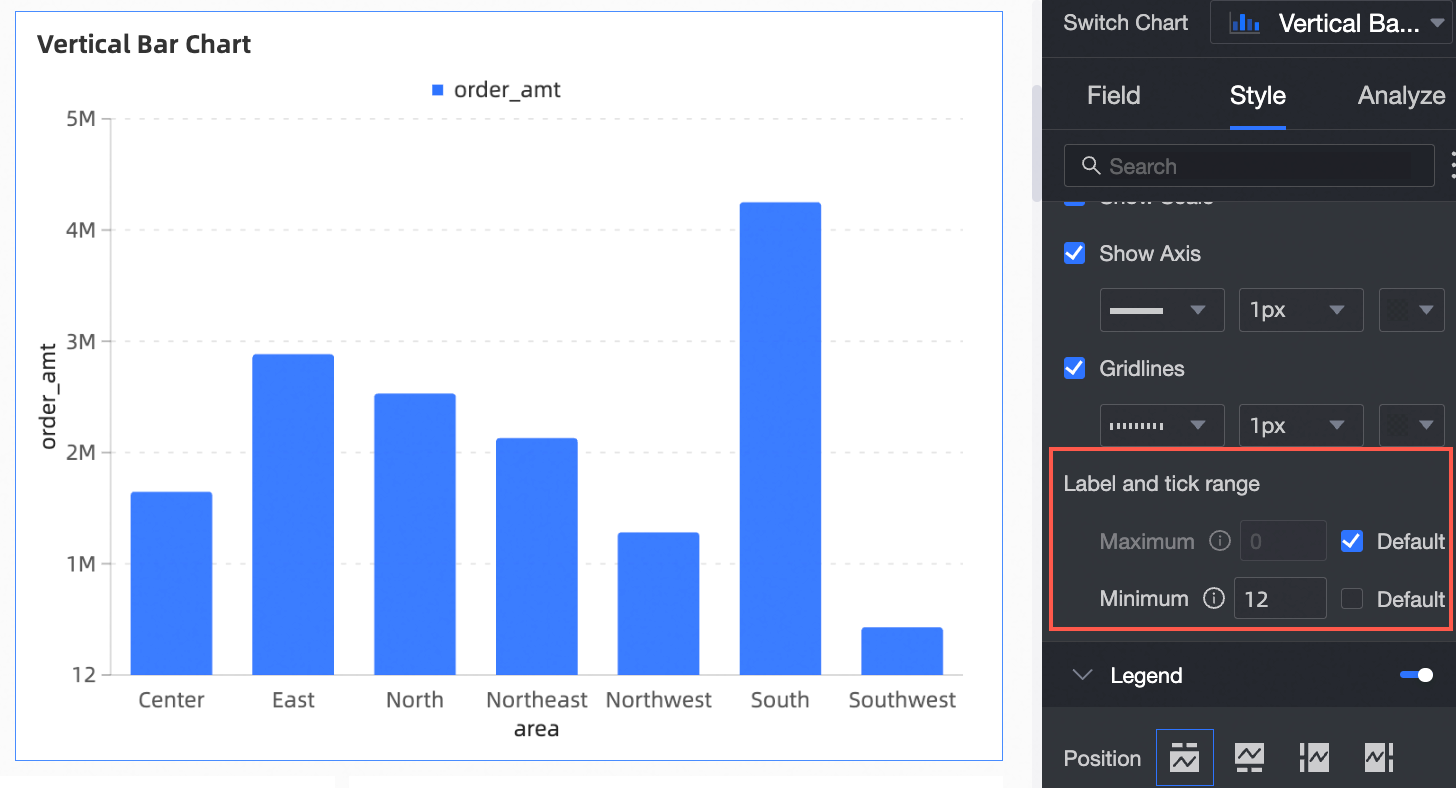
You can configure labels and scale ranges for line charts, column chart charts, metric trend charts, scatter charts, bubble charts, and facet scatter charts.
Same-month-on-month comparison computational logic optimization.
For more information, see Comparison.
The axis configuration capability of coordinate axis charts such as indicator trend charts is optimized.
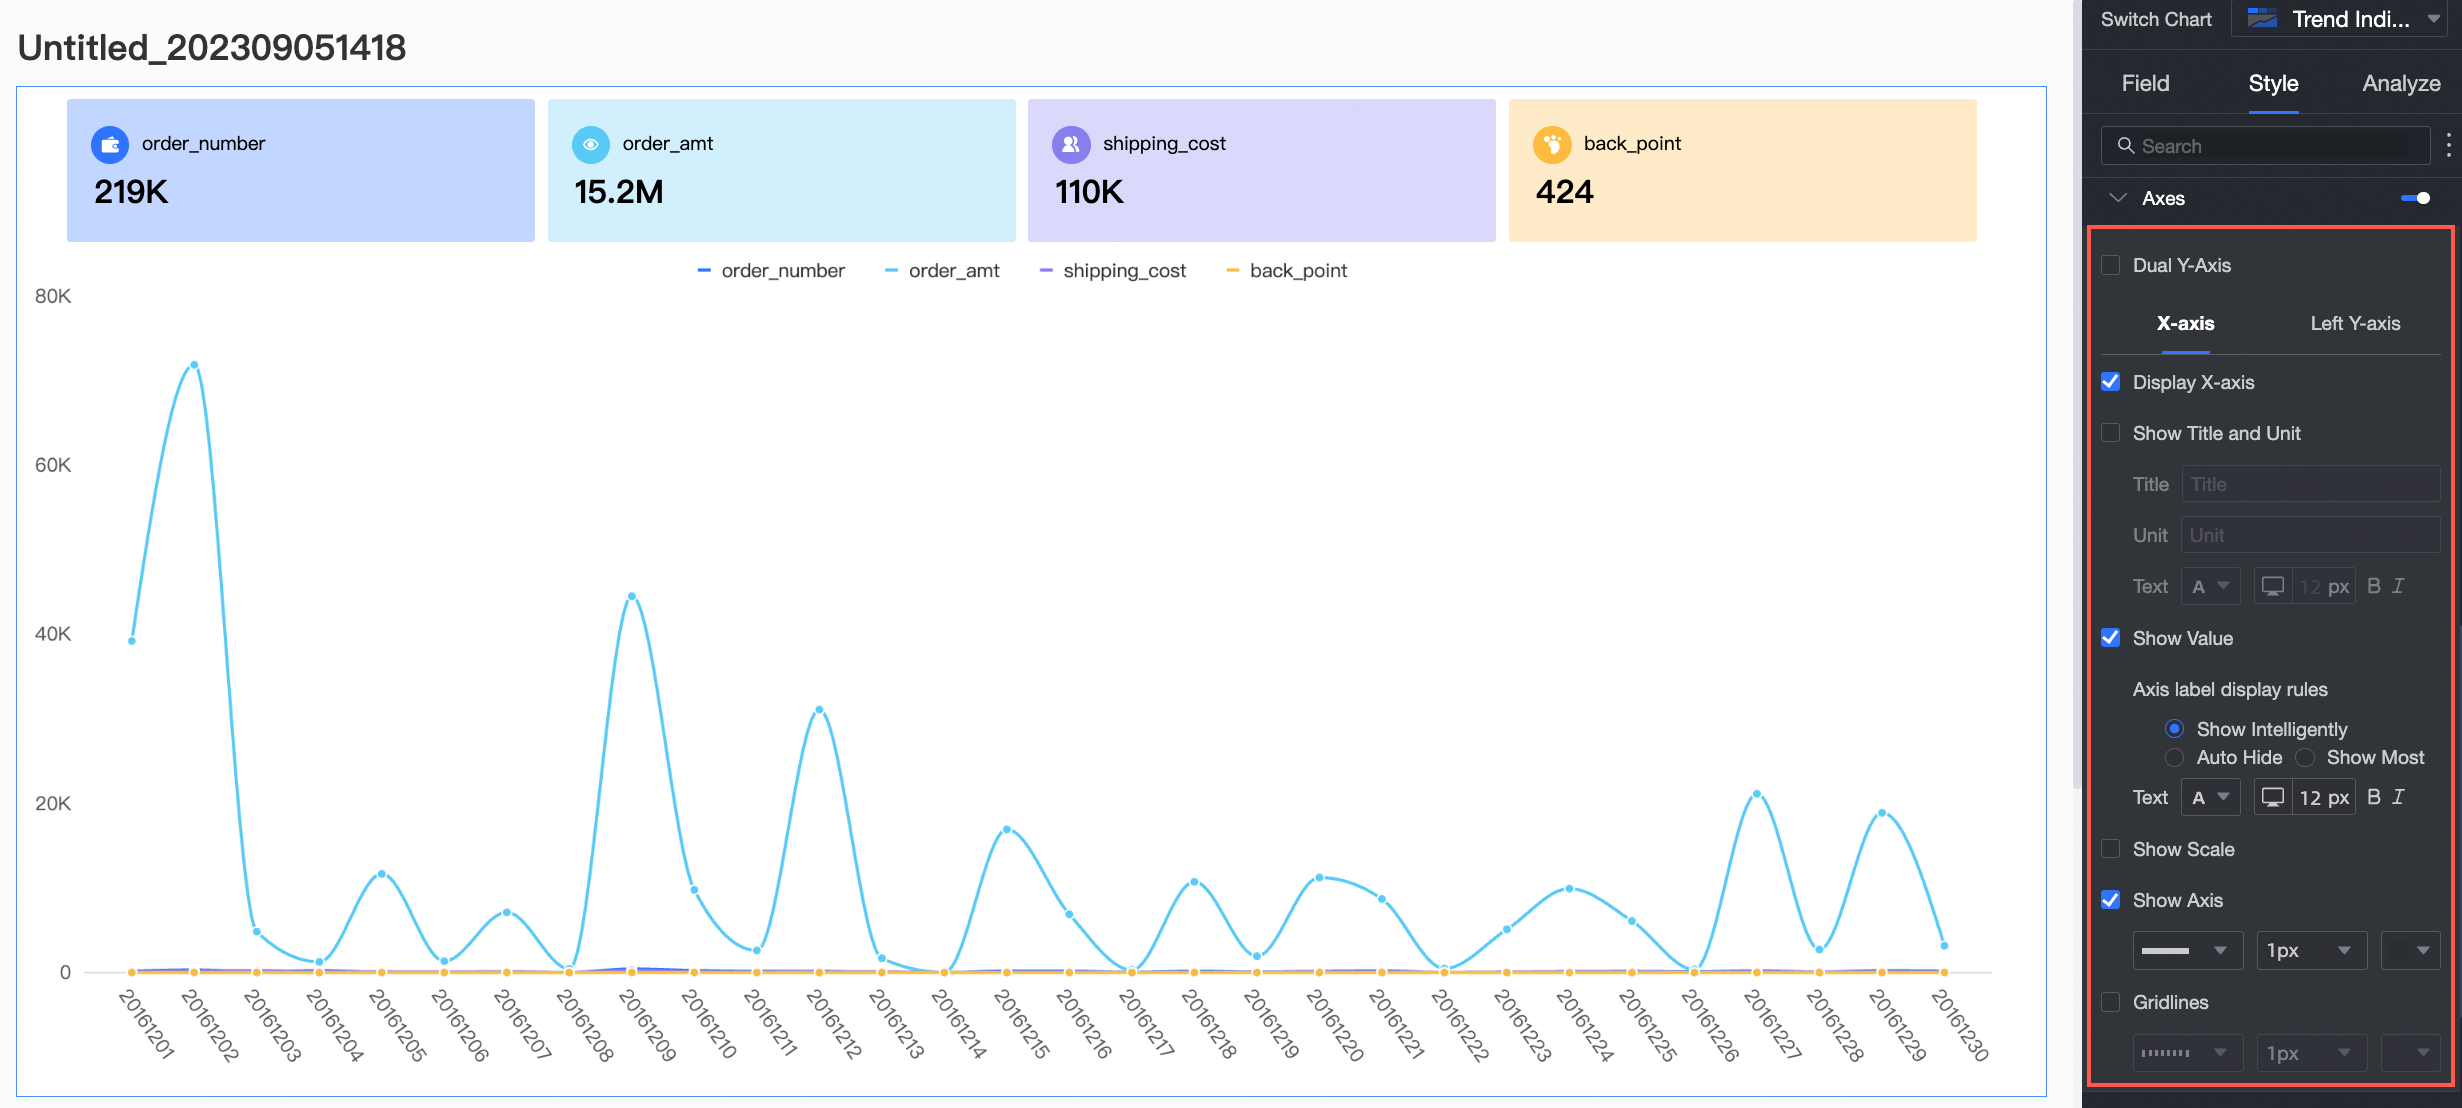
For more information, see Indicator Trend Chart.
Optional summary data display when the comparison date is added to the indicator diagram.
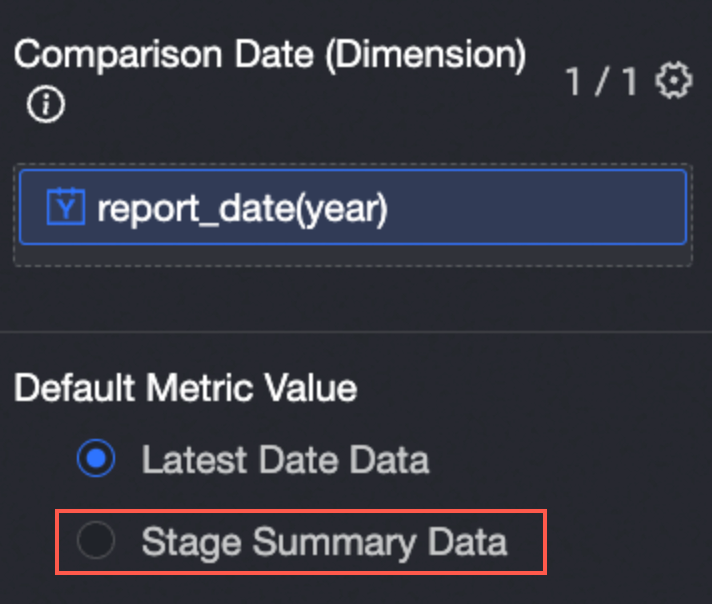
For more information, see Metric diagram.
Hologres
A pop-up window is displayed to fully upgrade the jump configuration. You can refine the jump granularity to the chart level.
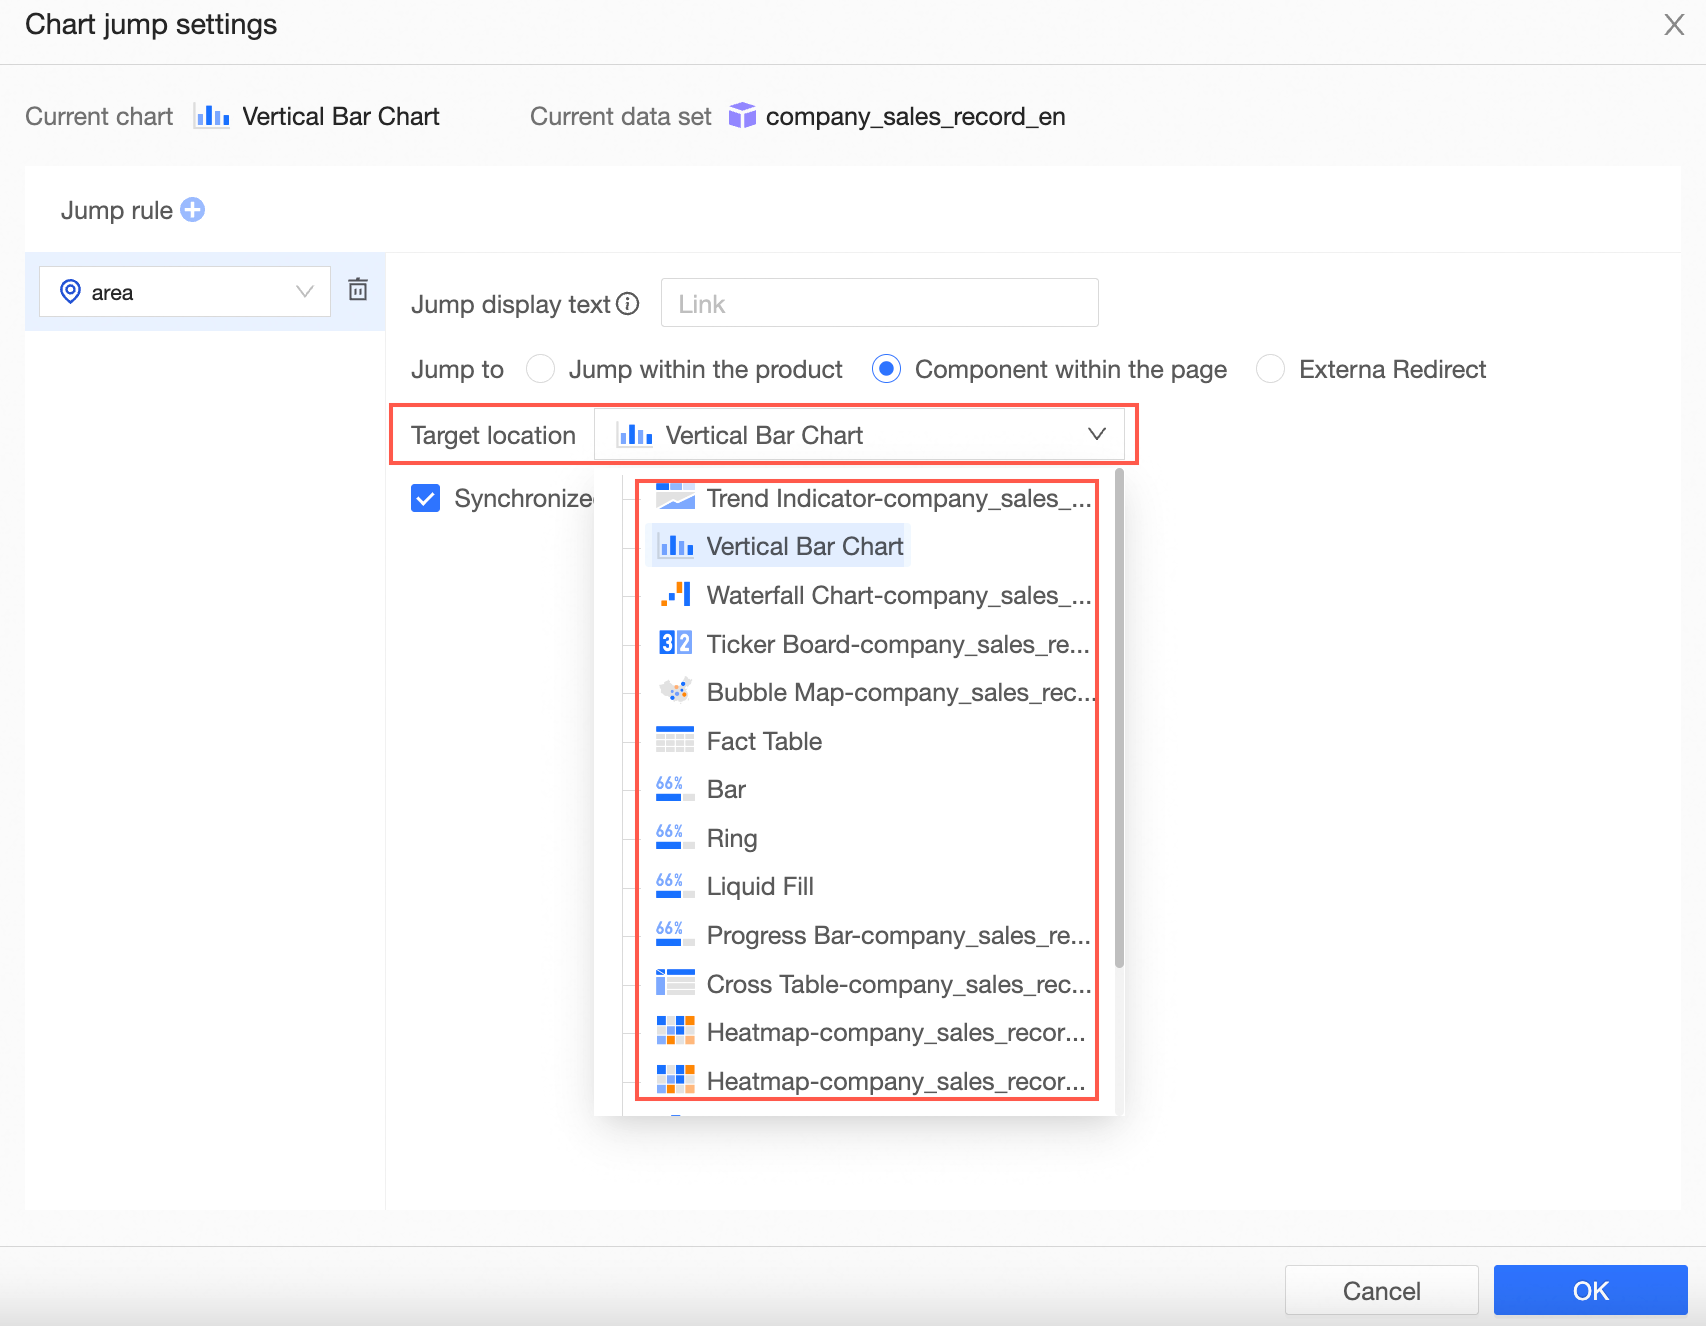
For more information, see Hyperlink.
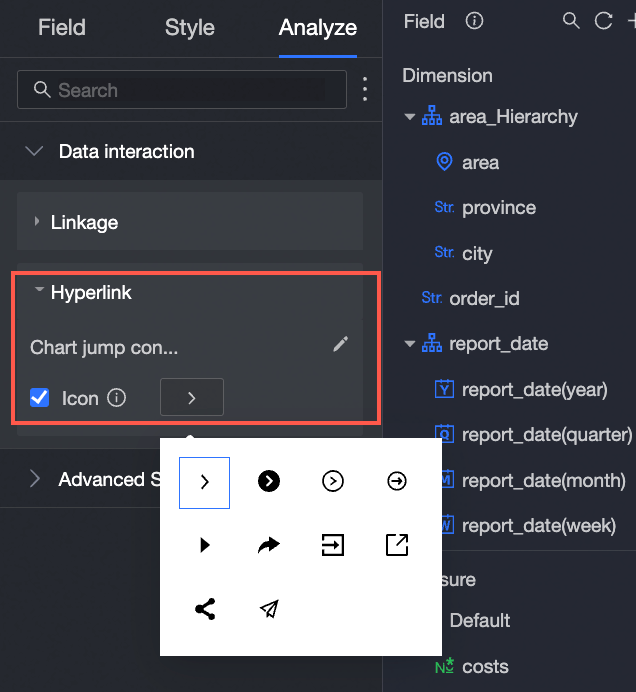
You can customize the style of jump operations on the chart, making interactive operations more flexible.
For more information, see Configure a redirect style.
Added support for redirection in indicator diagrams.
For more information, see Metric diagram.
Jump support and linkage within the current work take effect at the same time.
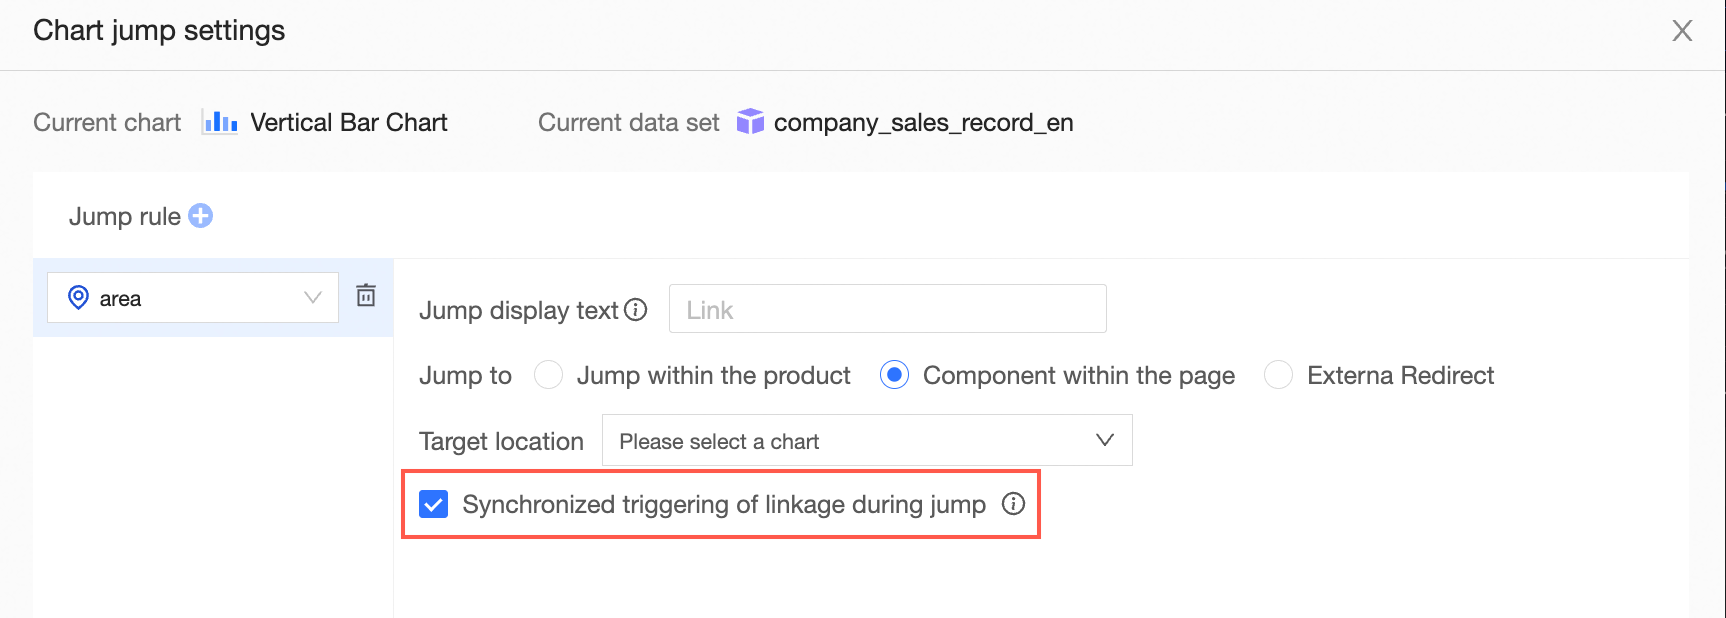
For more information, see Hyperlink.
Spreadsheet
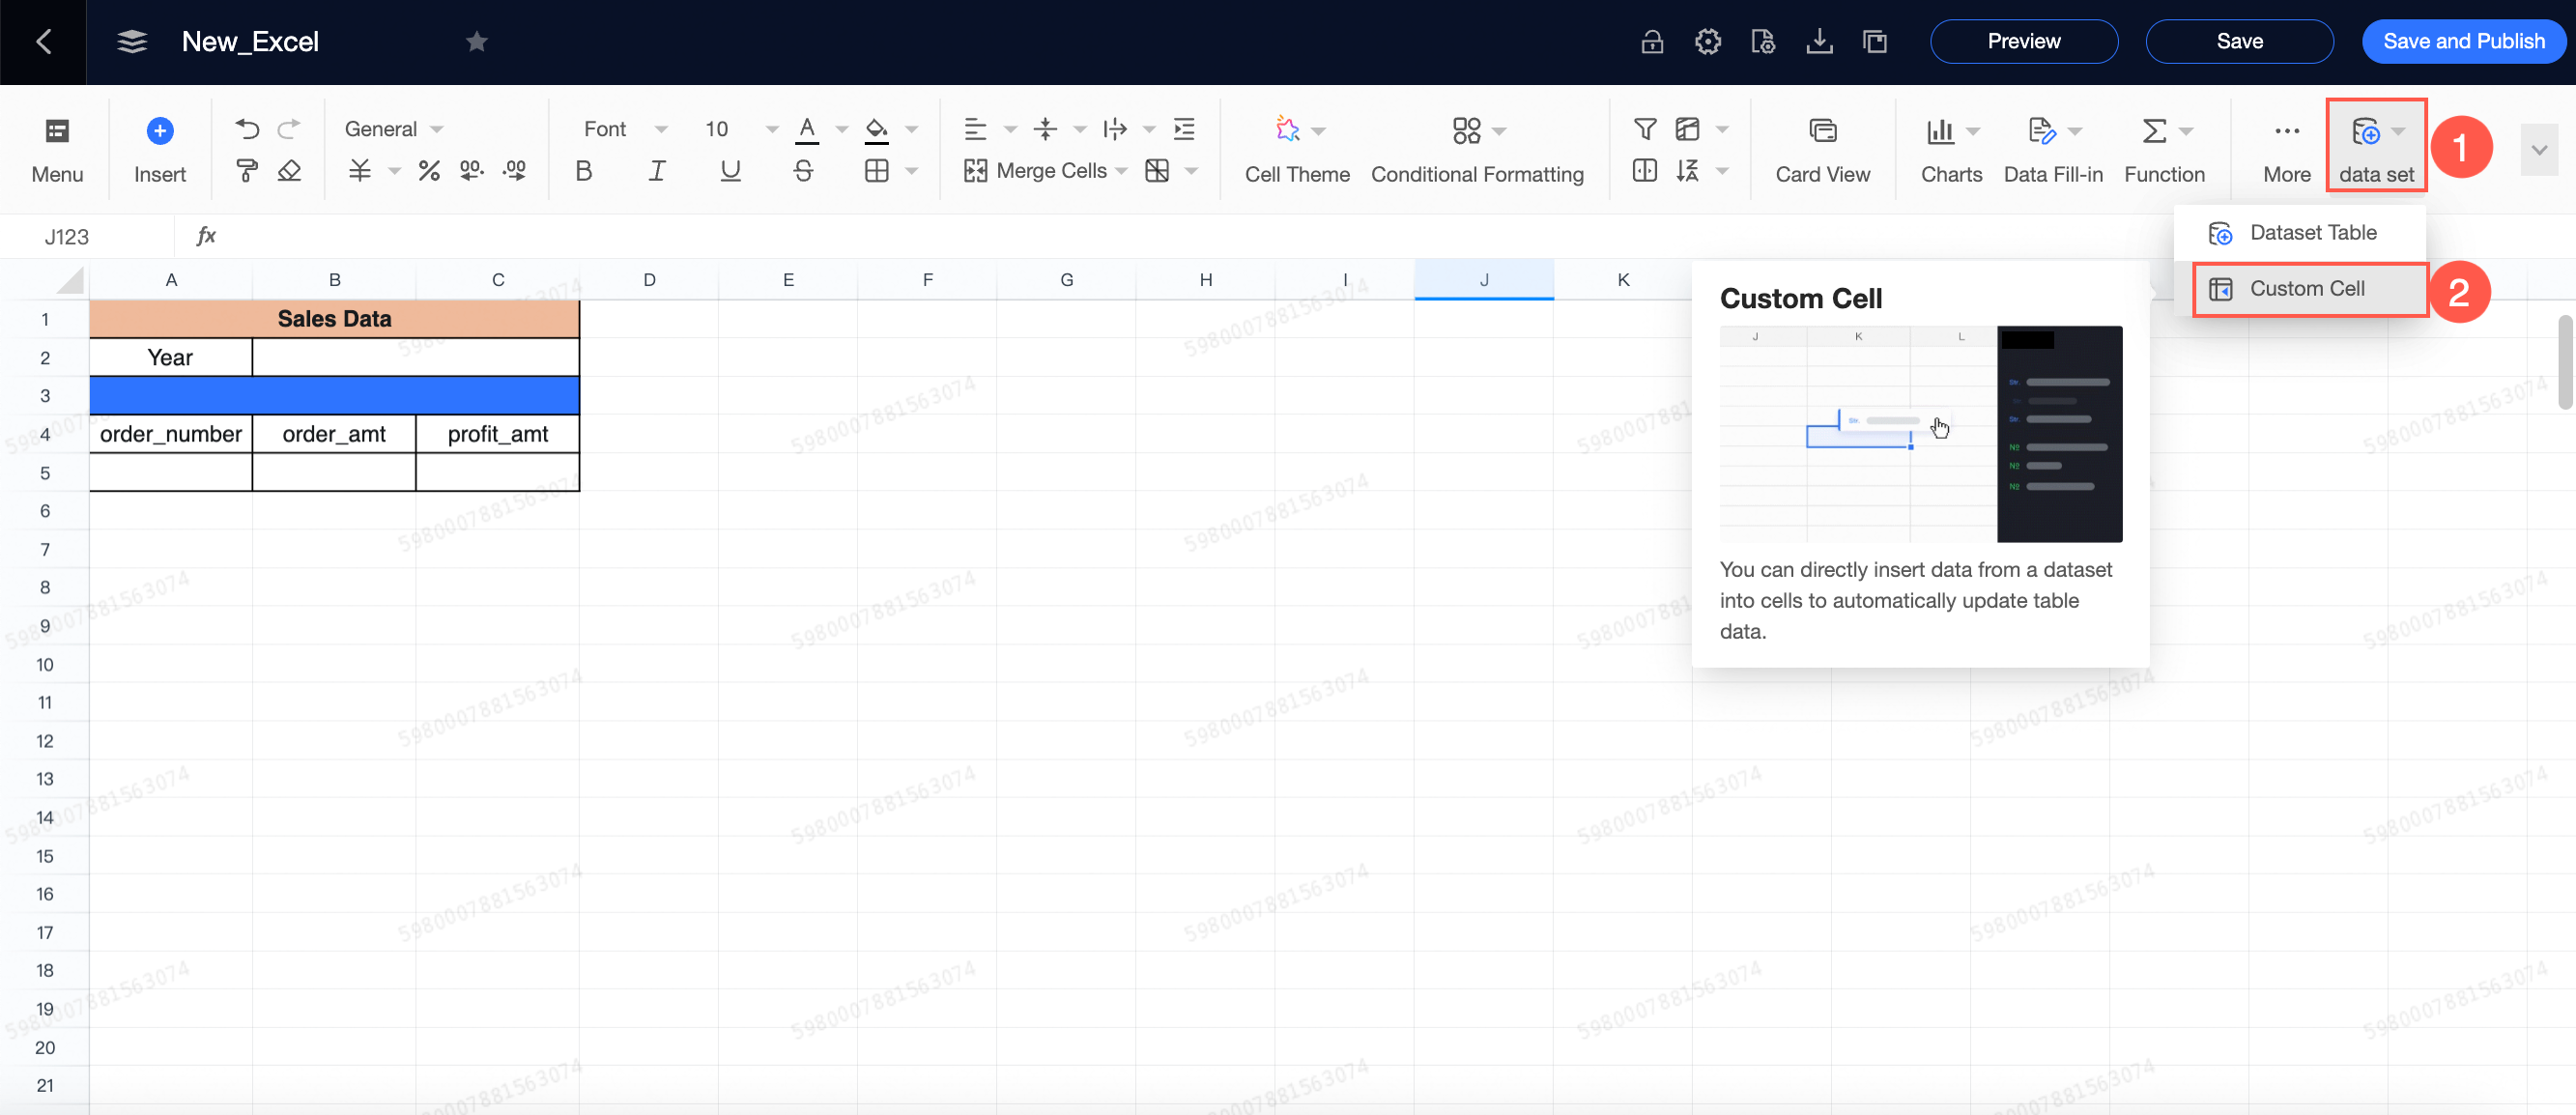
Professional Edition supports free-form cells. You can drag fields into datasets and set multiple aggregation and detail modes to easily build complex reports.
Professional Edition supports the card view, which allows you to quickly create column-by-column reports and visualize metrics in reports.
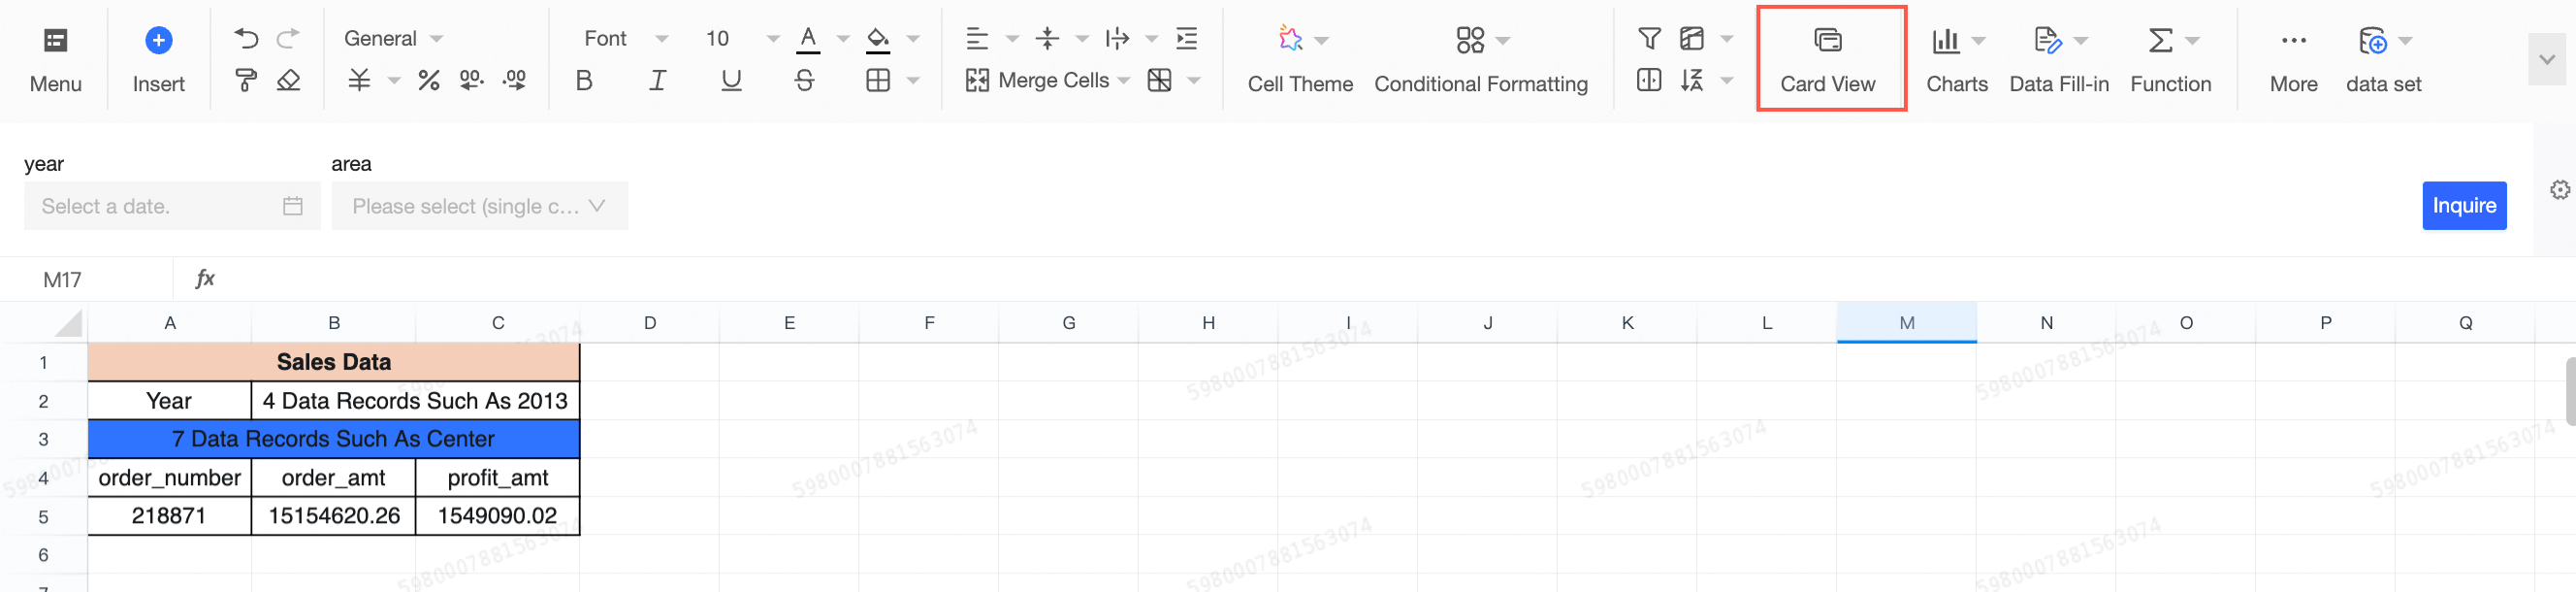
See Card view.
Professional Edition allows you to view data by page. This allows you to easily display large amounts of data.
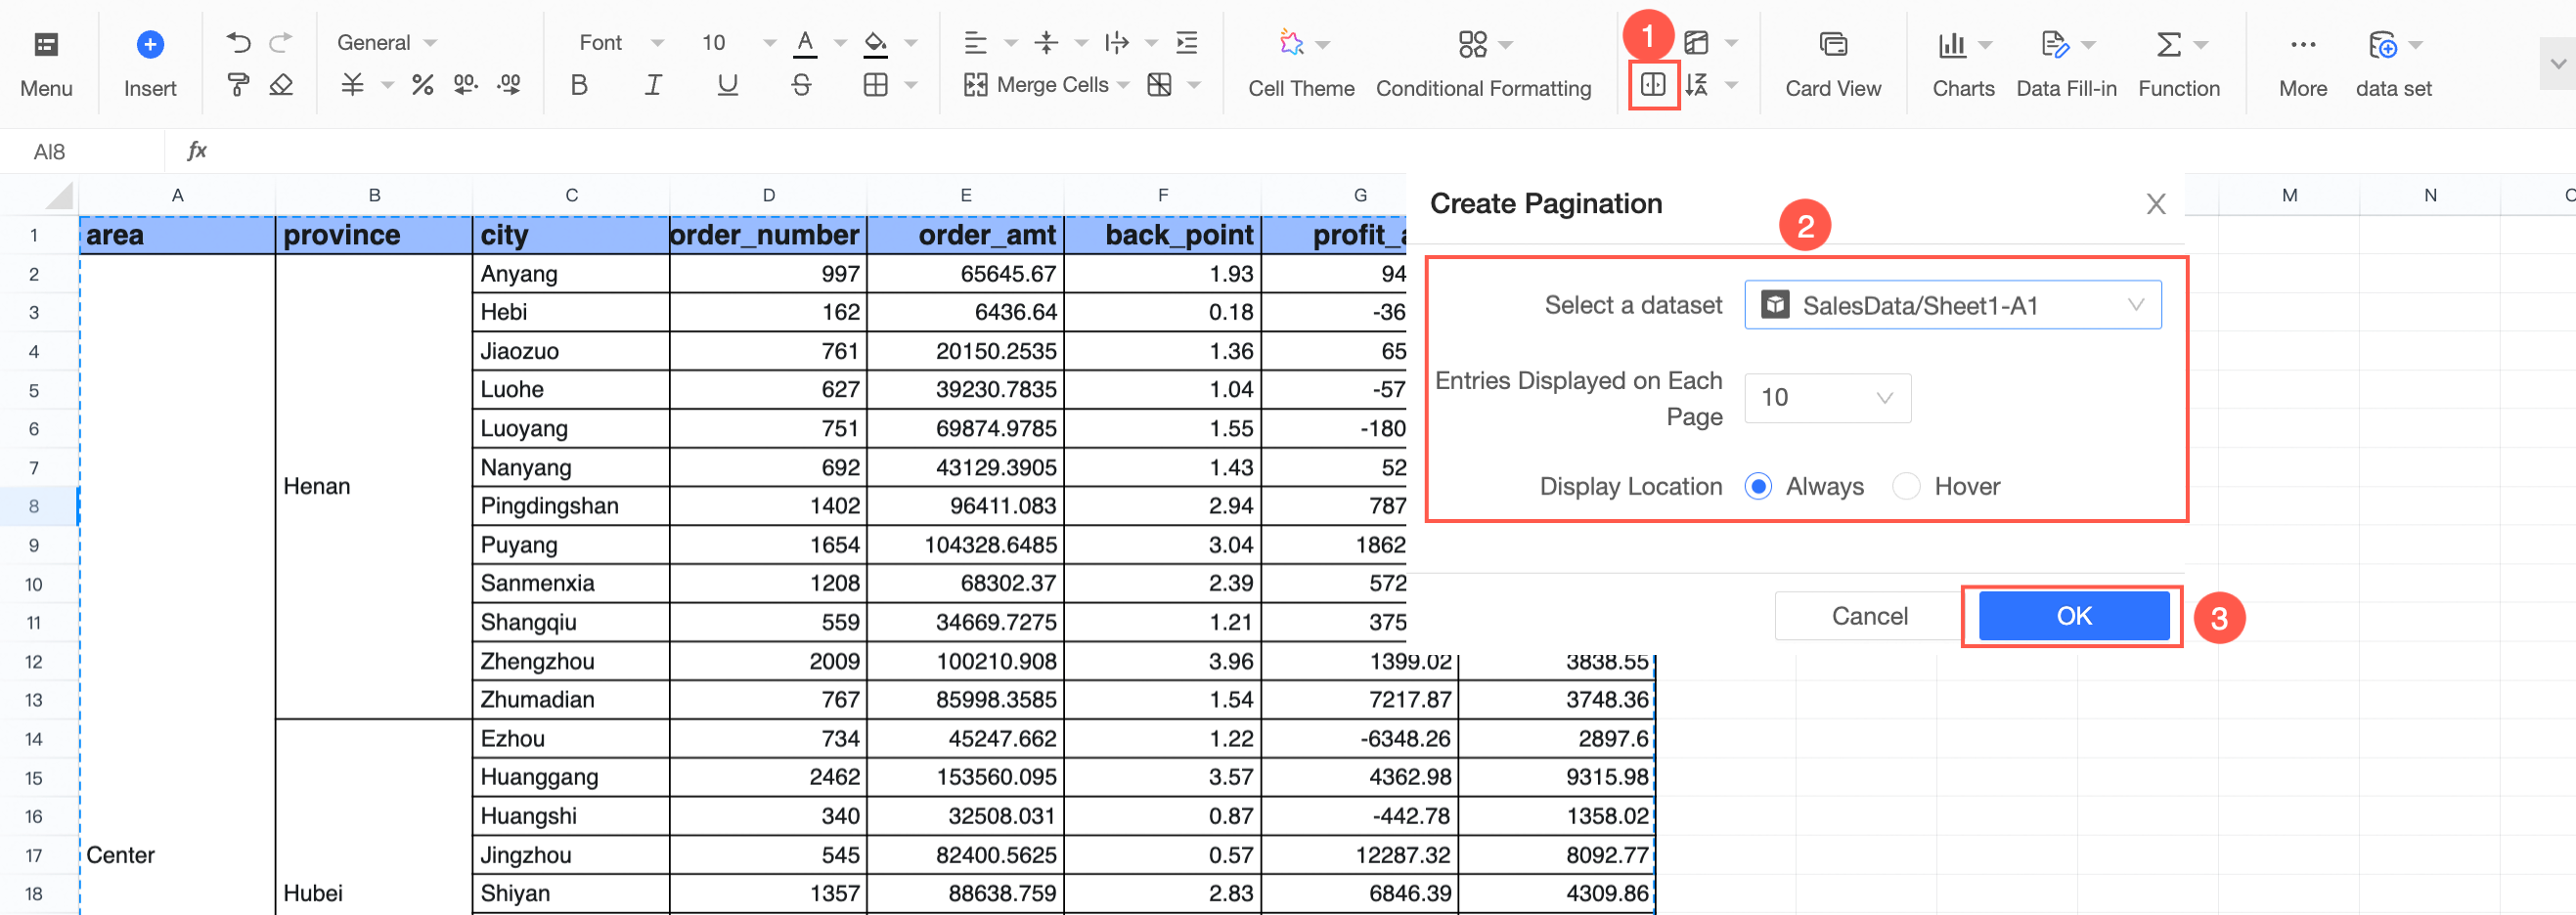
For more information, see Create a pagination.
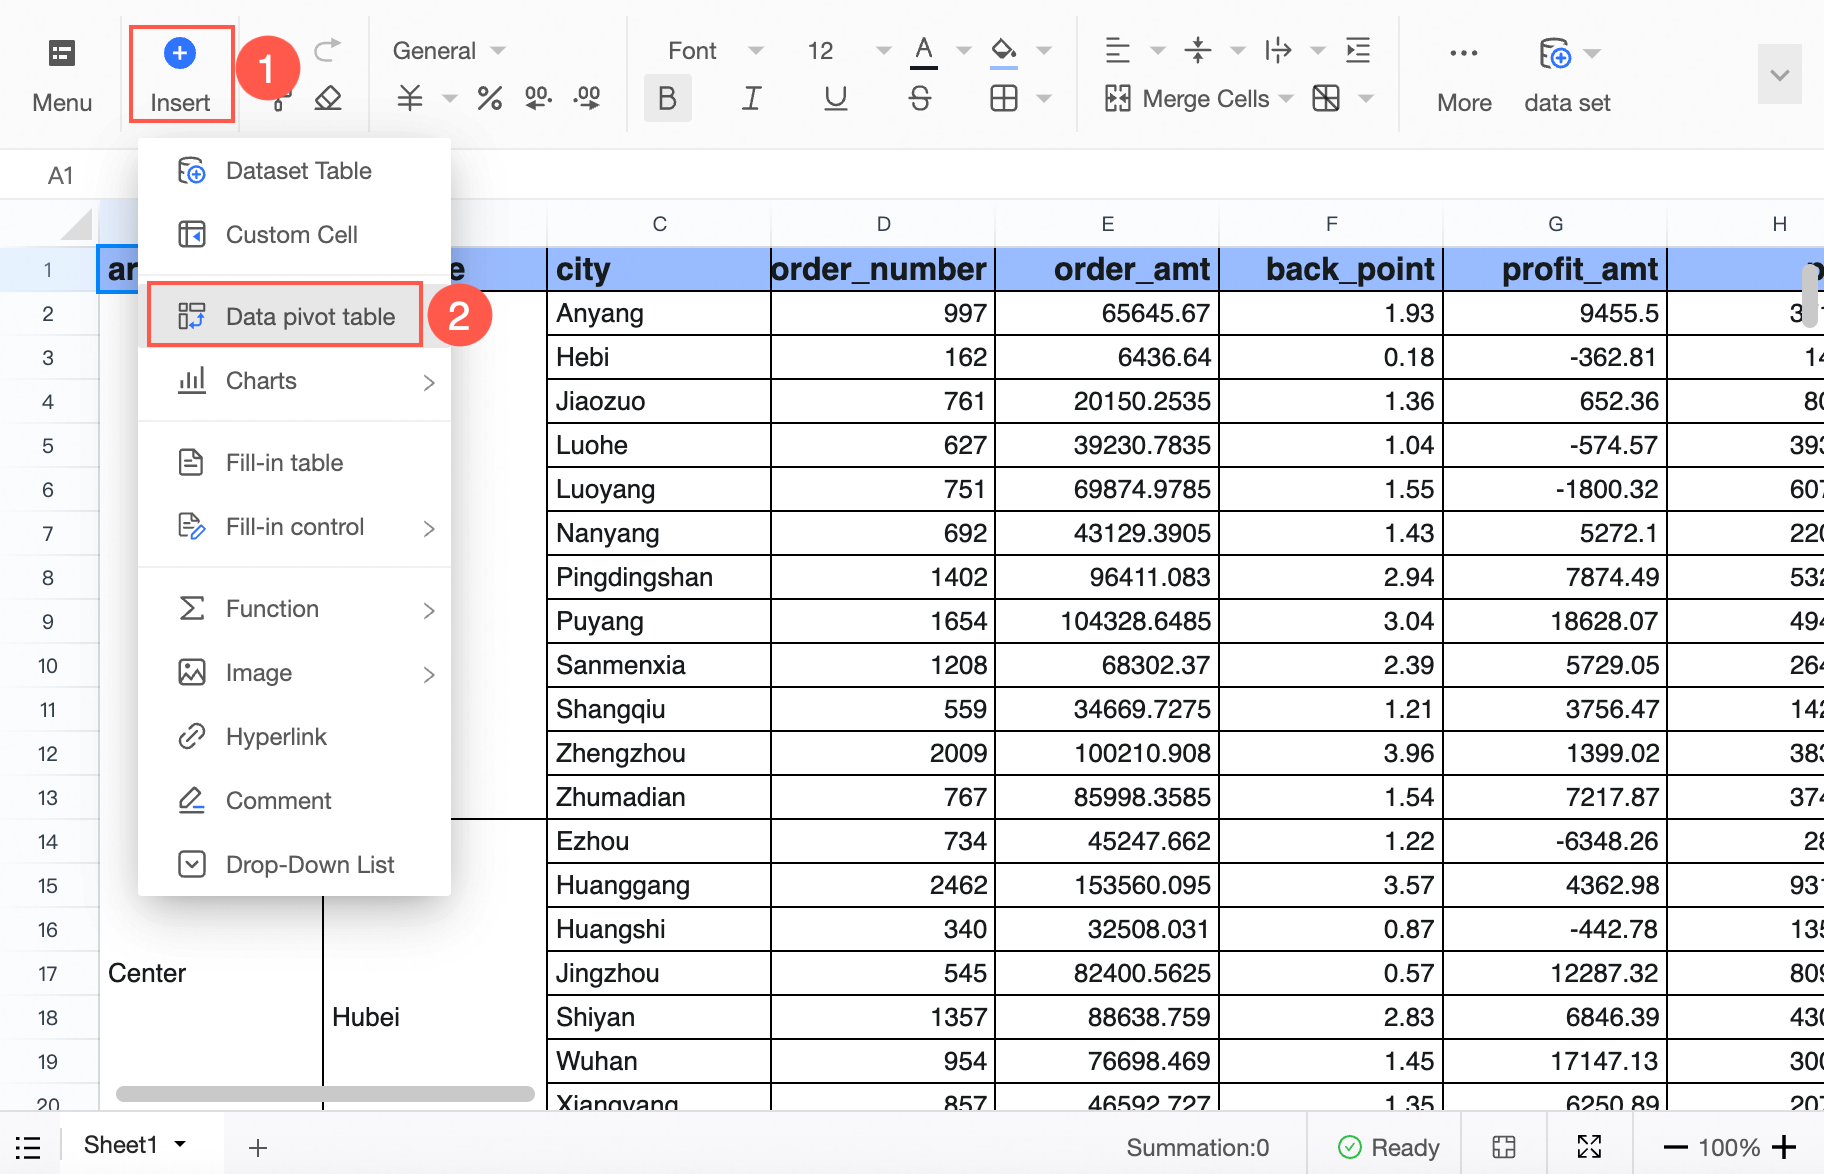
The Professional Edition supports data pivot table. You can use Excel to calculate, summarize, and analyze data.
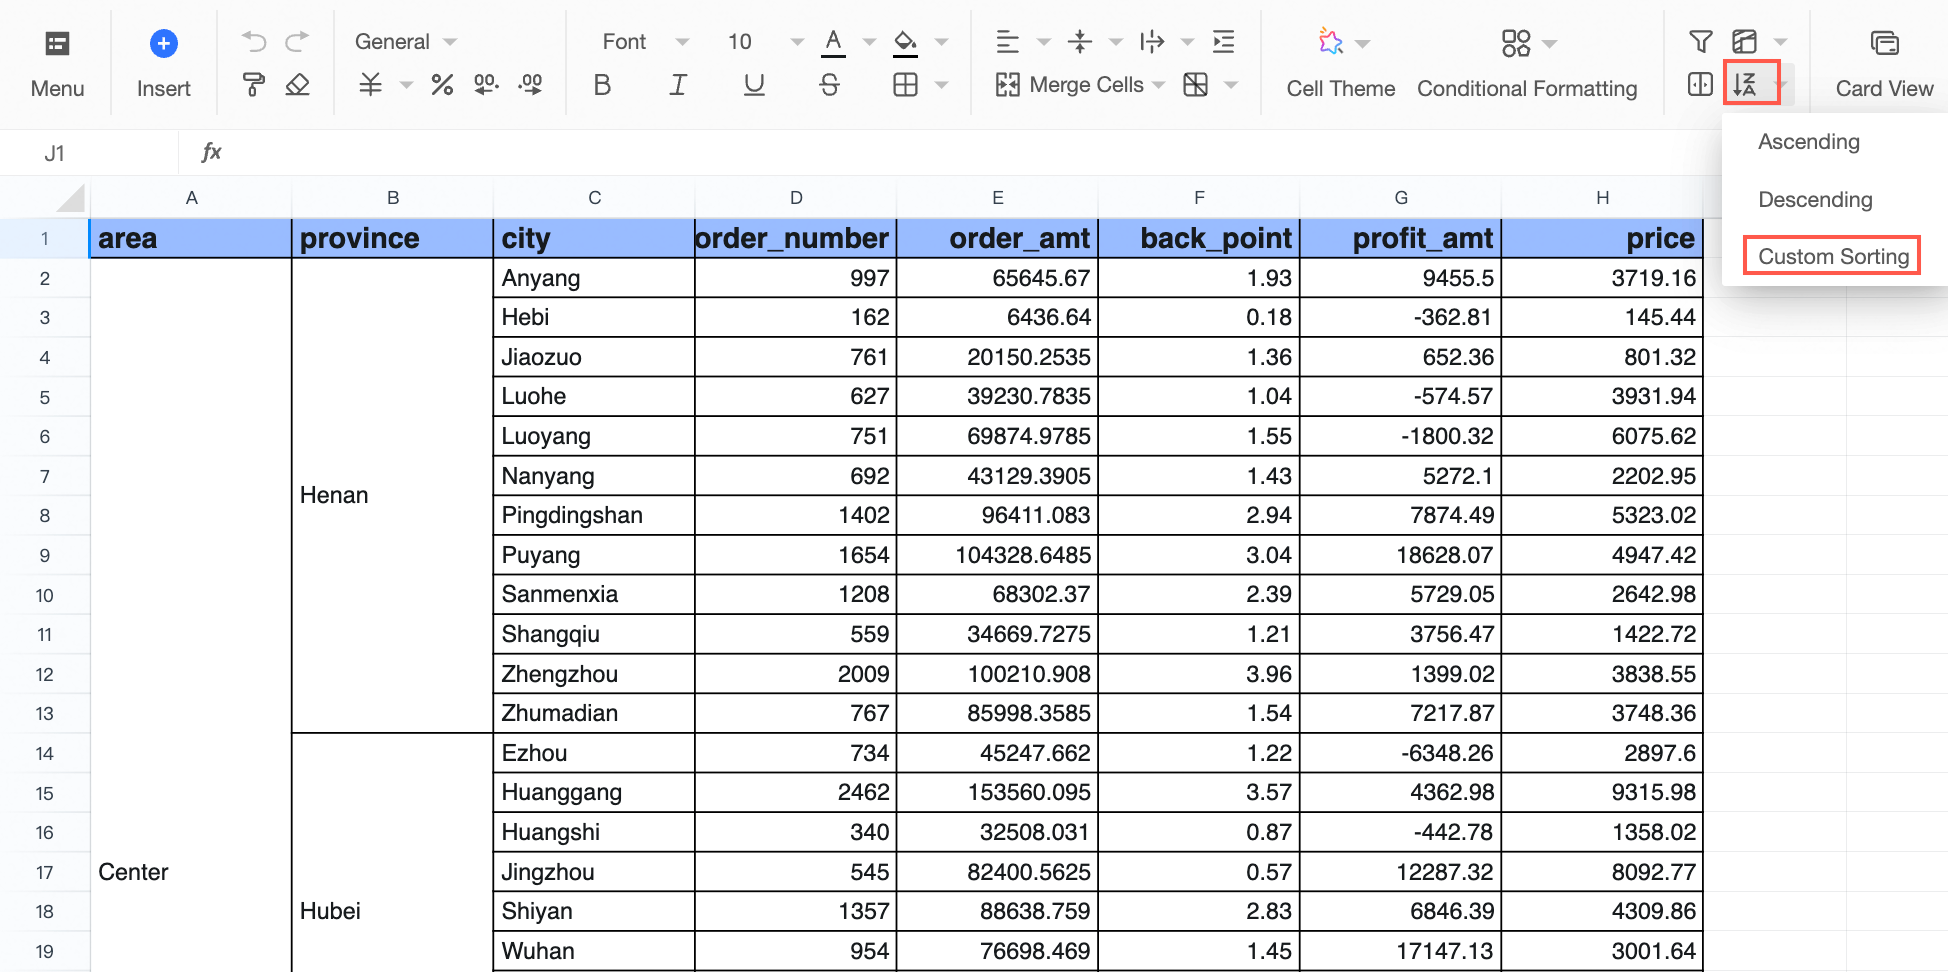
Added custom sorting capabilities.
Added the ability of Excel automatic sum identification.
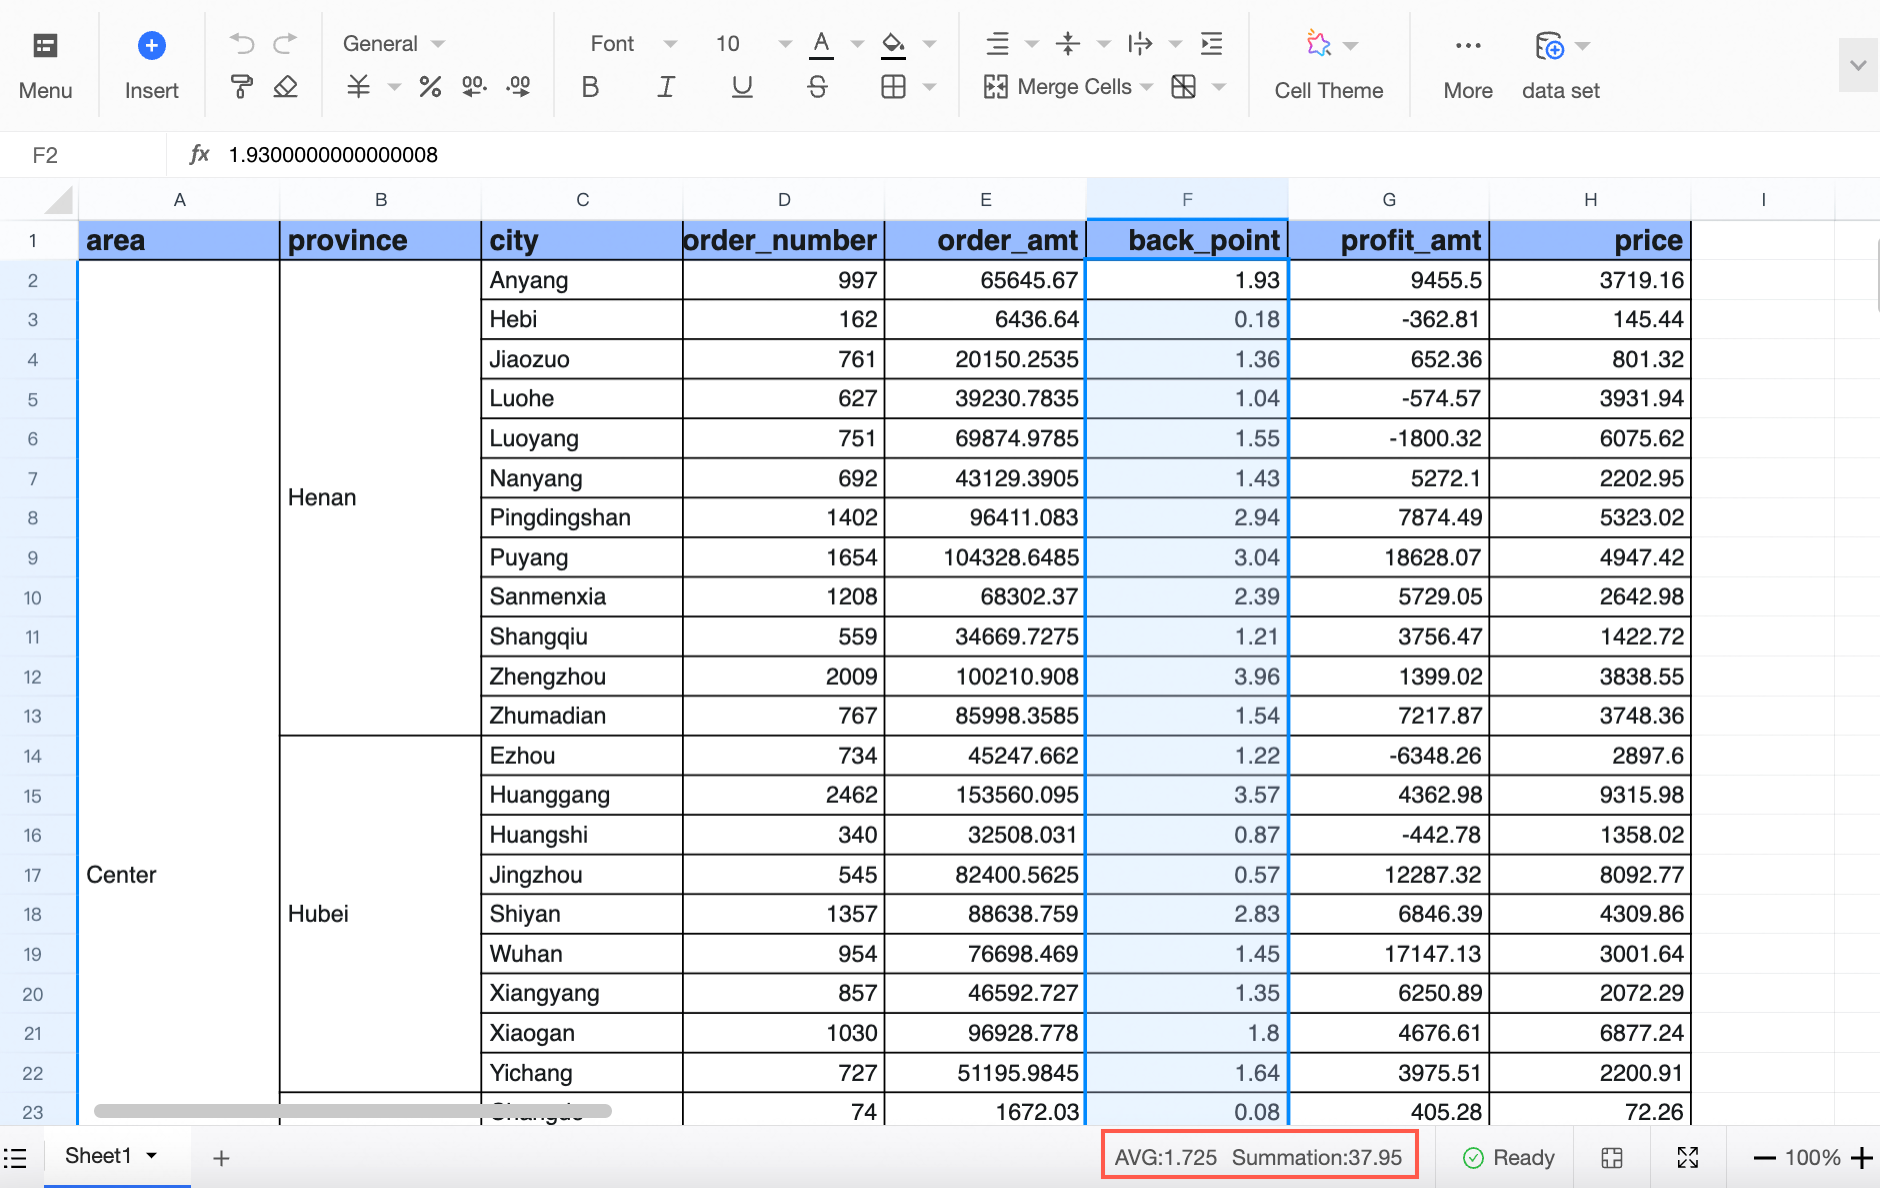
The workbook supports delayed formula calculation and starts formula calculation after the dataset is loaded. This improves the loading efficiency.
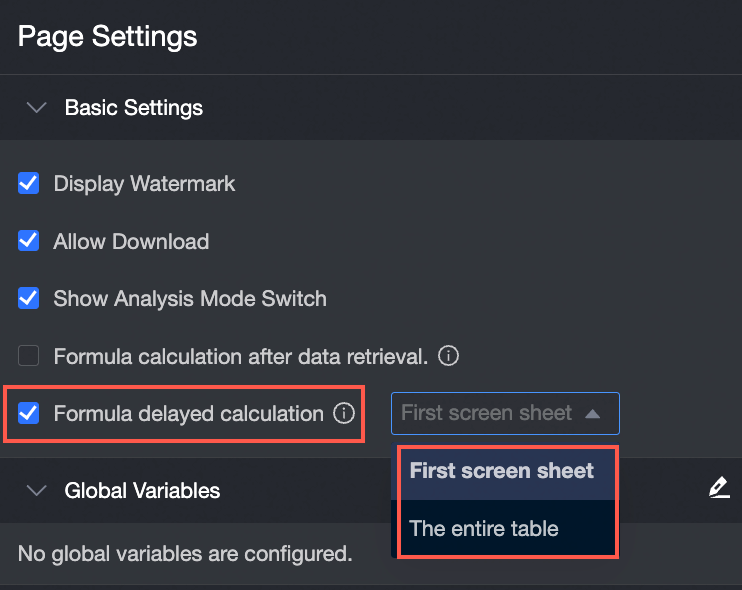
For more information, see Configure a Workbook.
Interactive form
The interactive reporting capability is introduced, which allows you to fill in data based on complex tables, comprehensively calculate the filling data and data set retrieval results, and complete data reporting and analysis in one stop.
Supports collecting and reporting data in the form of tables with high information density to meet various customized table formats.
Three filling paths are provided: cell filling, table filling, and dataset filling.
A variety of basic controls and business controls meet different reporting scenarios, such as financial budgeting, manufacturing production reporting, quality inspection, and retail target dismantling.
For more information, see Fill in complex tables.
Custom role
The new "custom role permission system" is introduced to help enterprises secure and flexible organization and operation management.
From users, resources, to role permissions, it meets multi-level security compliance requirements of enterprises.
ApsaraDB for HBase allows users to be assigned multiple roles. ApsaraDB for HBase allows users to be assigned multiple roles at a time. This way, users can be assigned multiple roles at a time. This way, users can be managed in a unified manner and the boundaries of each role are clarified.
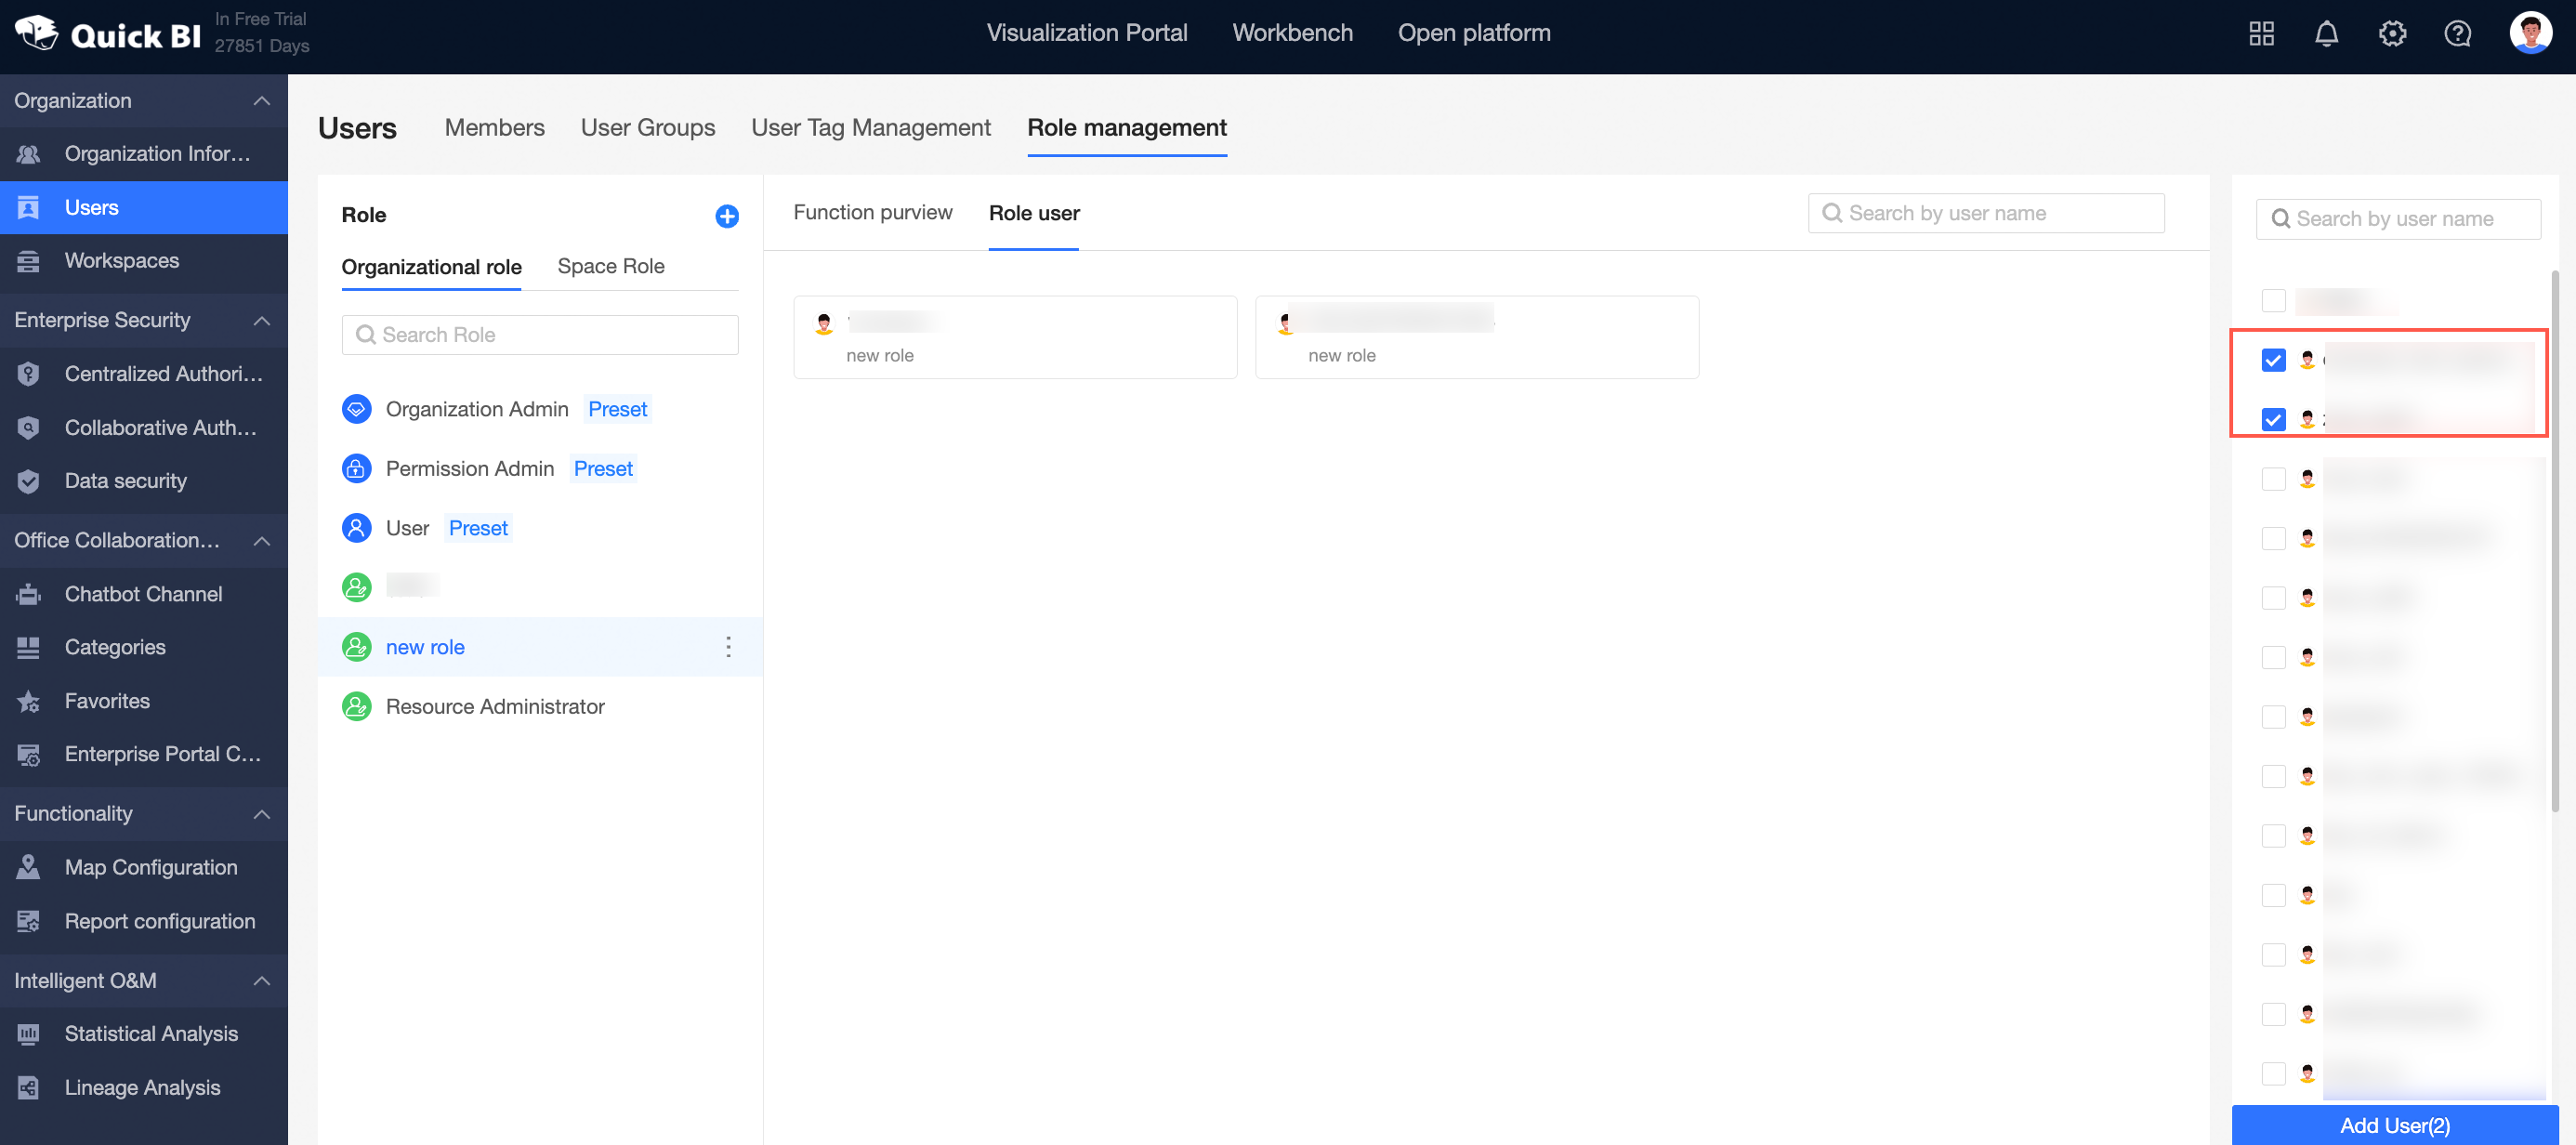
From organization-level to space-level roles, highly custom permission control is supported for each functional module, and each role performs its own duties within the scope of security assurance functions.
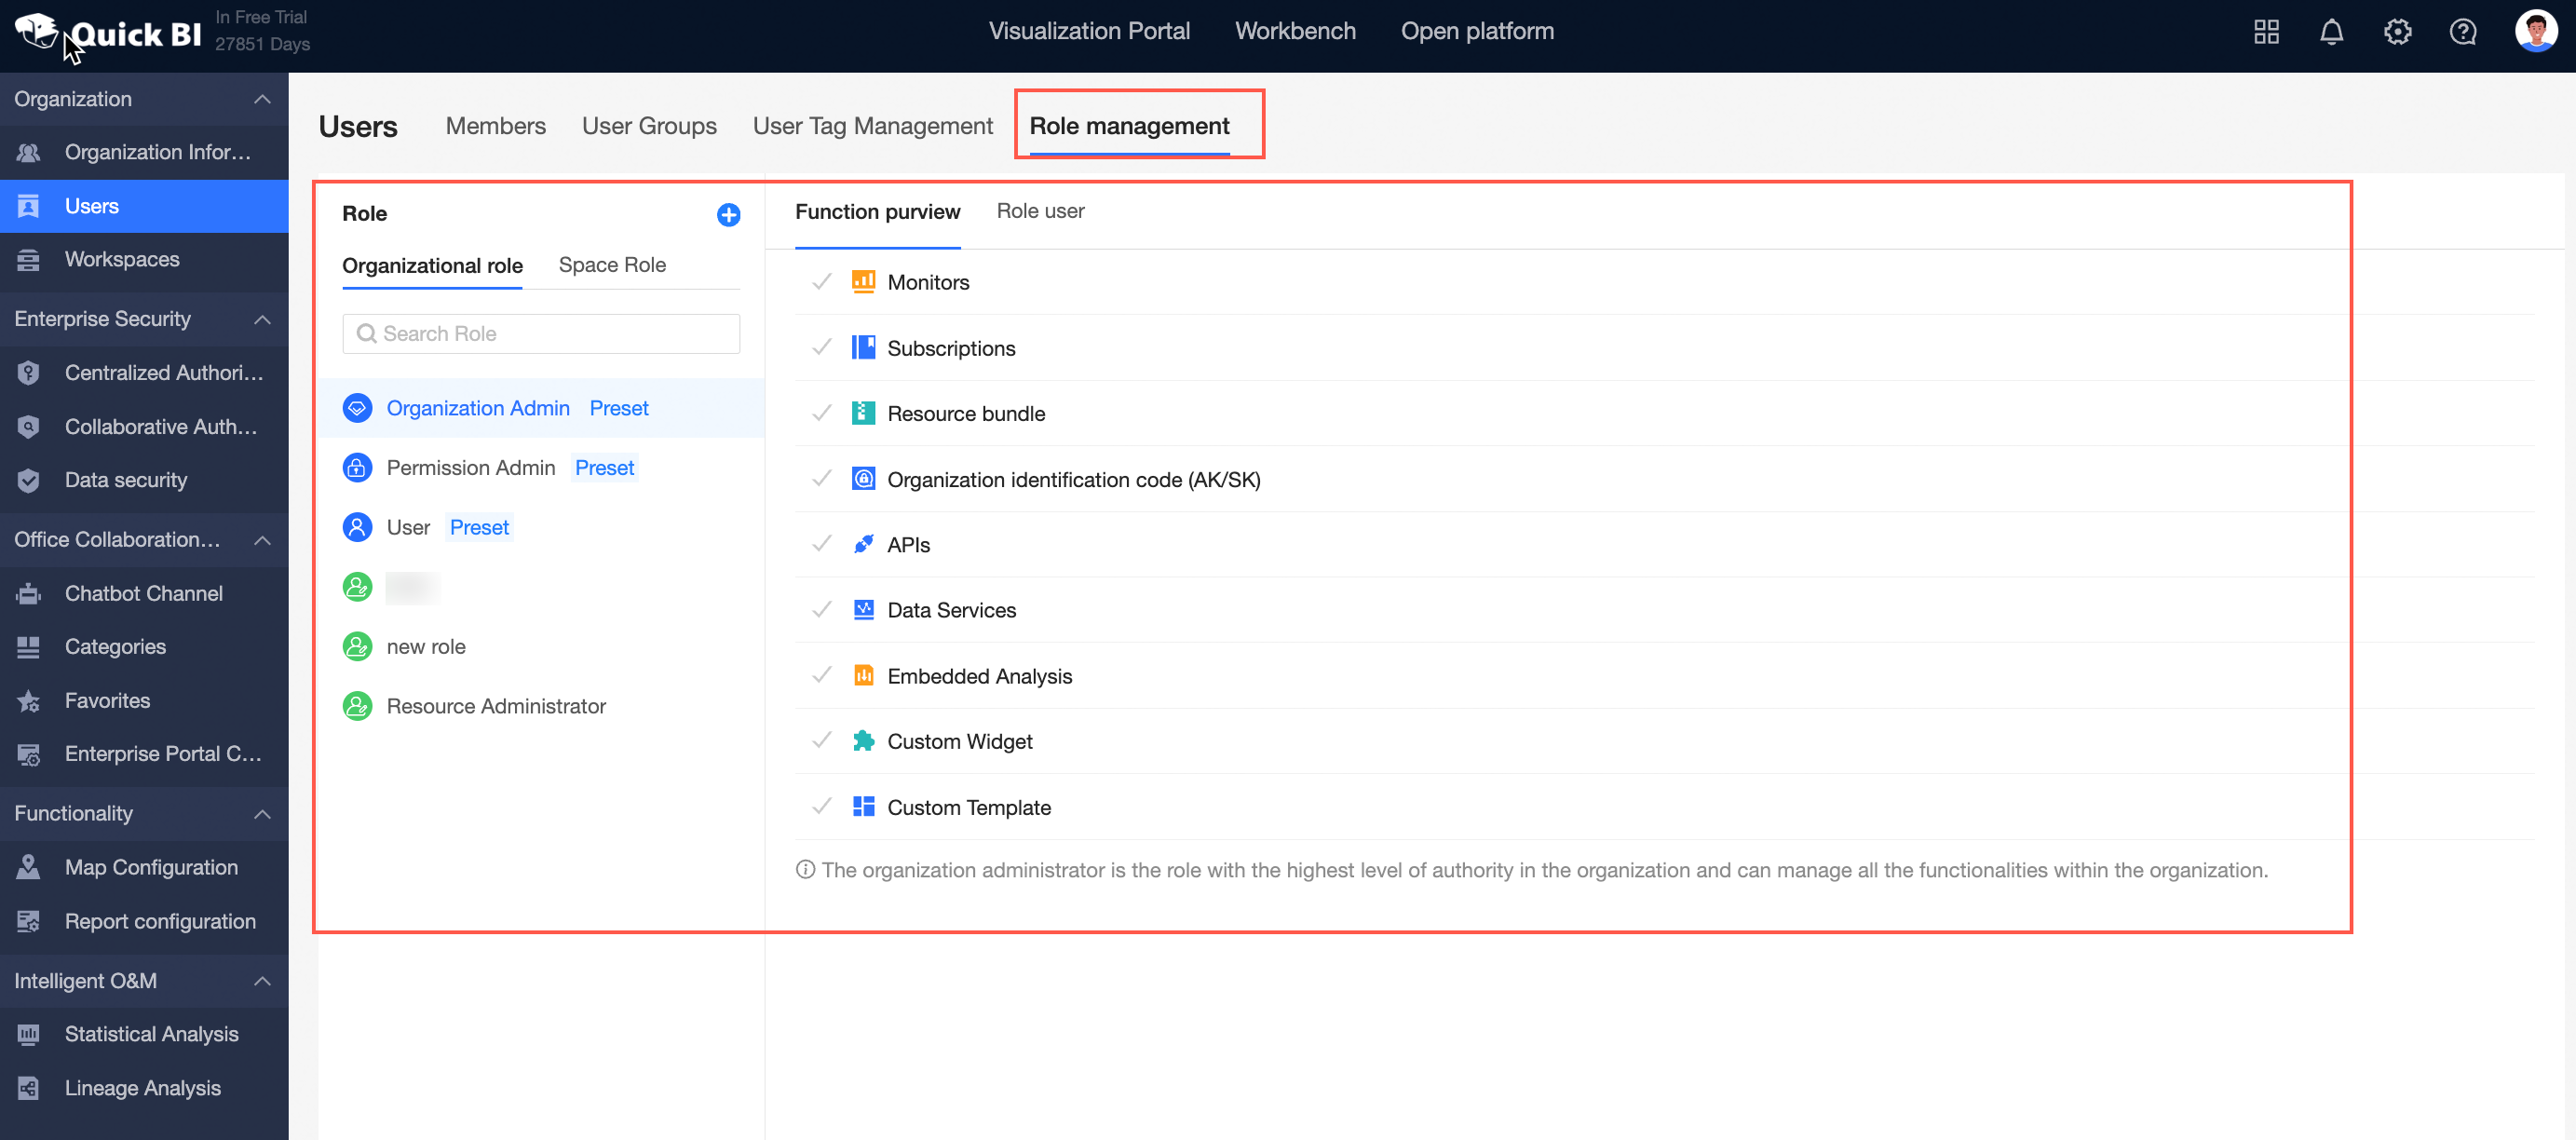
For more information, see Manage roles.
Data dashboard
Support custom screen scaling mode, display can be adaptive according to the display size, improve aesthetics.
For more information, see Overview.
You can compare dynamic fields in the conditional formats of the ticker board, threshold ticker board, ranking board, and detail table.
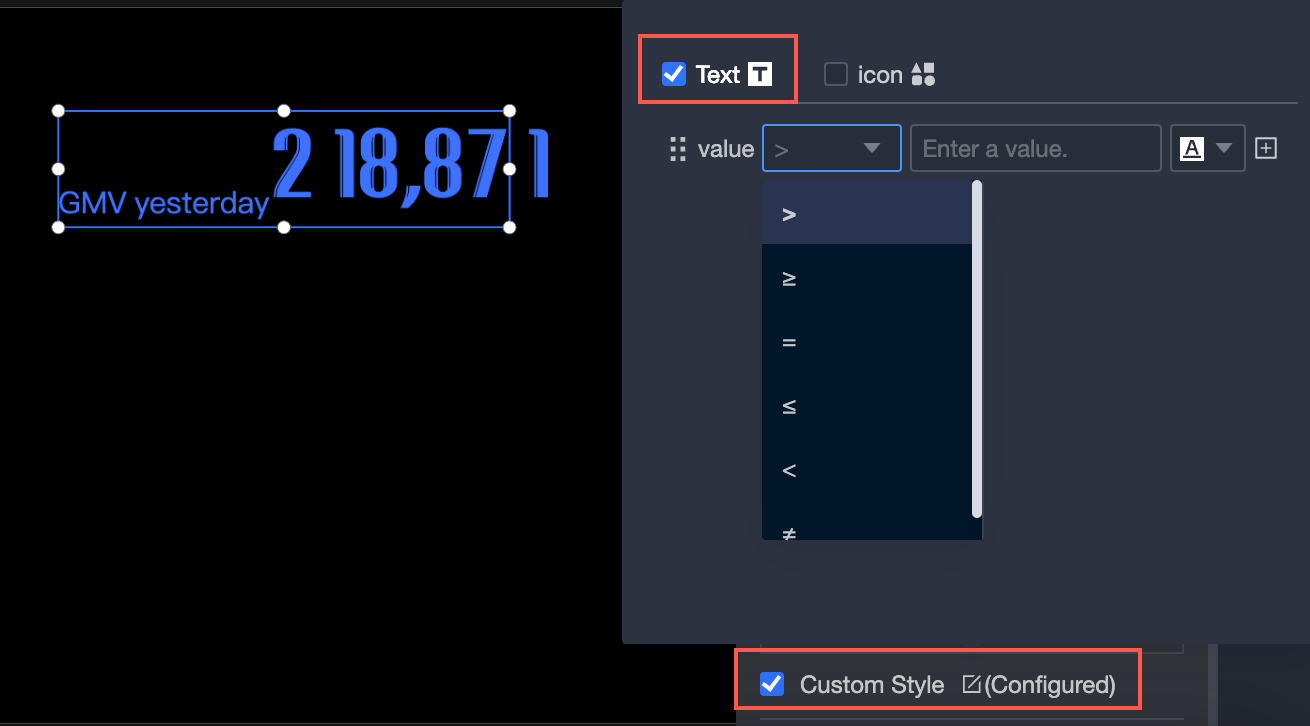
For more information, see Tilt Flip, Tilt Flip, Ranking, and Details.
A date picker is added to support the data big screen, and the video automatic playback experience is optimized.
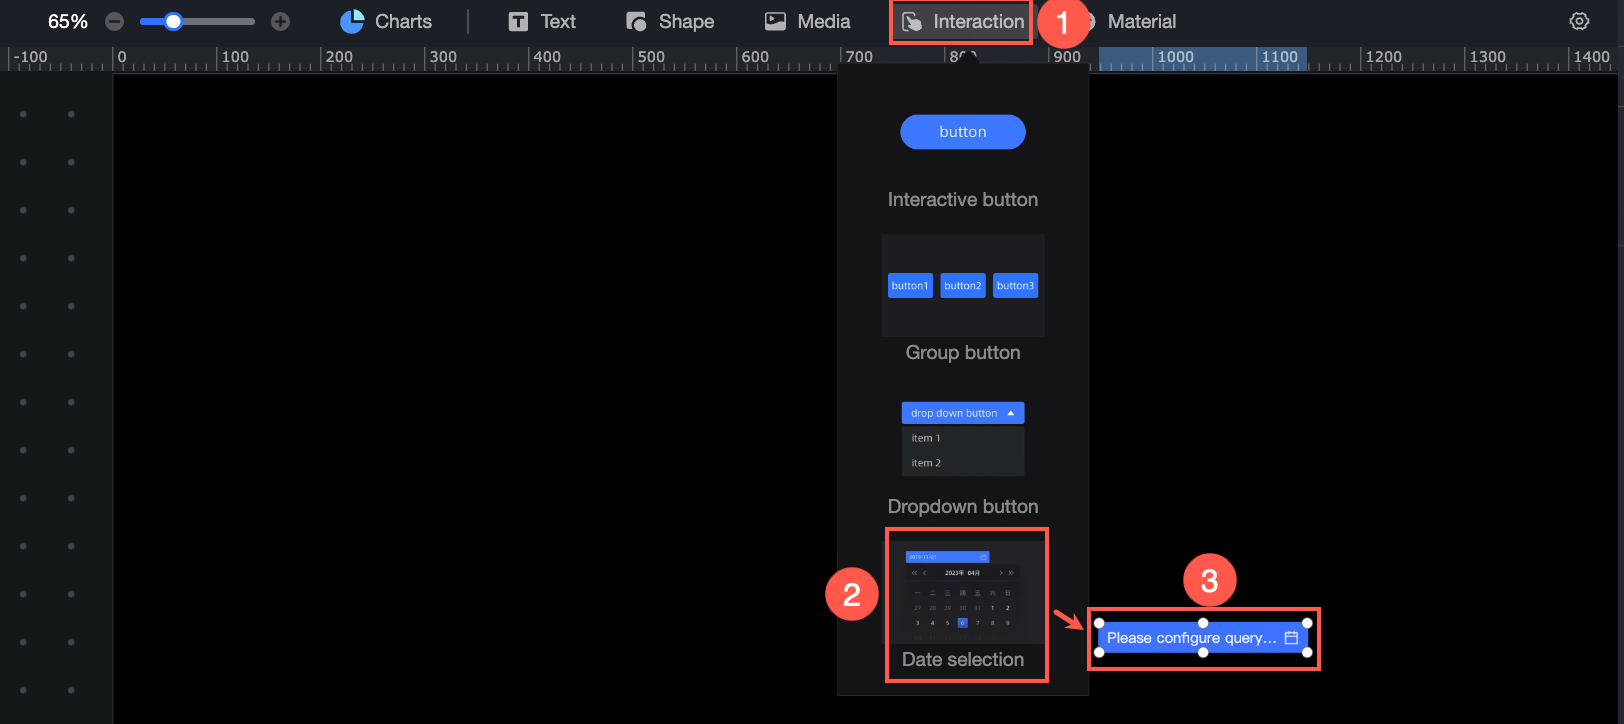
For more information, see Date Selection and Video.
Monitoring and Alerting
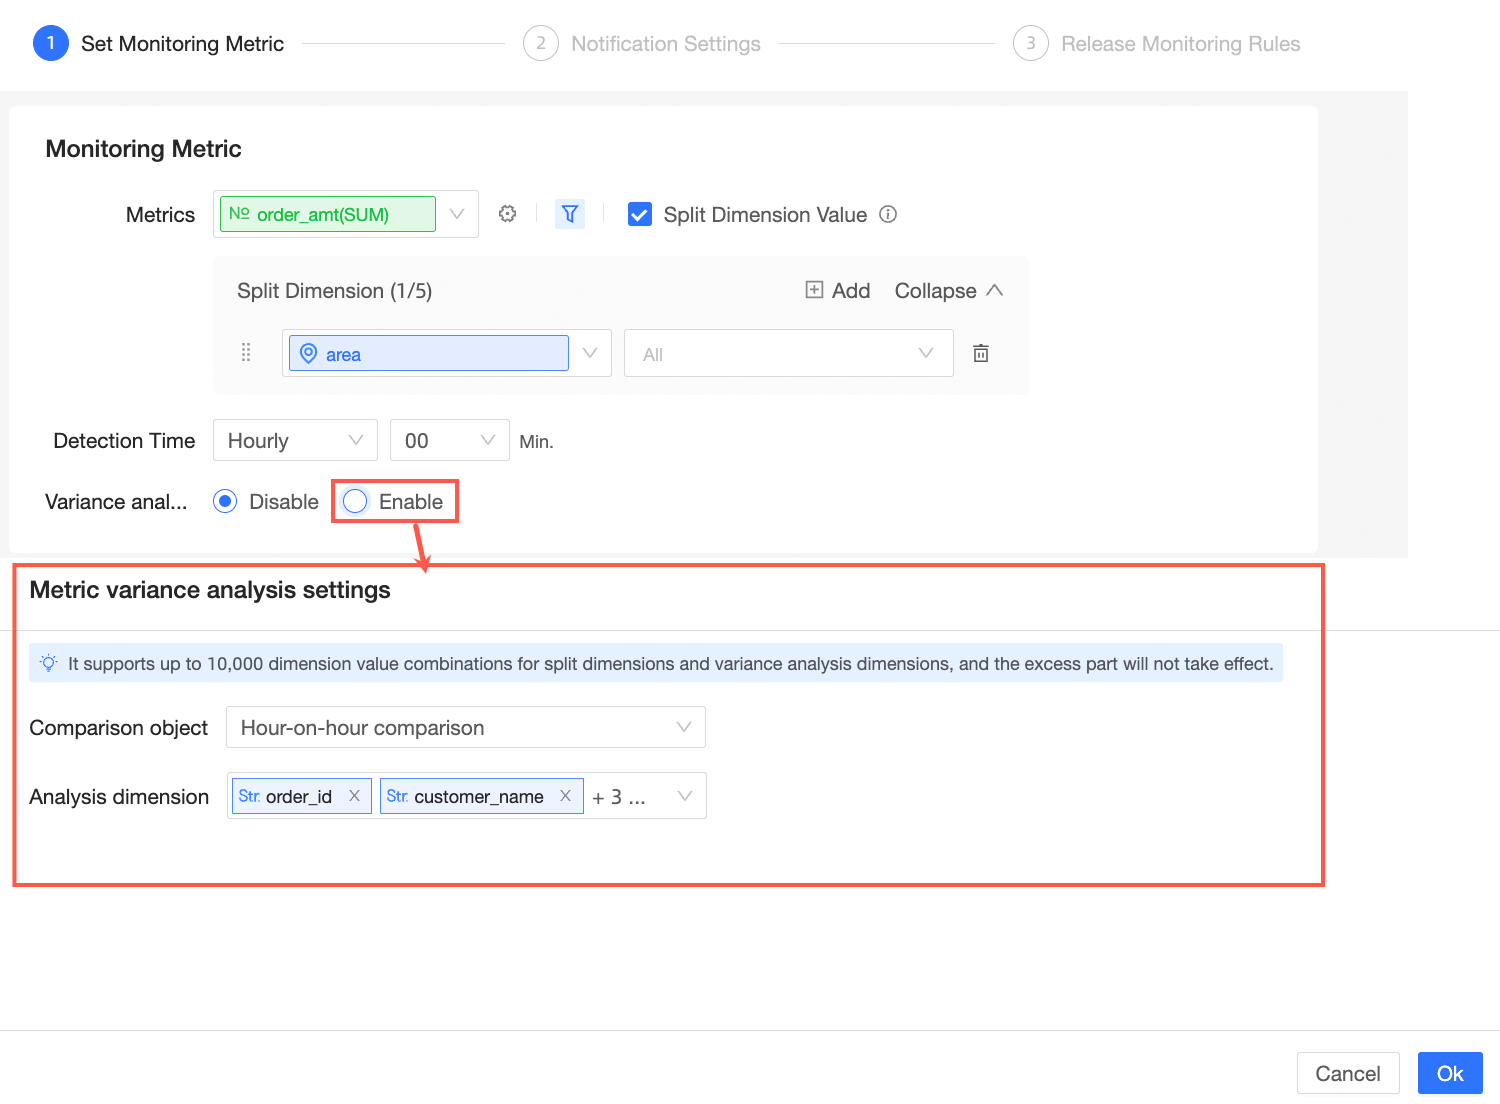
Fluctuation analysis can be configured. Fluctuation analysis can be used to interpret the fluctuations of abnormal metrics and help you quickly locate the causes of exceptions.
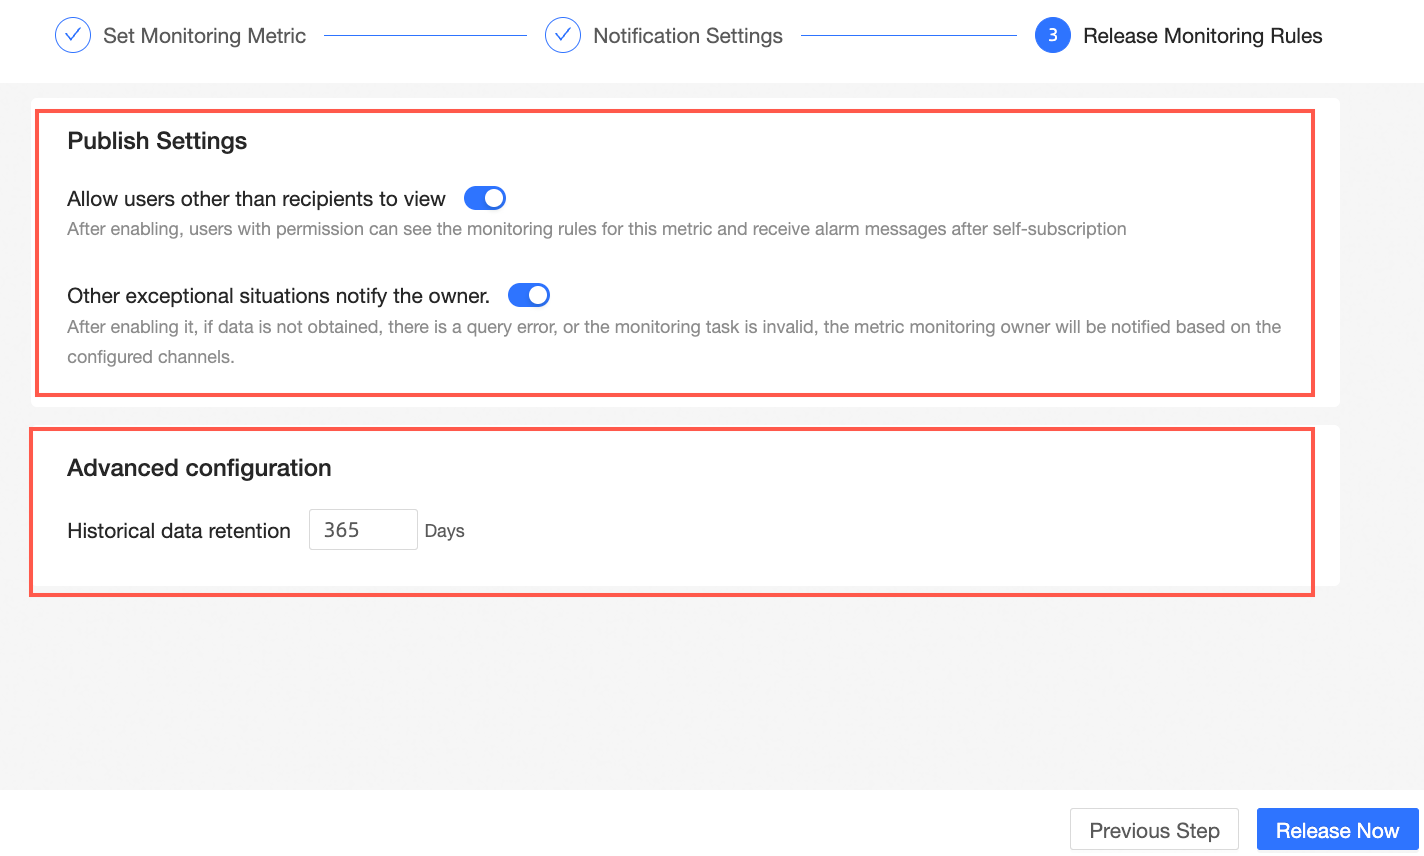
You can notify the owner of metric monitoring of exceptions such as no data and query errors.
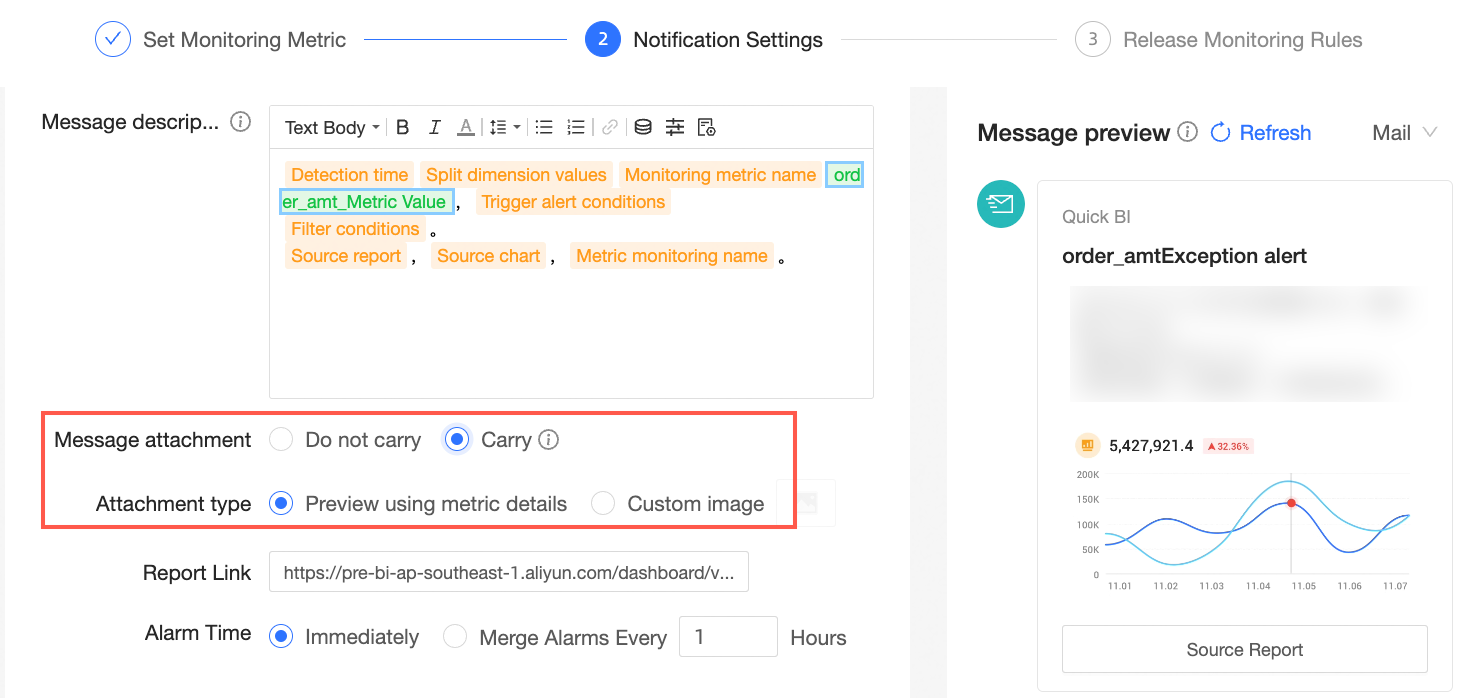
The alert information can include thumbnails of monitoring metrics to improve the readability of the alert information.
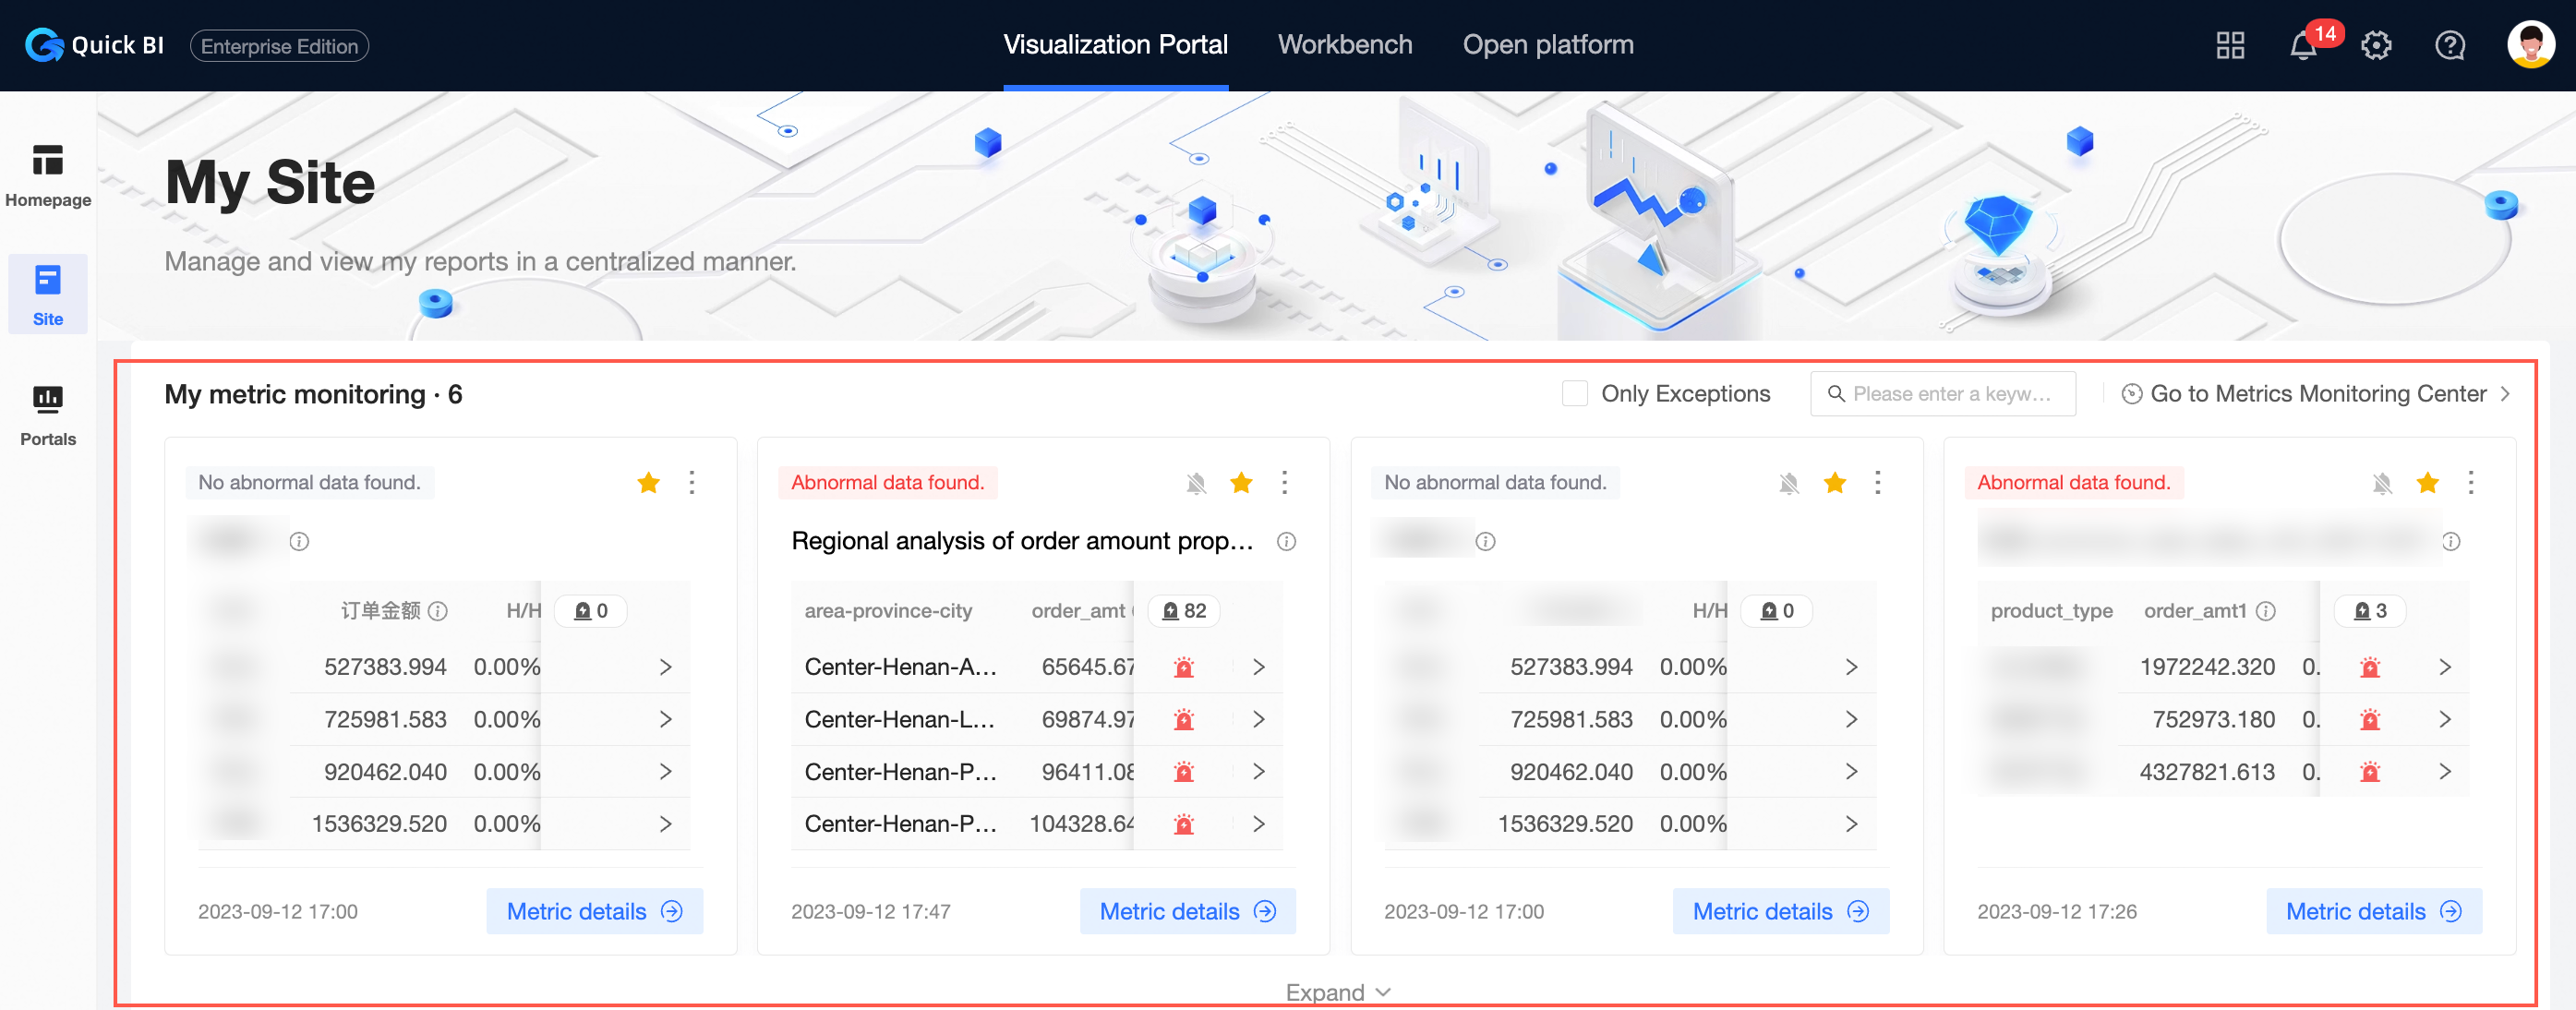
Metric monitoring is supported in My Data (only supported by Professional Edition).
You can customize alert content and preview alerts.
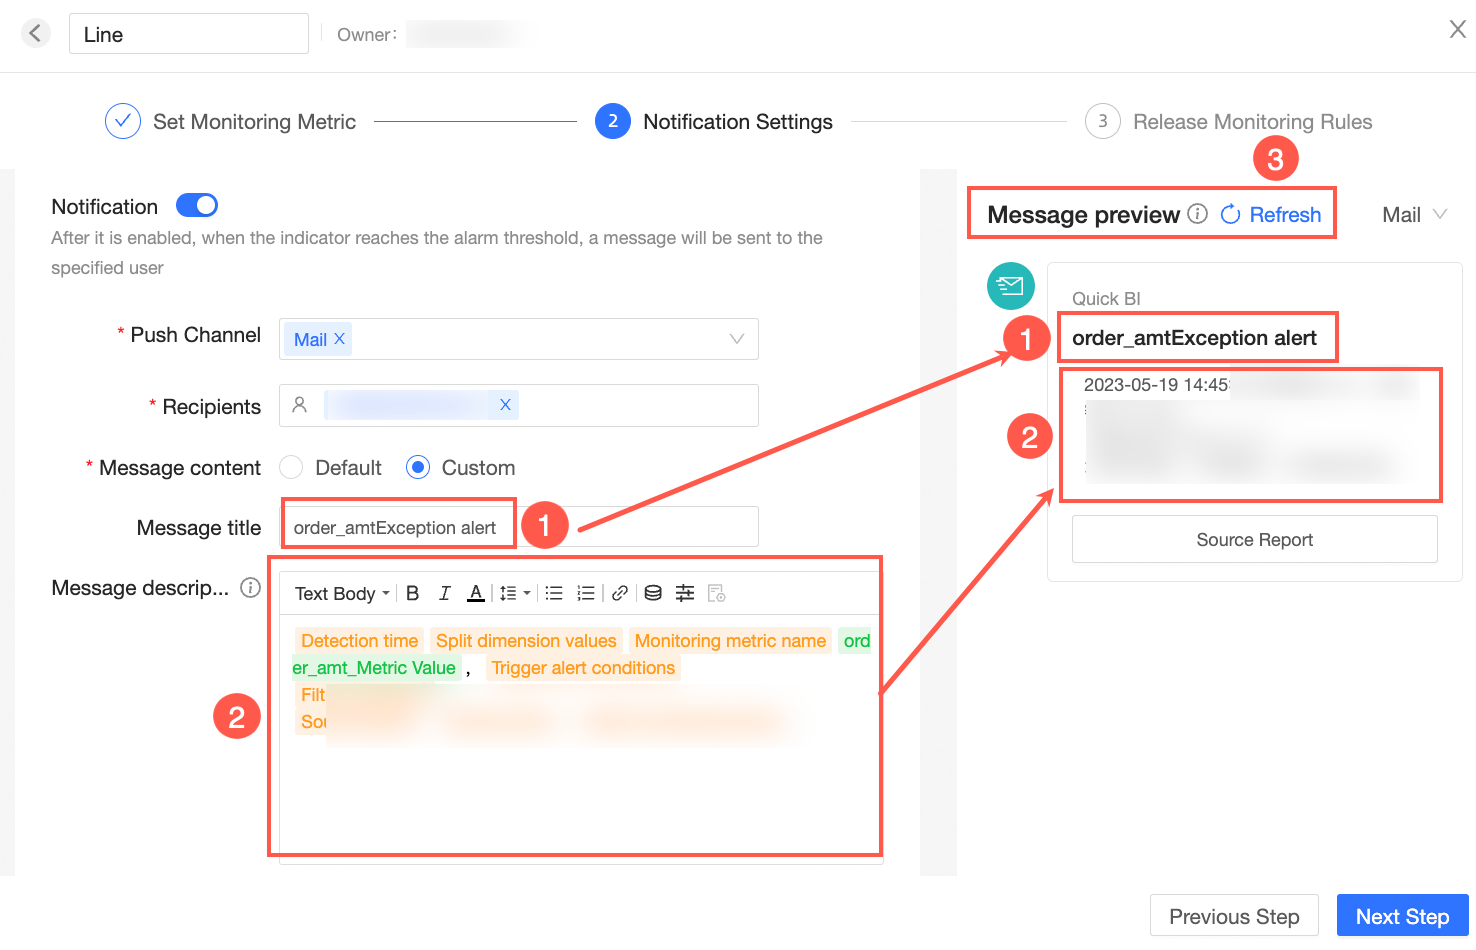
For more information, see Configure monitoring and alerting.
Downloads
You can set this parameter to take effect only once to avoid data breach risks.
For more information, see Report configuration.
Support public link sharing, users can view through the link.
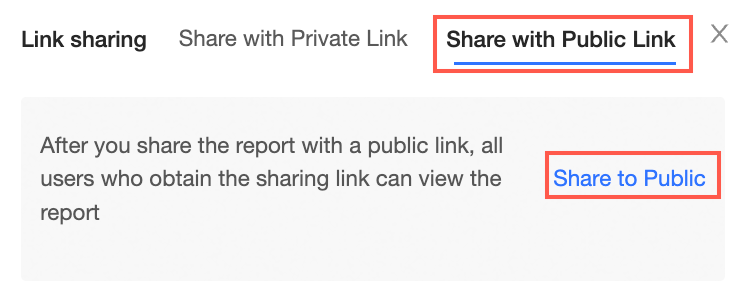 For more information, see Manage data retrieval.
BI portals
Supports switching between built-in tabs and full-screen operations.
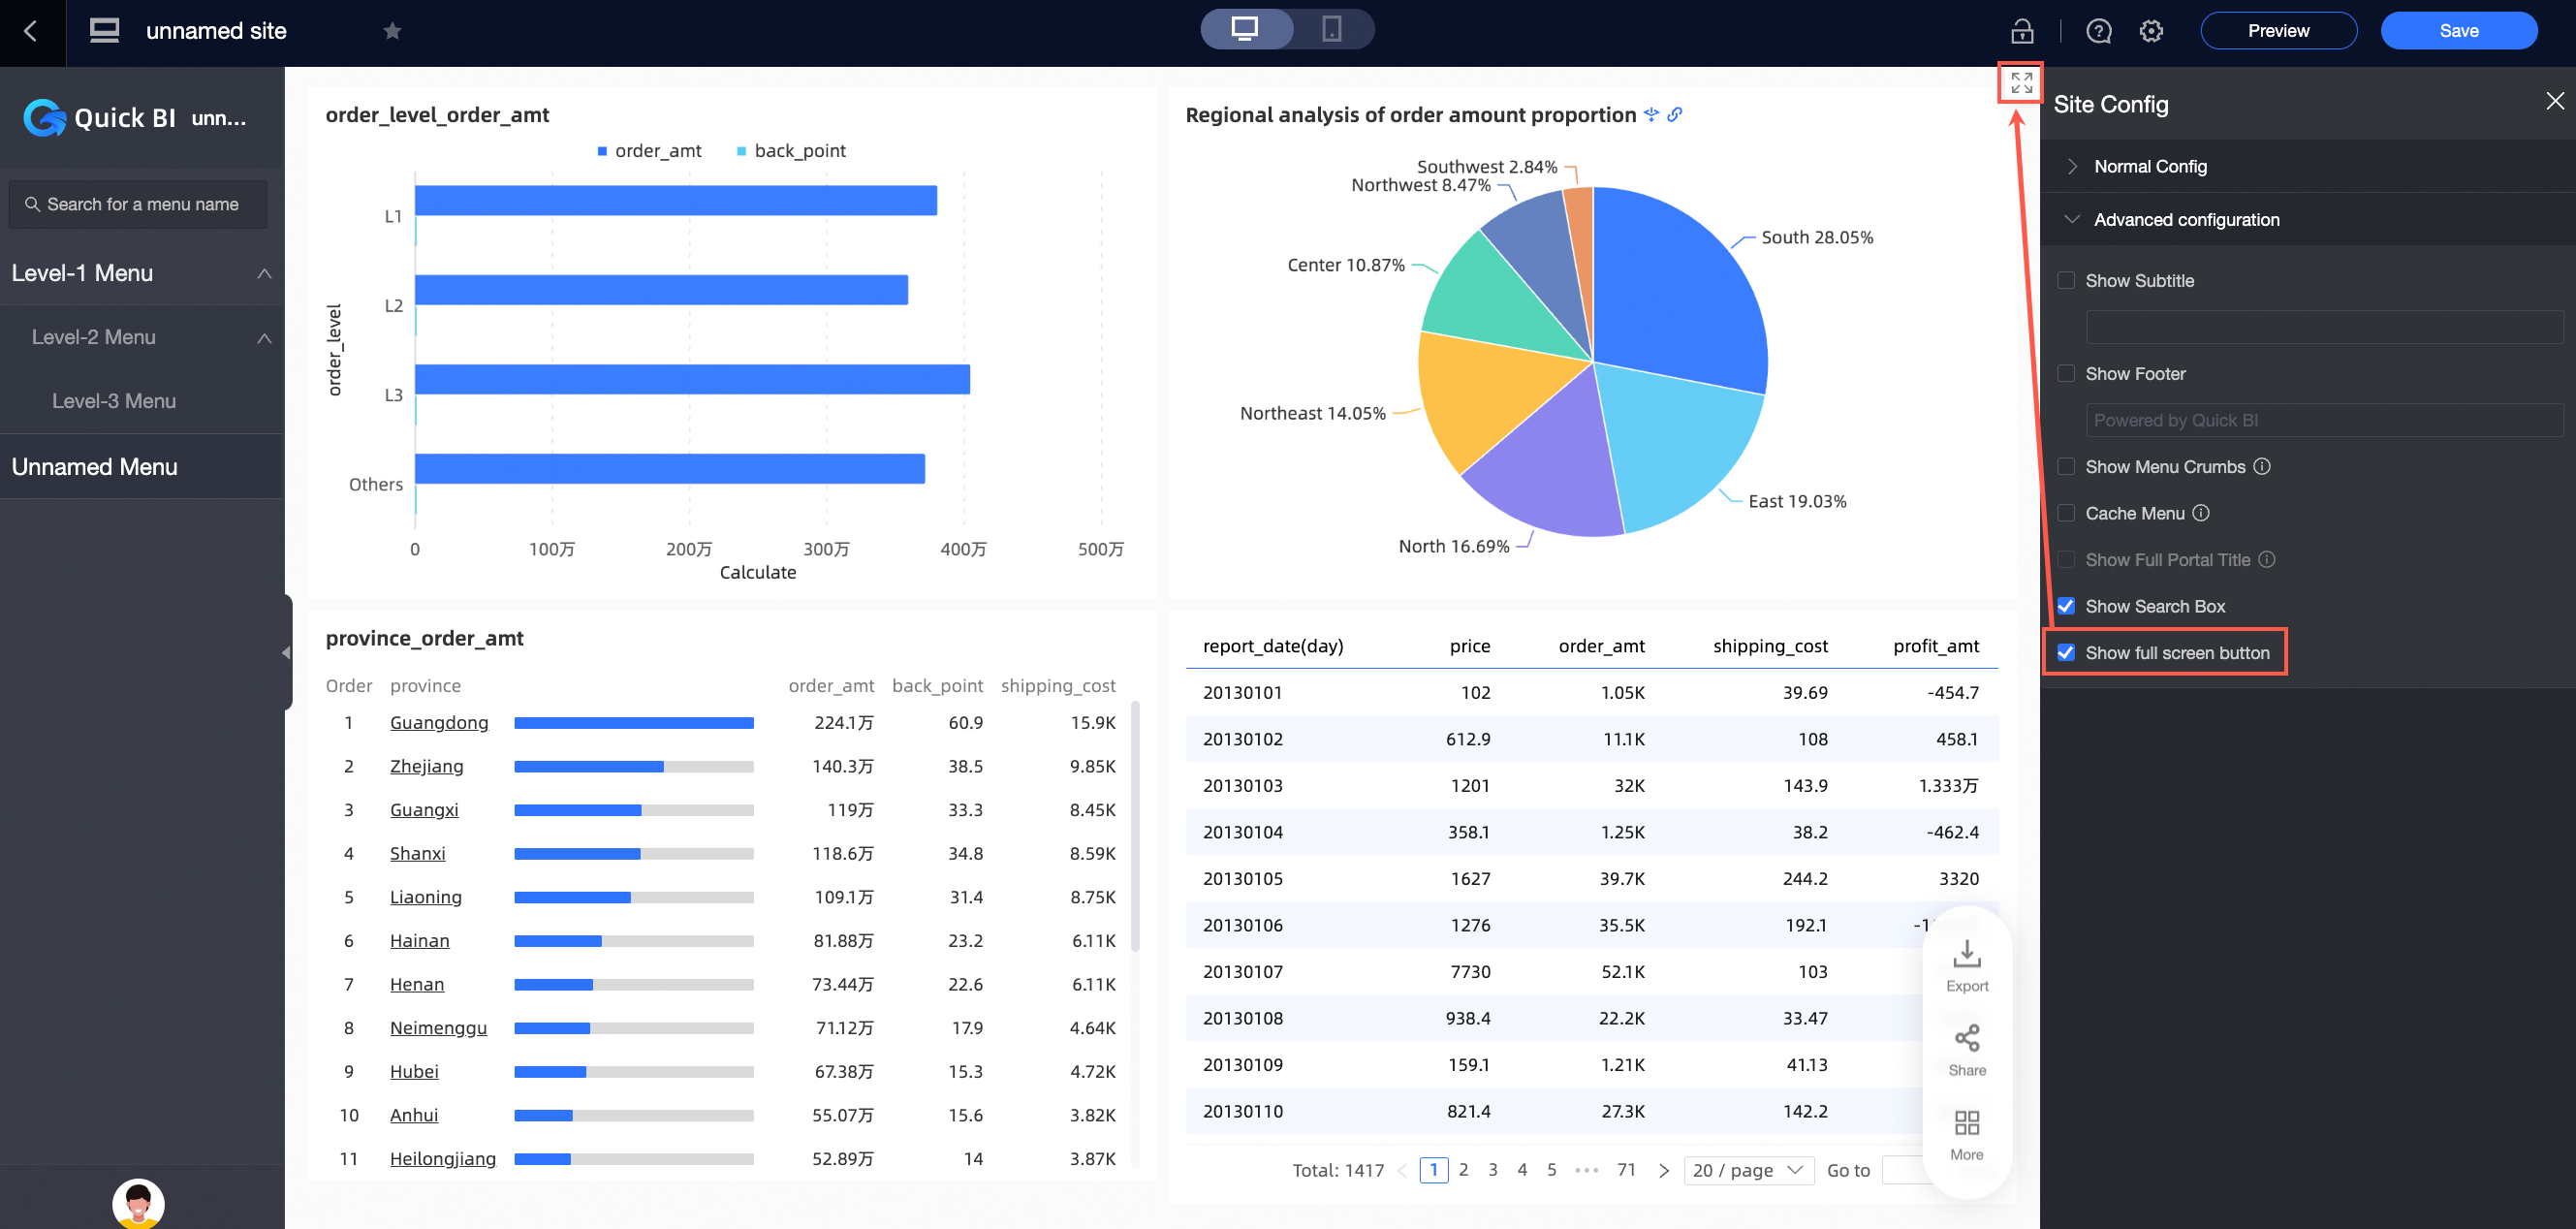
The number of menu nodes supported has been increased to five levels.
You can add a navigation bar to the top of a BI portal level -2 page.
The icon of the portal menu supports custom background color and custom upload.
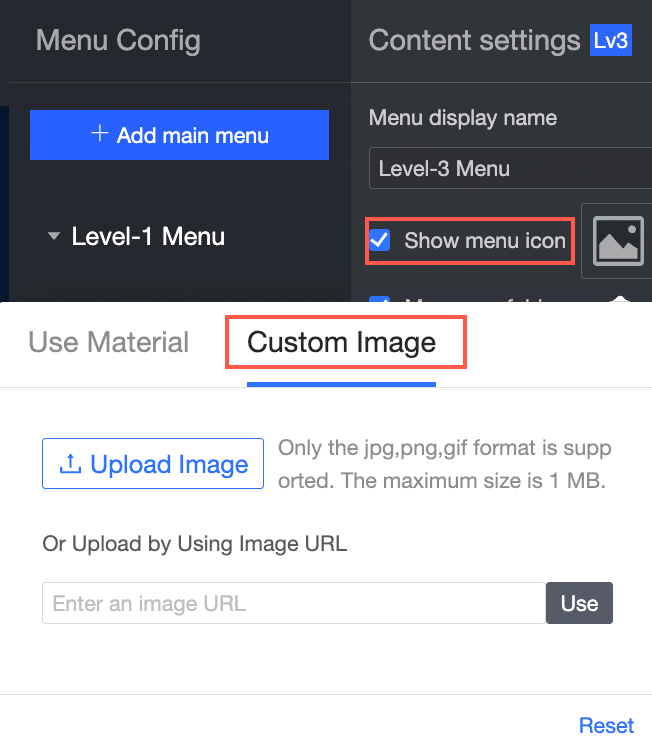
For more information, see Create a PC BI Portal.
Subscription
You can select specific charts to subscribe to and push Excel attachments.
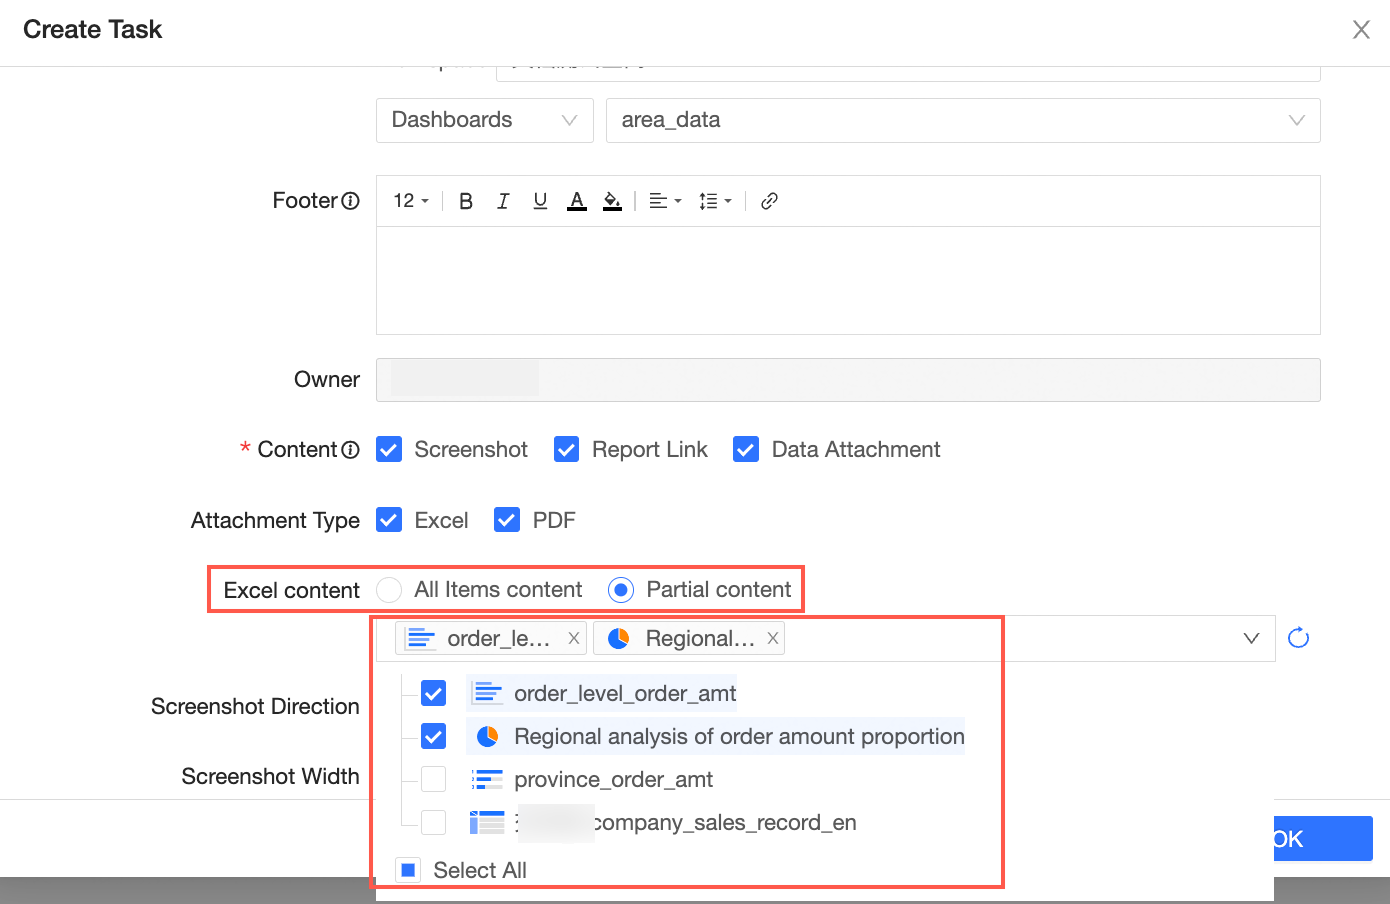
For more information, see Create a Subscription Task.
Organizations
Supports control over whether replication is allowed within an organization. Data security is enhanced.
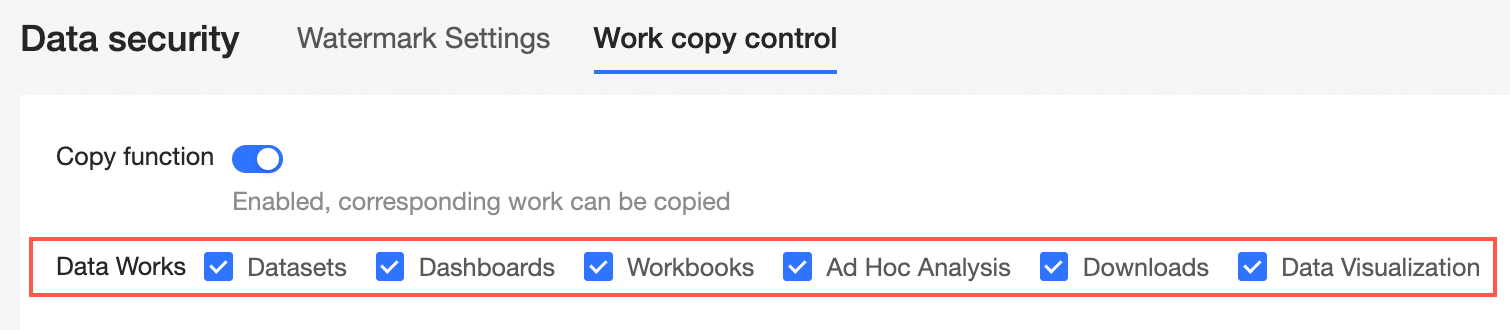
For more information, see Work Management.
The "unauthorized access" operation type record is added to the audit log.
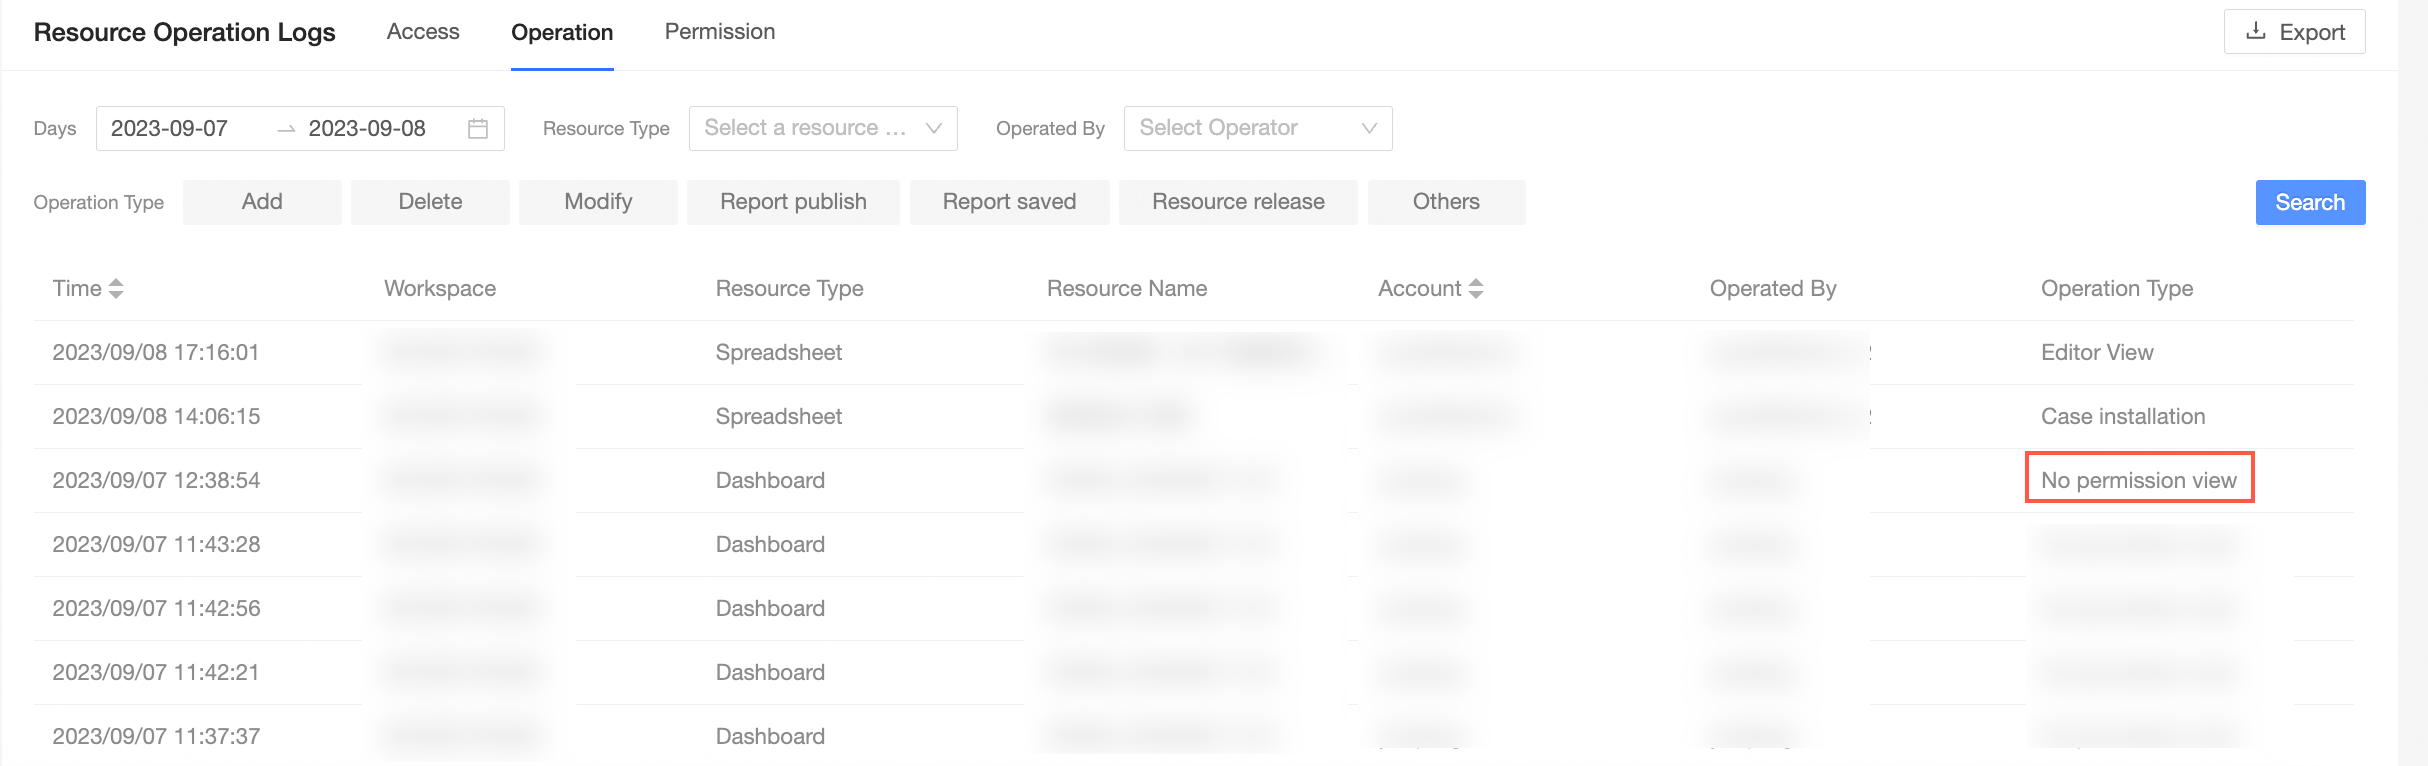
For more information, see Resource Analysis and User analysis.
Open integration
Custom widgets can be edited online.
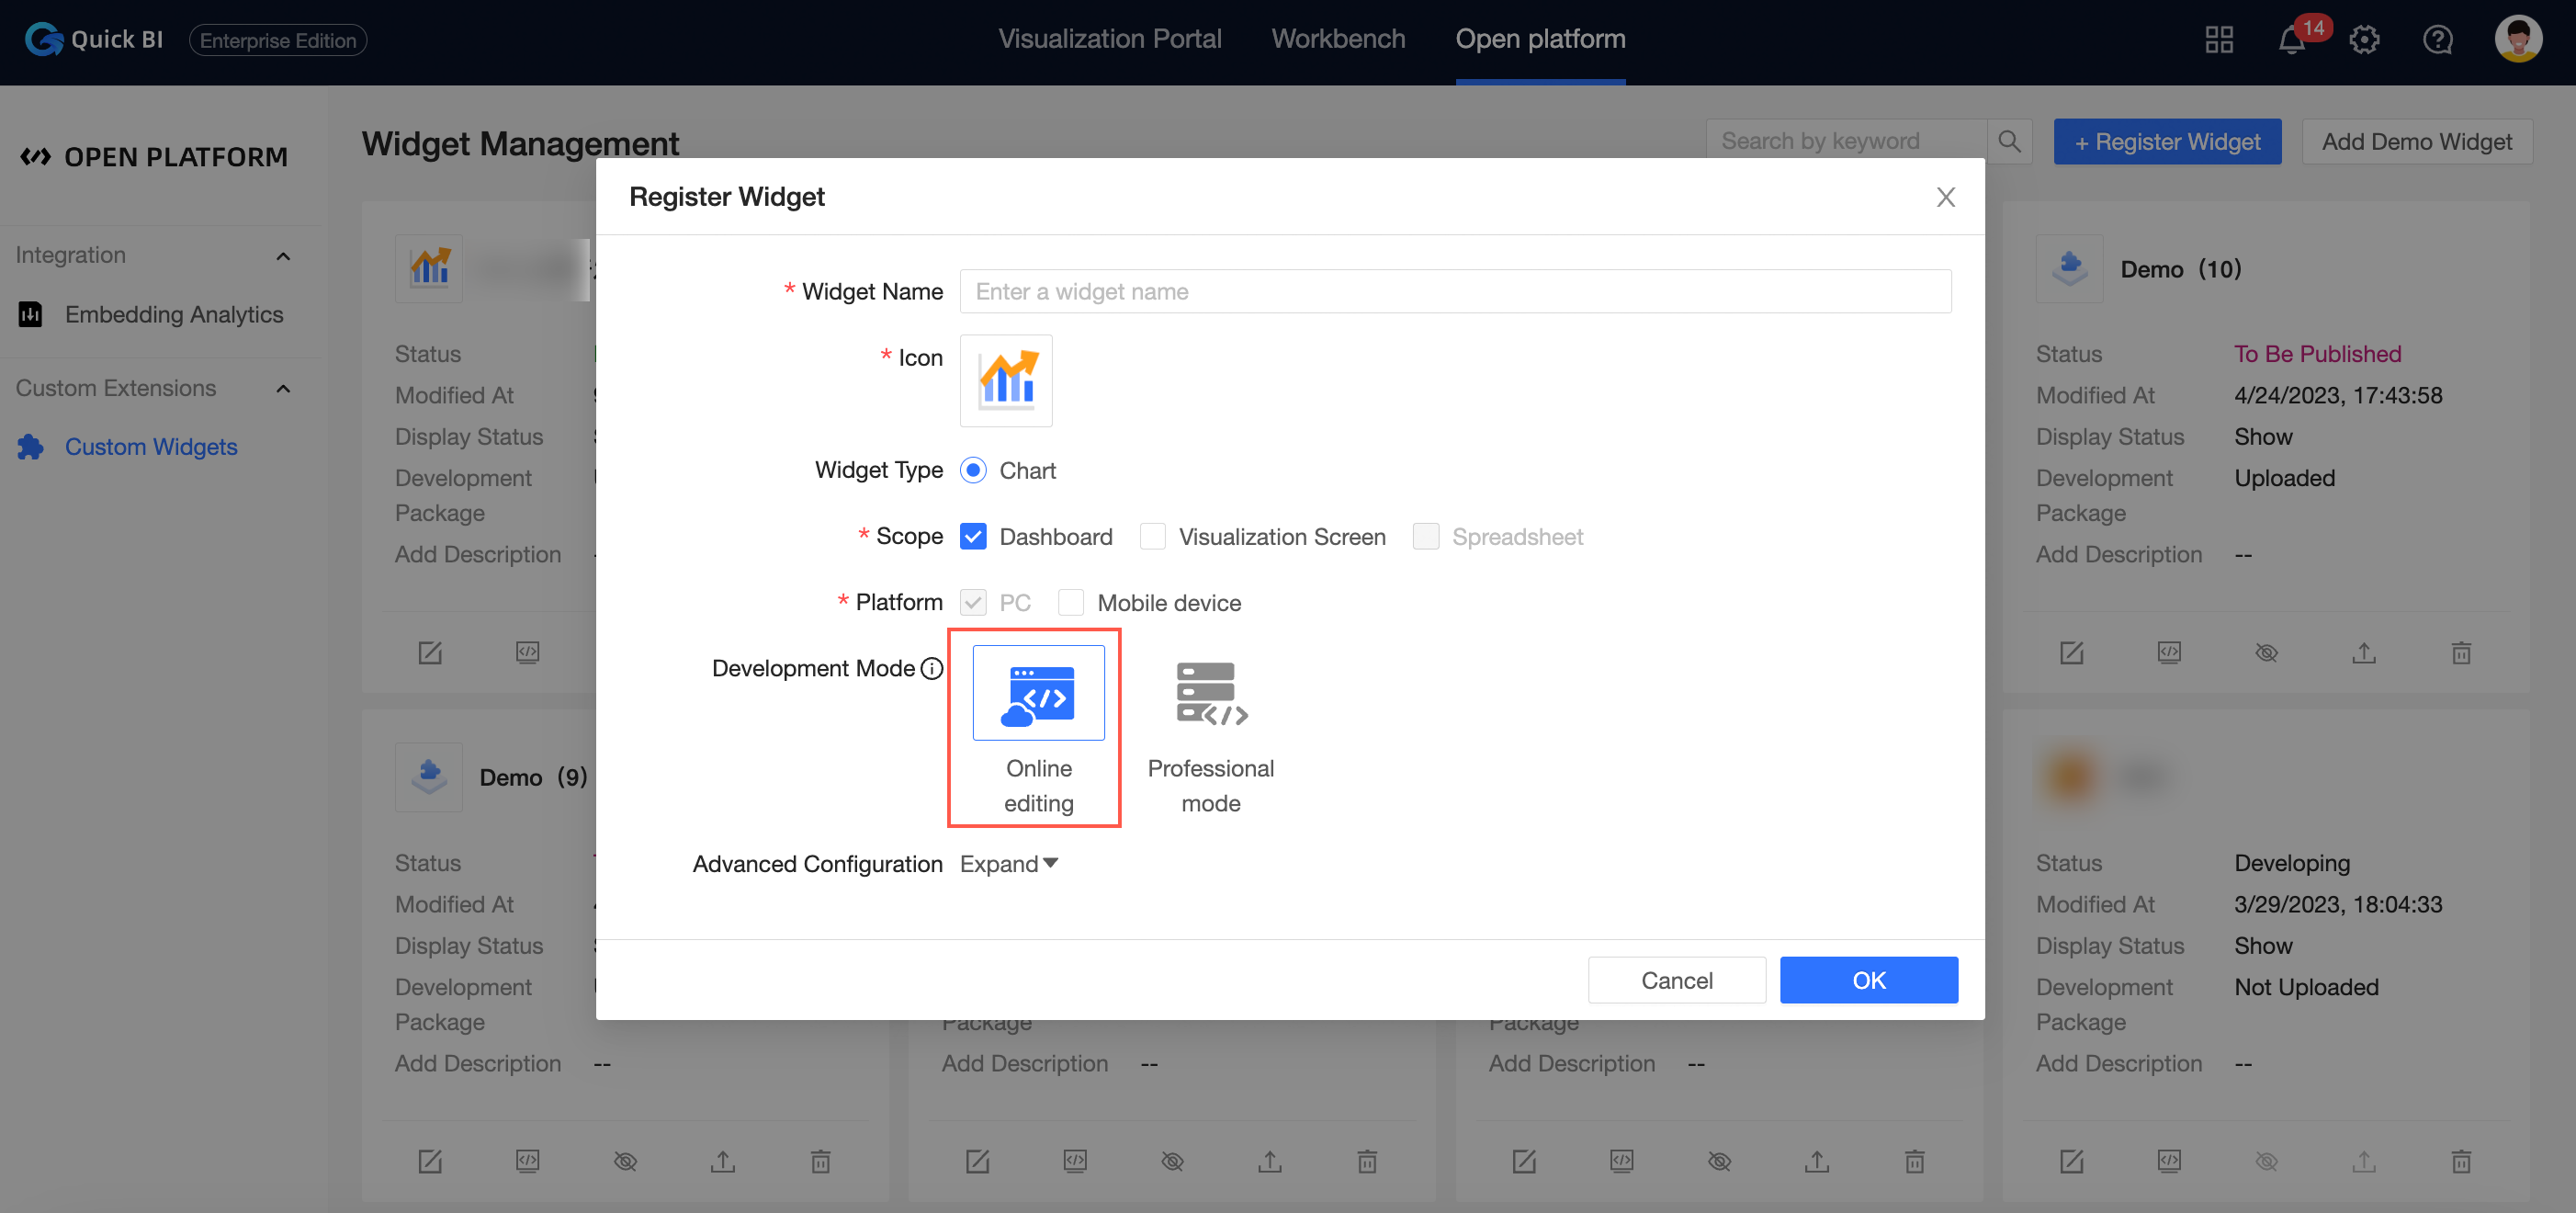
For more information, see Custom components.