You can add monitoring rules, configure alert rules, and push messages through the dashboard or workbook.
Prerequisites
A chart has been created in the dashboard. For more information, see line chart.
If you receive alerts through DingTalk Work Notifications or a DingTalk Group, make sure your account is attached to the DingTalk mini program. For more information, see (Public Cloud) Enable the DingTalk mini program.
If you receive alerts through Feishu Notifications or a Feishu Group, make sure that your account is linked to the Lark mini program. For more information, see (Public Cloud) Enable the Lark mini program.
If you receive alerts through Lark Notifications or a Lark Group, make sure to attach your account to the Lark mini program. For more information, see (Public Cloud) Enable the Lark mini program.
Limits
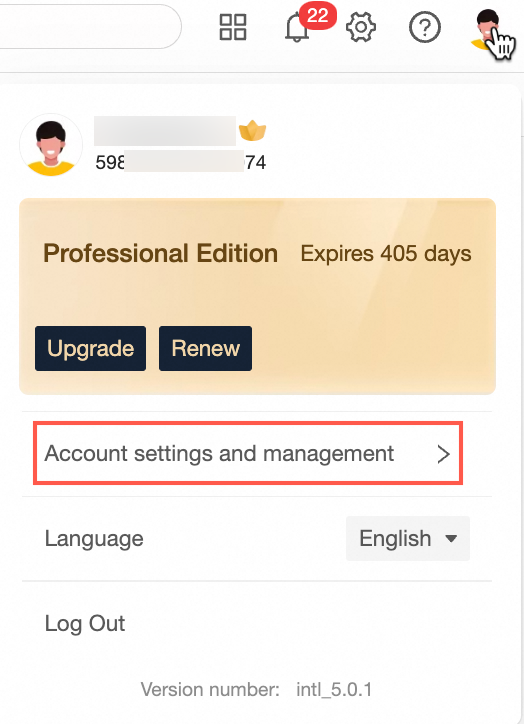
Only the Professional Edition supports the configuration of monitoring alerts.
Configure Monitoring
Operation Entry
Dashboard Monitoring Alert Operation Entry.
You can access the dashboard configuration indicator monitoring configuration page in any of the following ways:
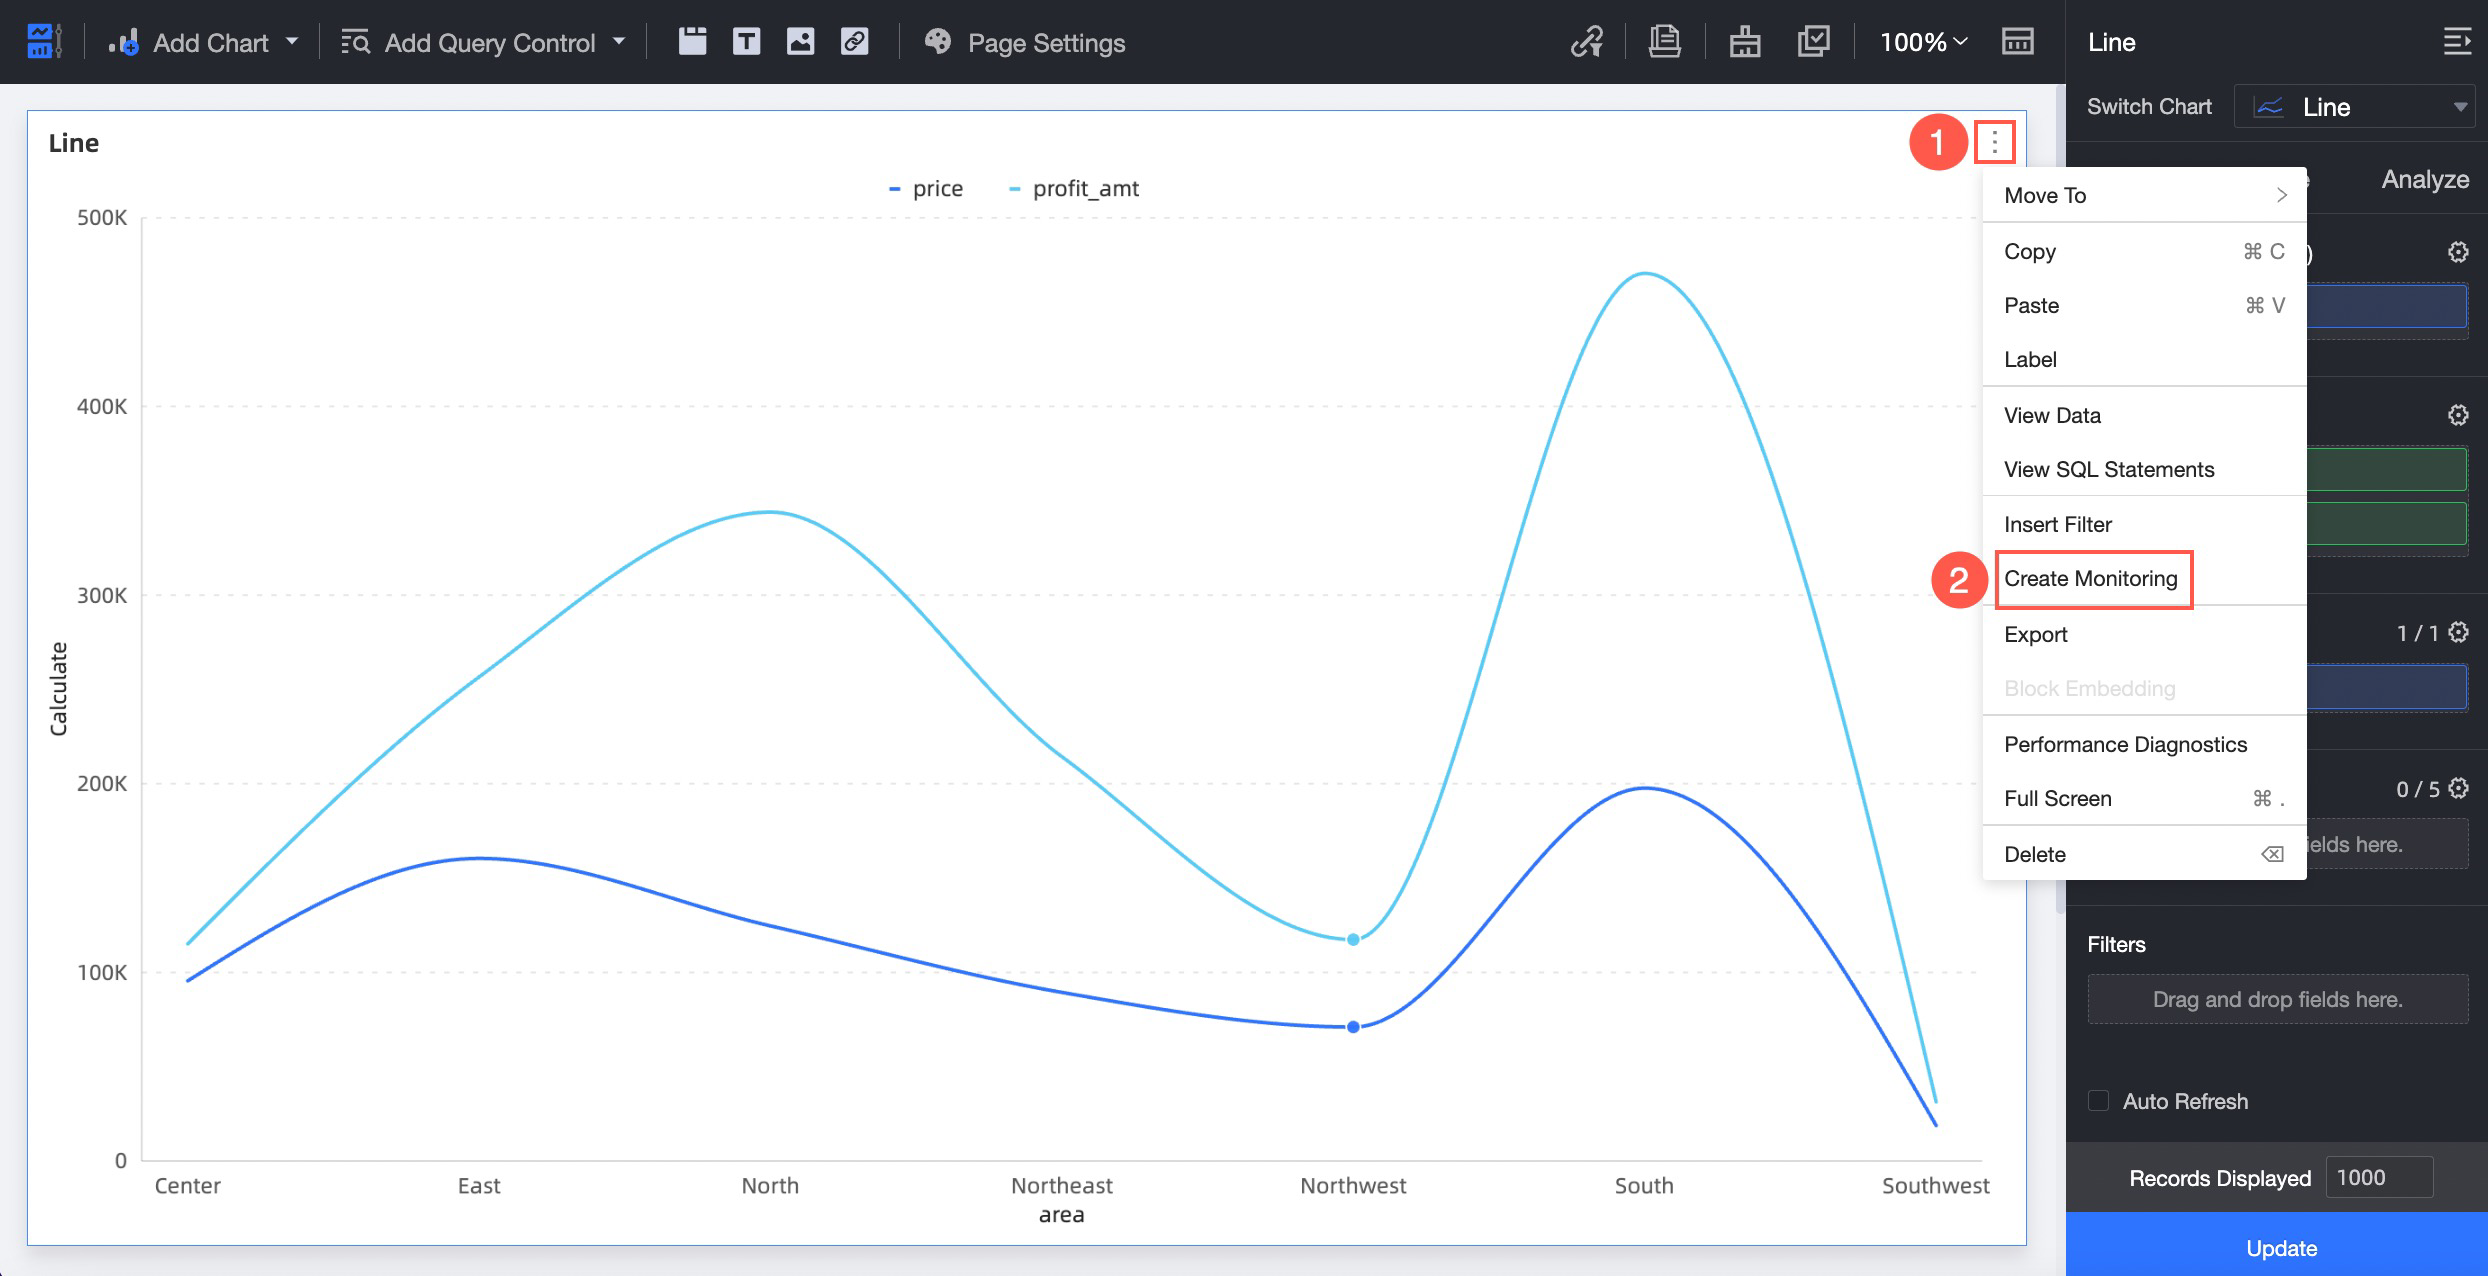
Through the dashboard edit page:
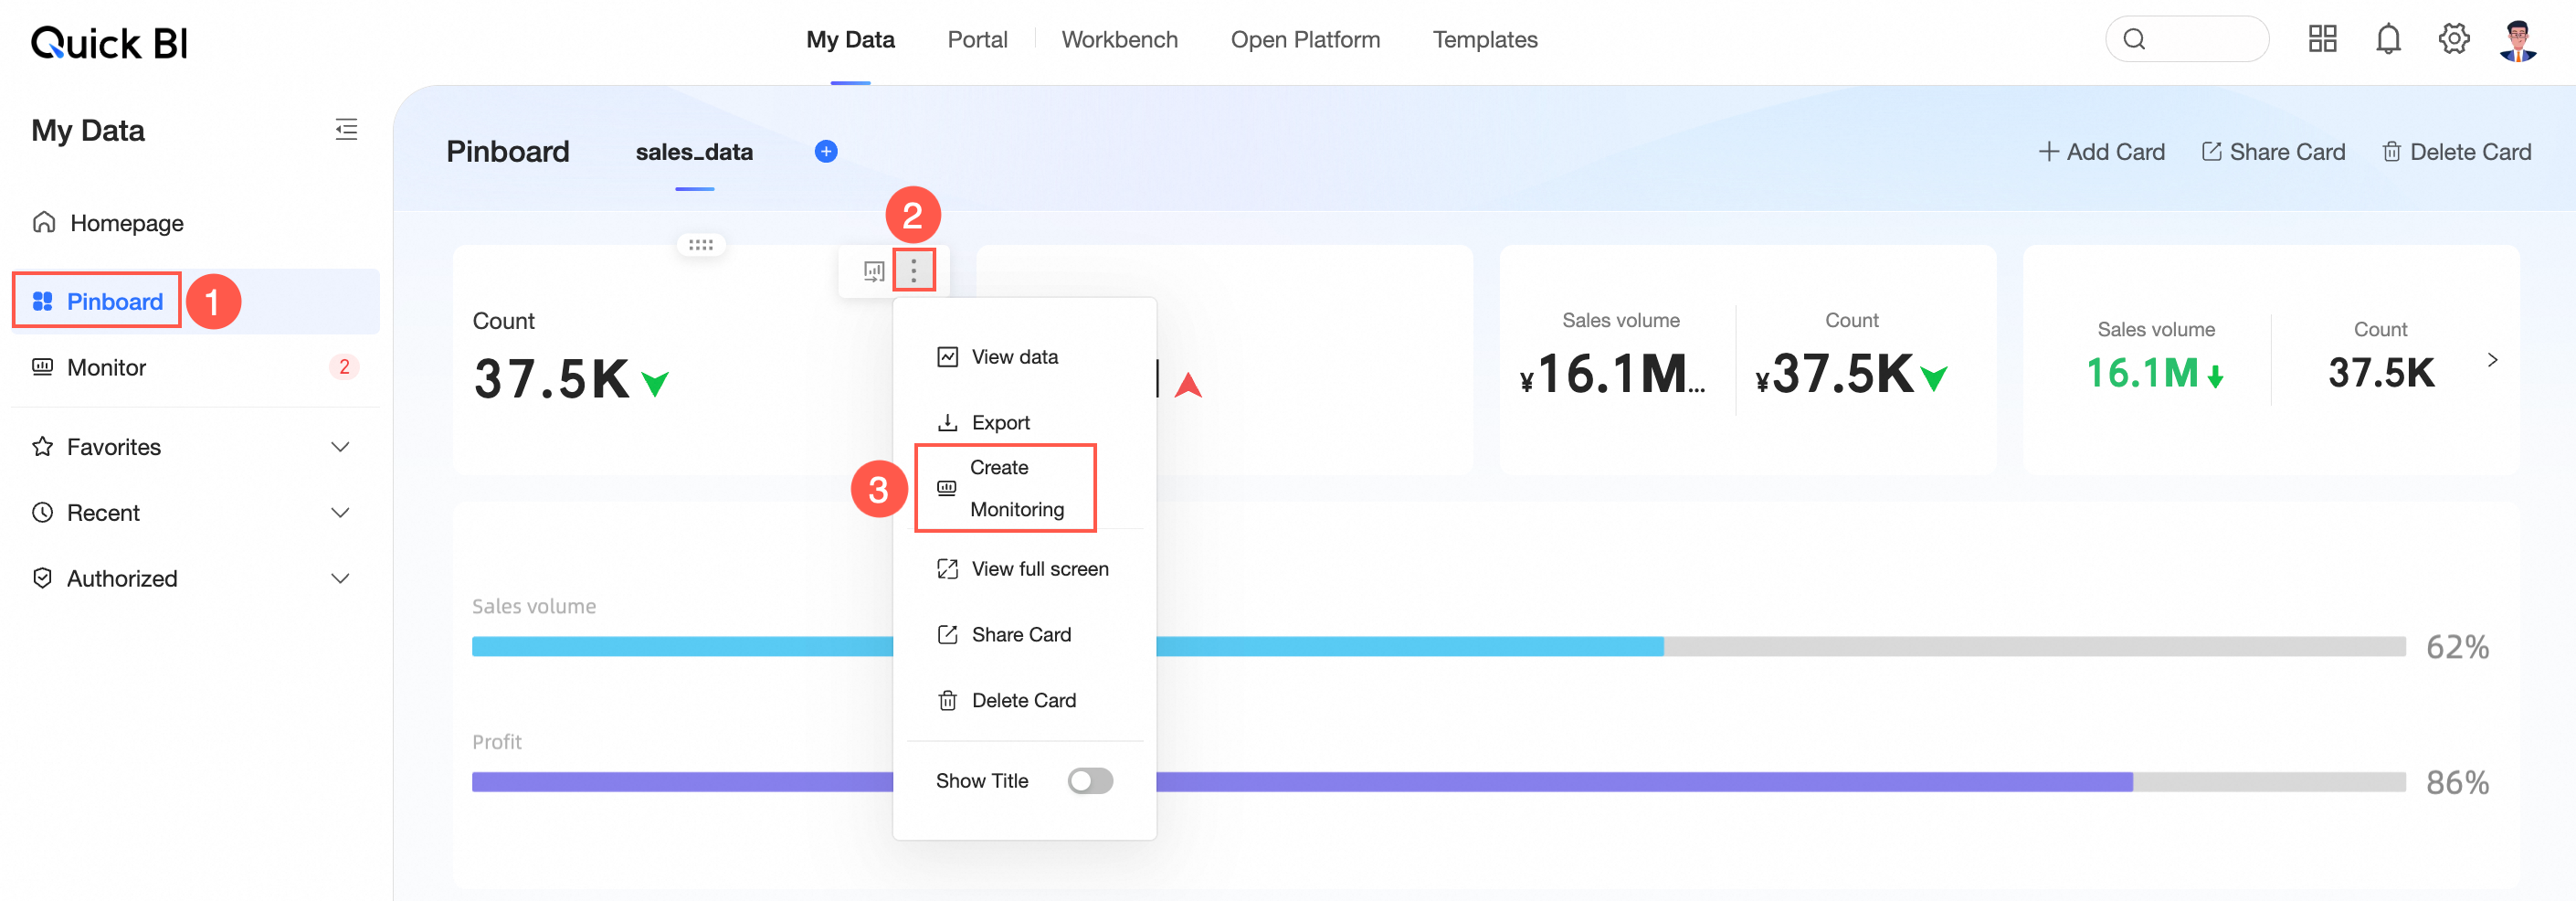
Through the dashboard post-publish preview page:
Directly create monitoring
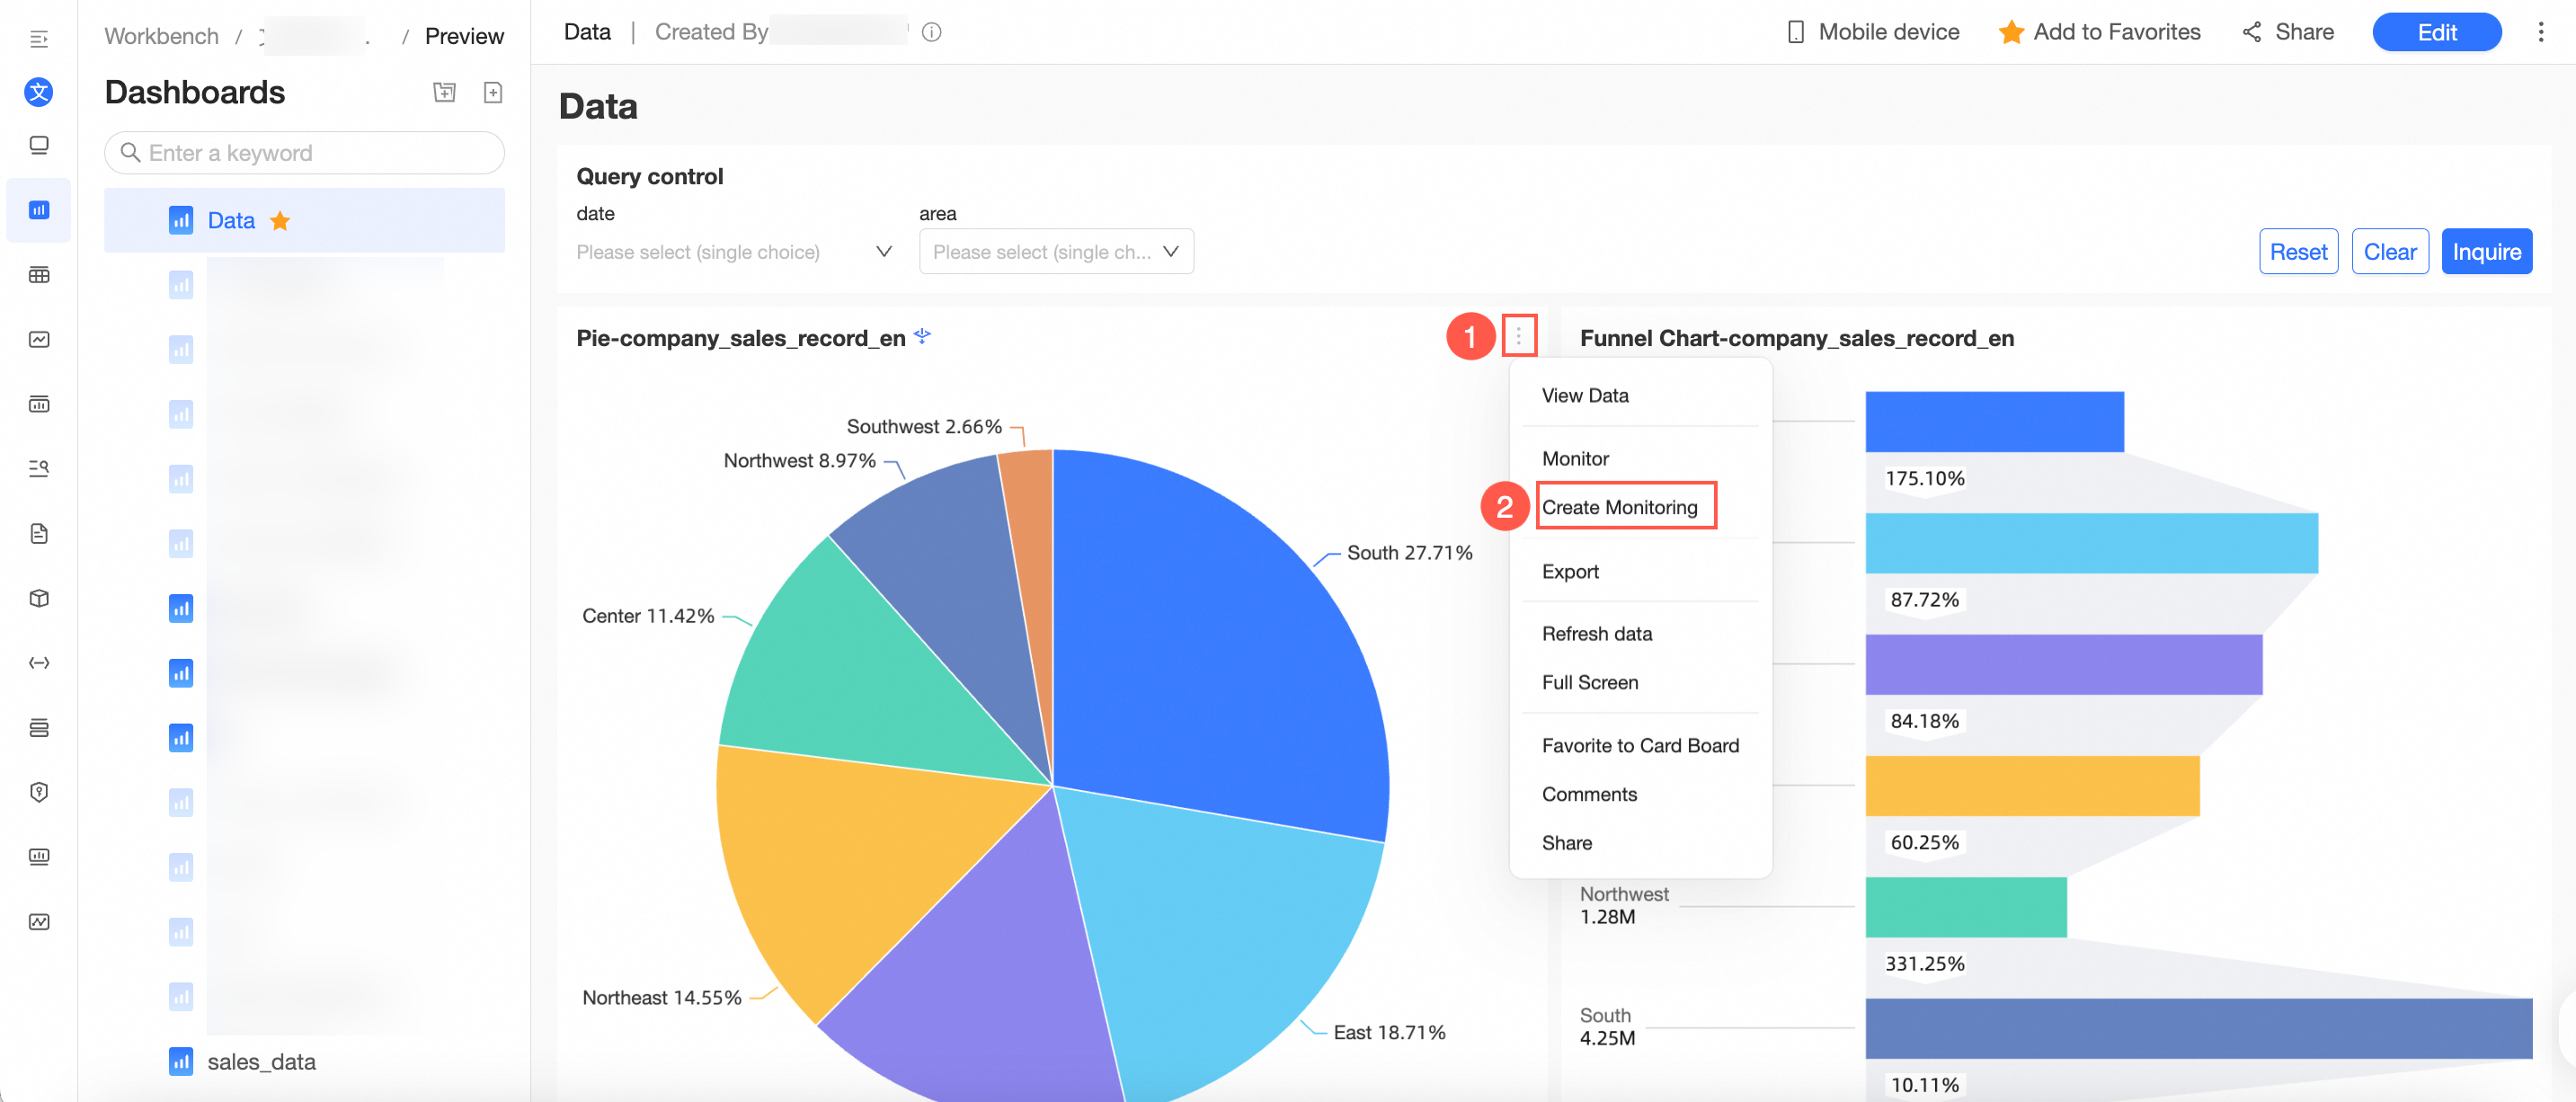
Chart -> indicator monitoring page -> create monitoring
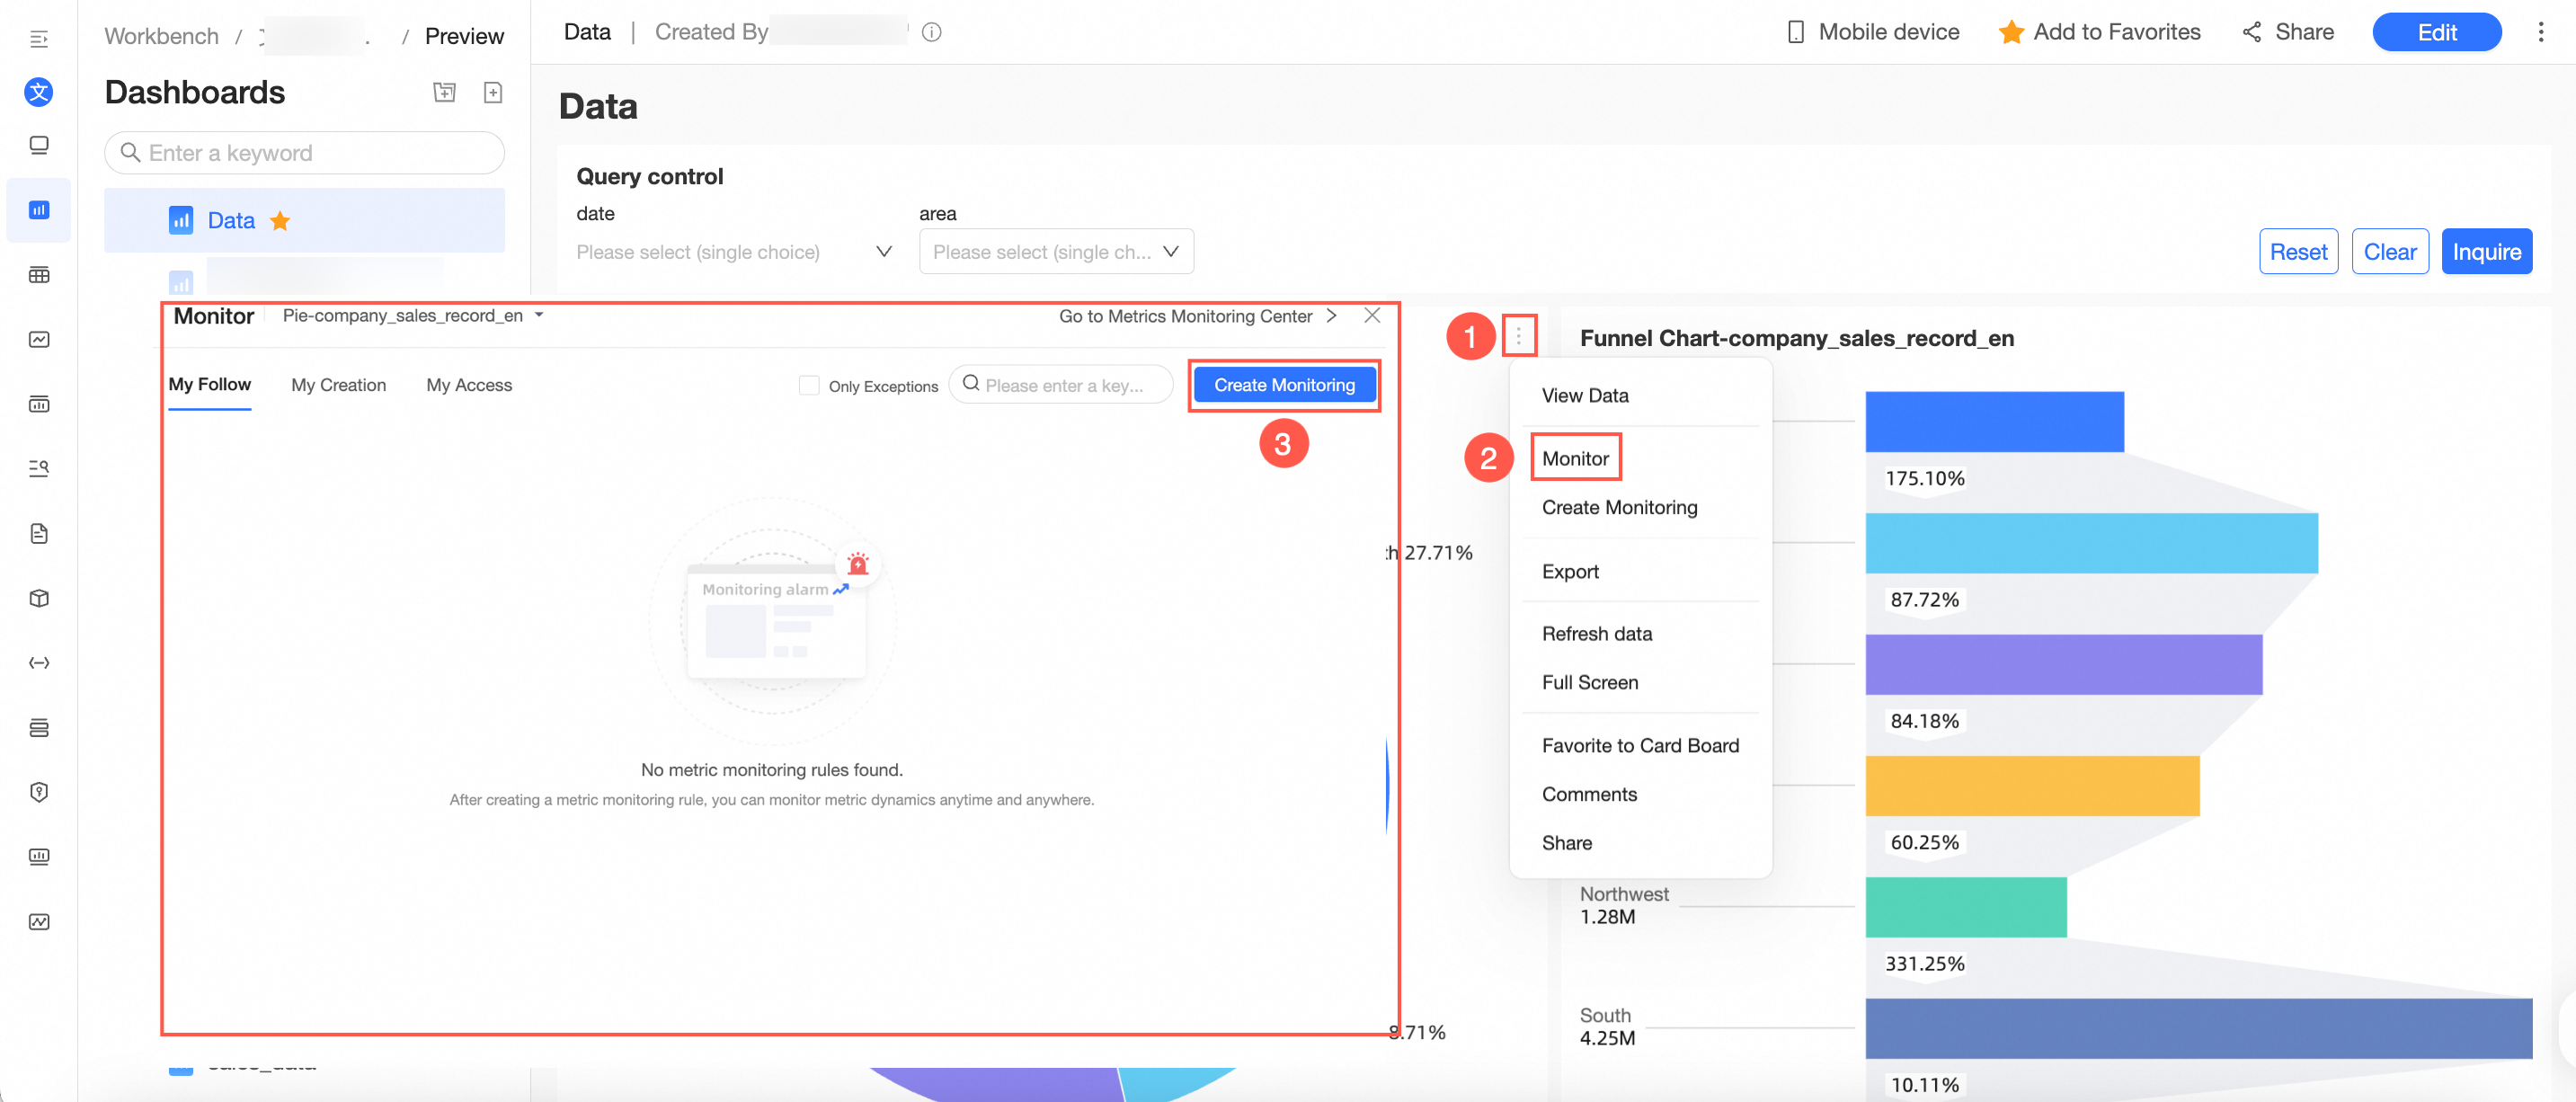
Indicator monitoring -> select corresponding chart -> create monitoring
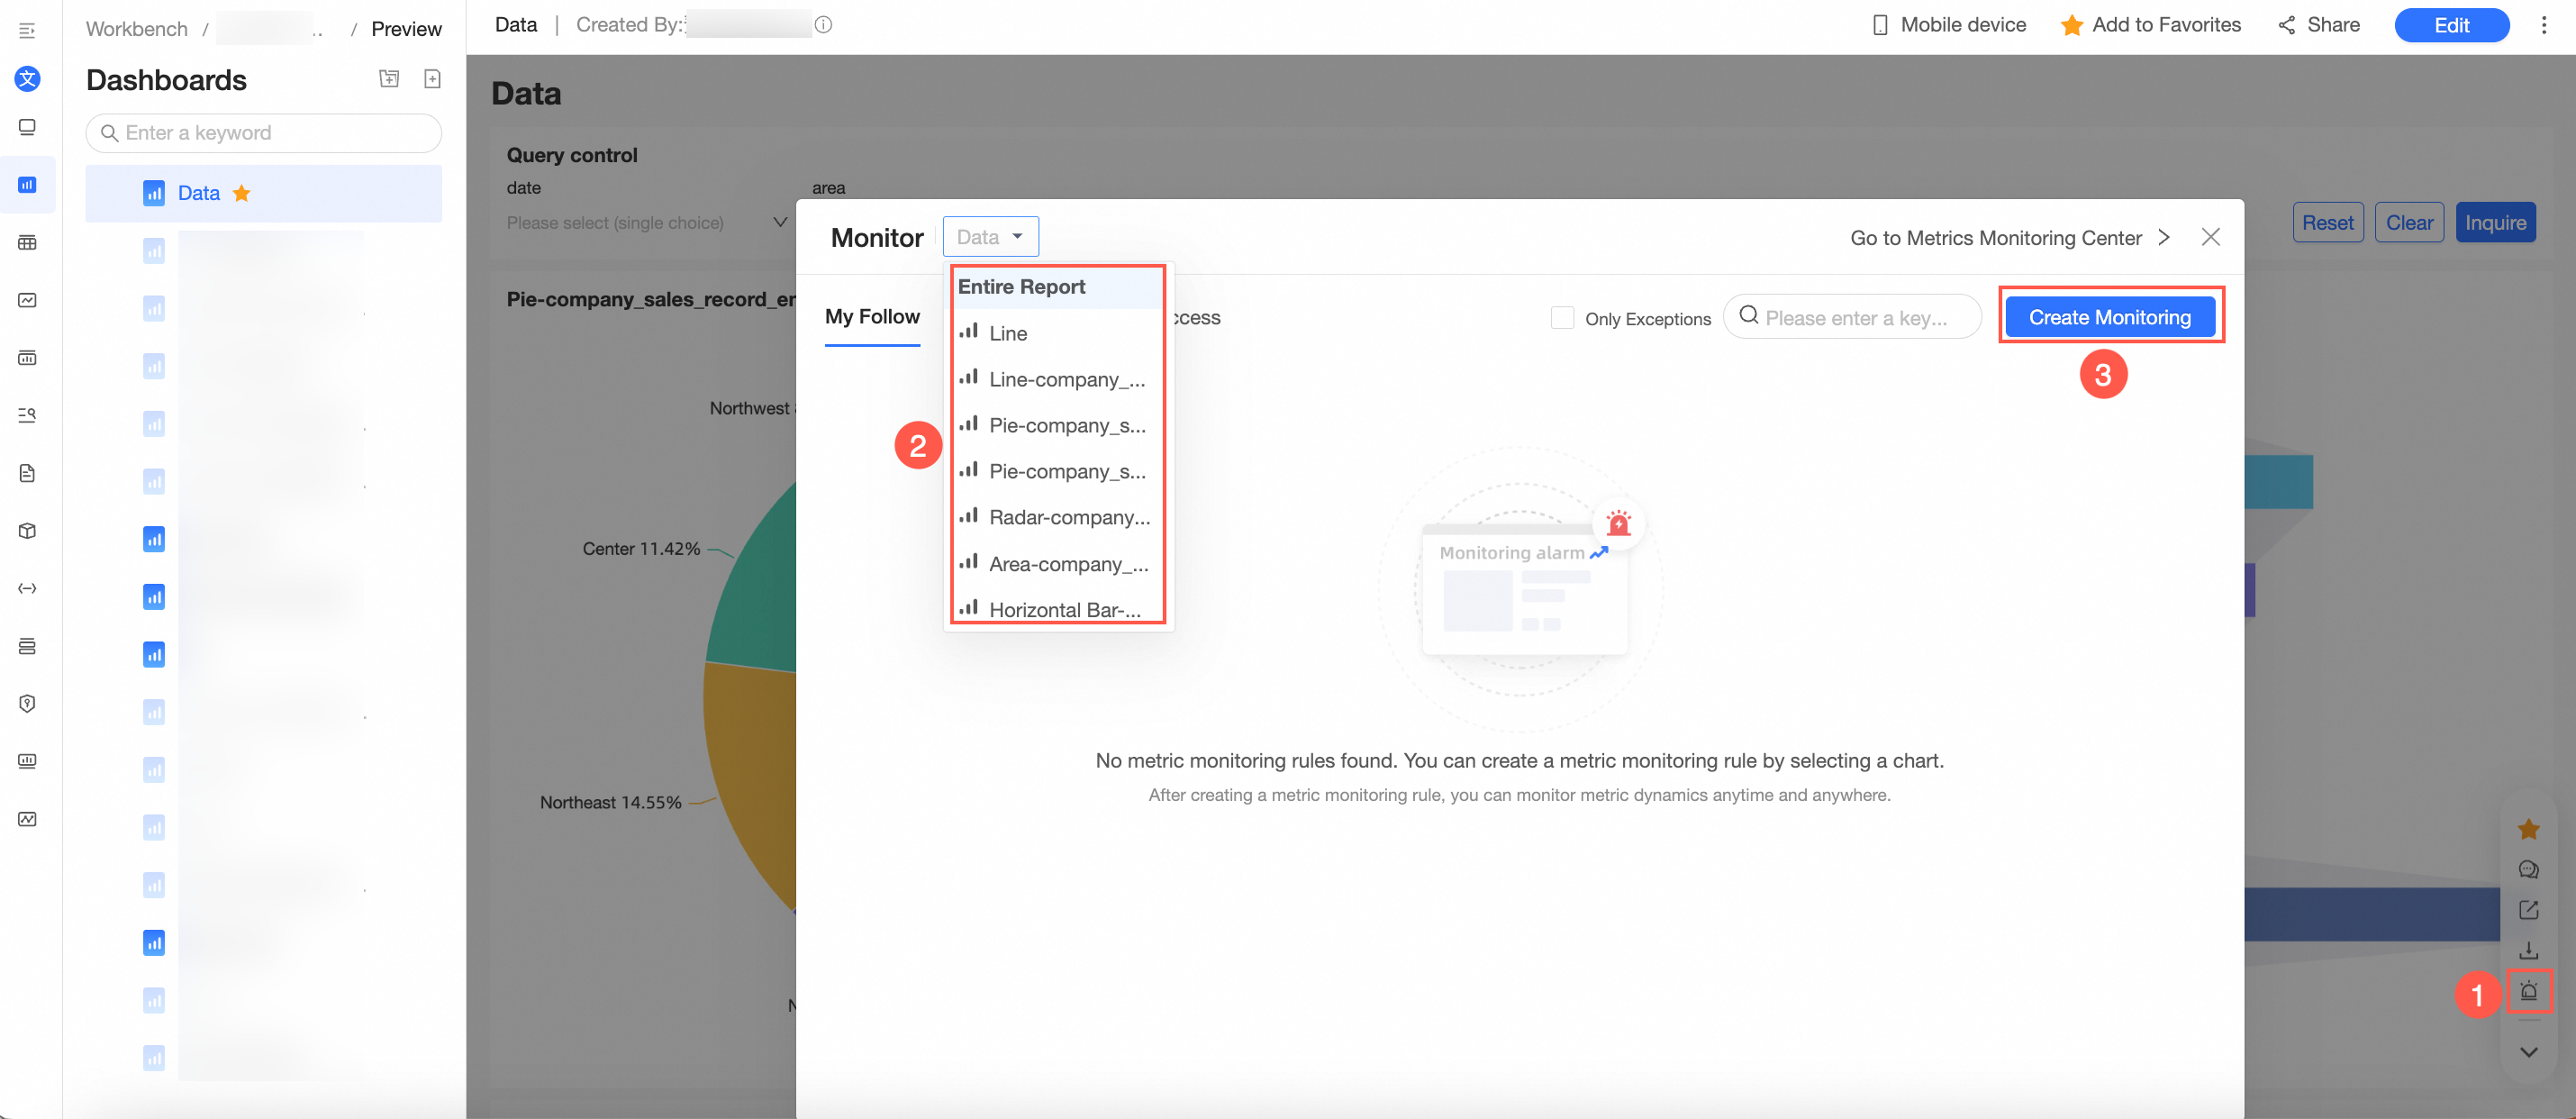
Indicator monitoring -> create monitoring -> select corresponding chart -> click confirm

Card board -> create monitoring.
Workbook Monitoring Alert Operation Entry.
You can access the workbook configuration indicator monitoring configuration page in the following ways:
Click
 icon to enter the preview interface or click
  icon to enter the new window view workbook preview interface.
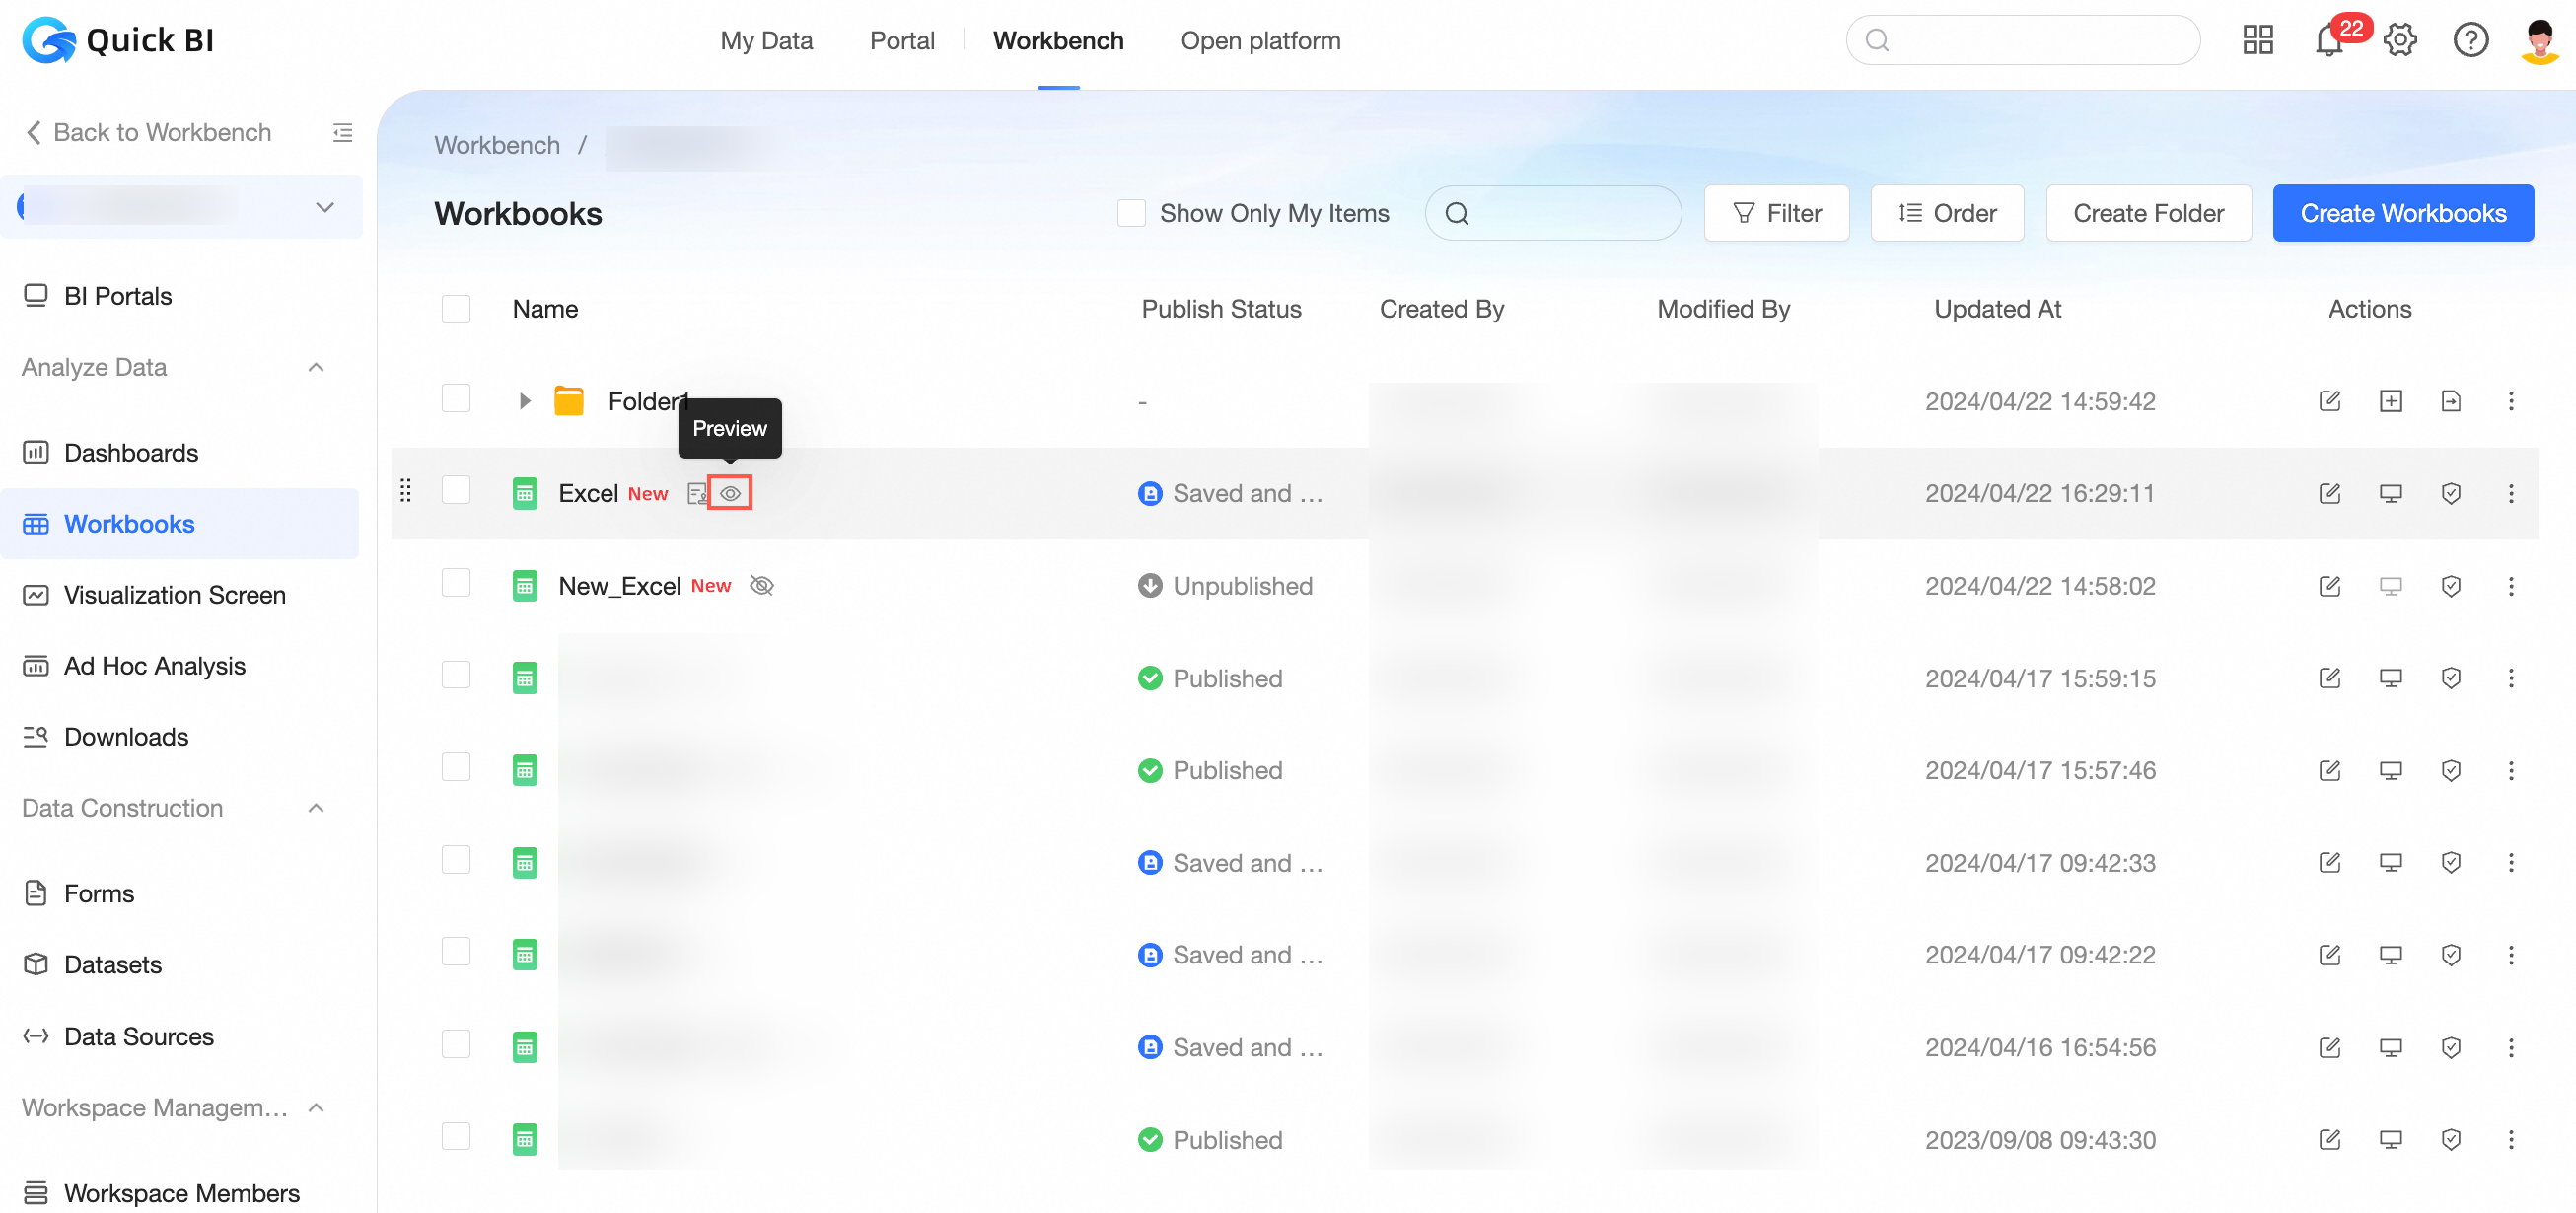
In the workbook preview interface, click indicator monitoring -> create monitoring.

Monitoring indicator Settings
On the Indicator Monitoring Configuration page, configure monitoring indicators, alert rules, and push messages.
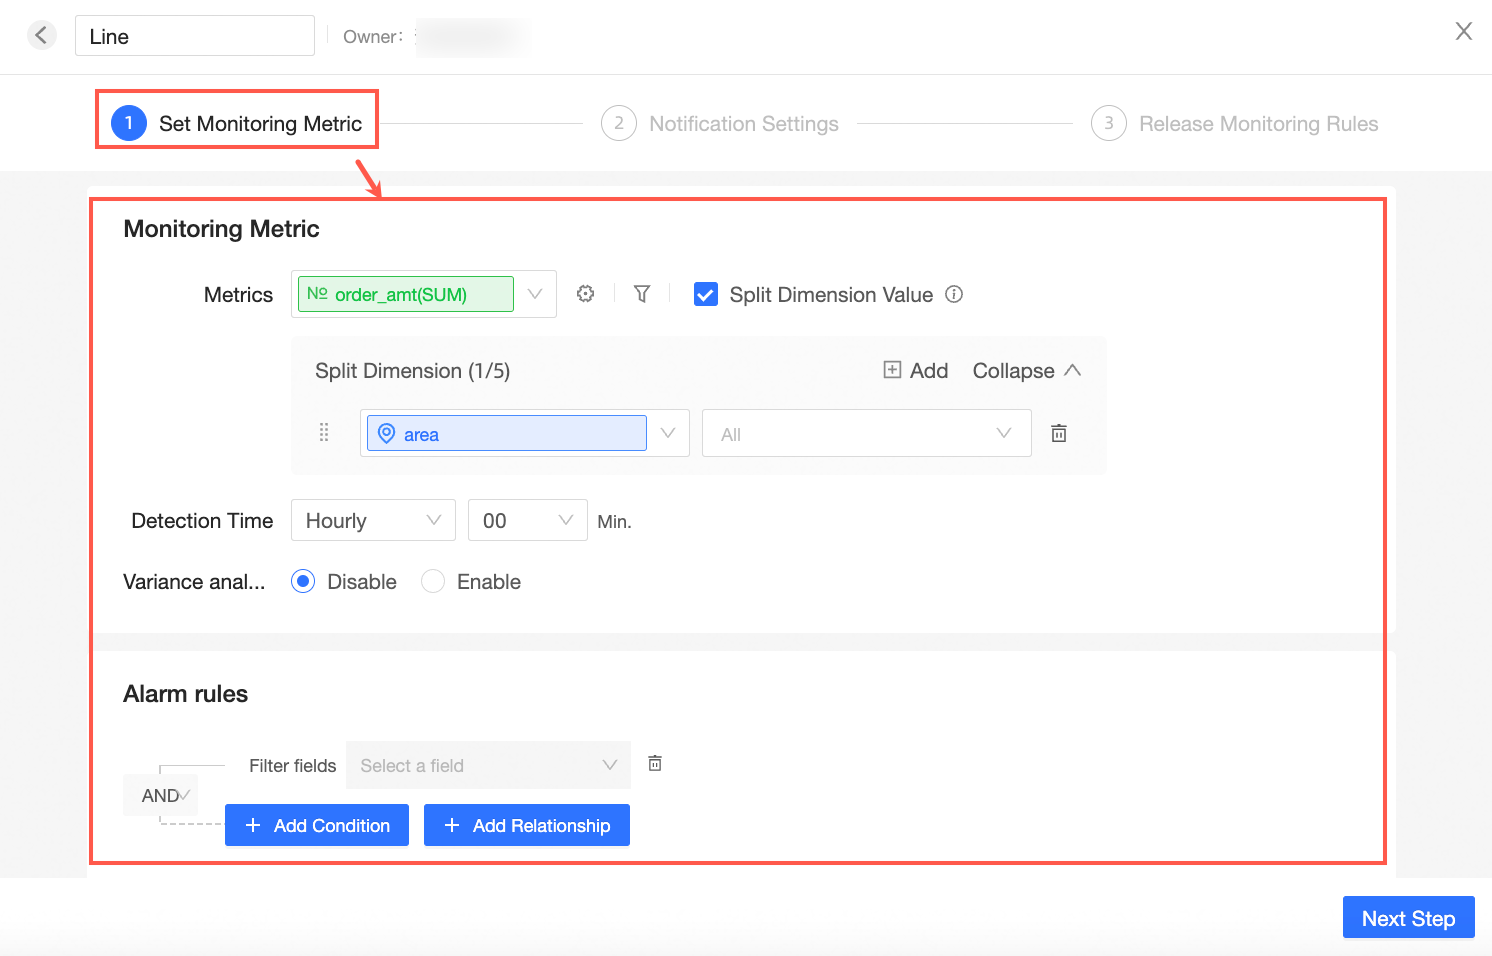
In this example, set rules for the Line Chart. First, you need to set the relevant configuration items of the monitoring indicators.
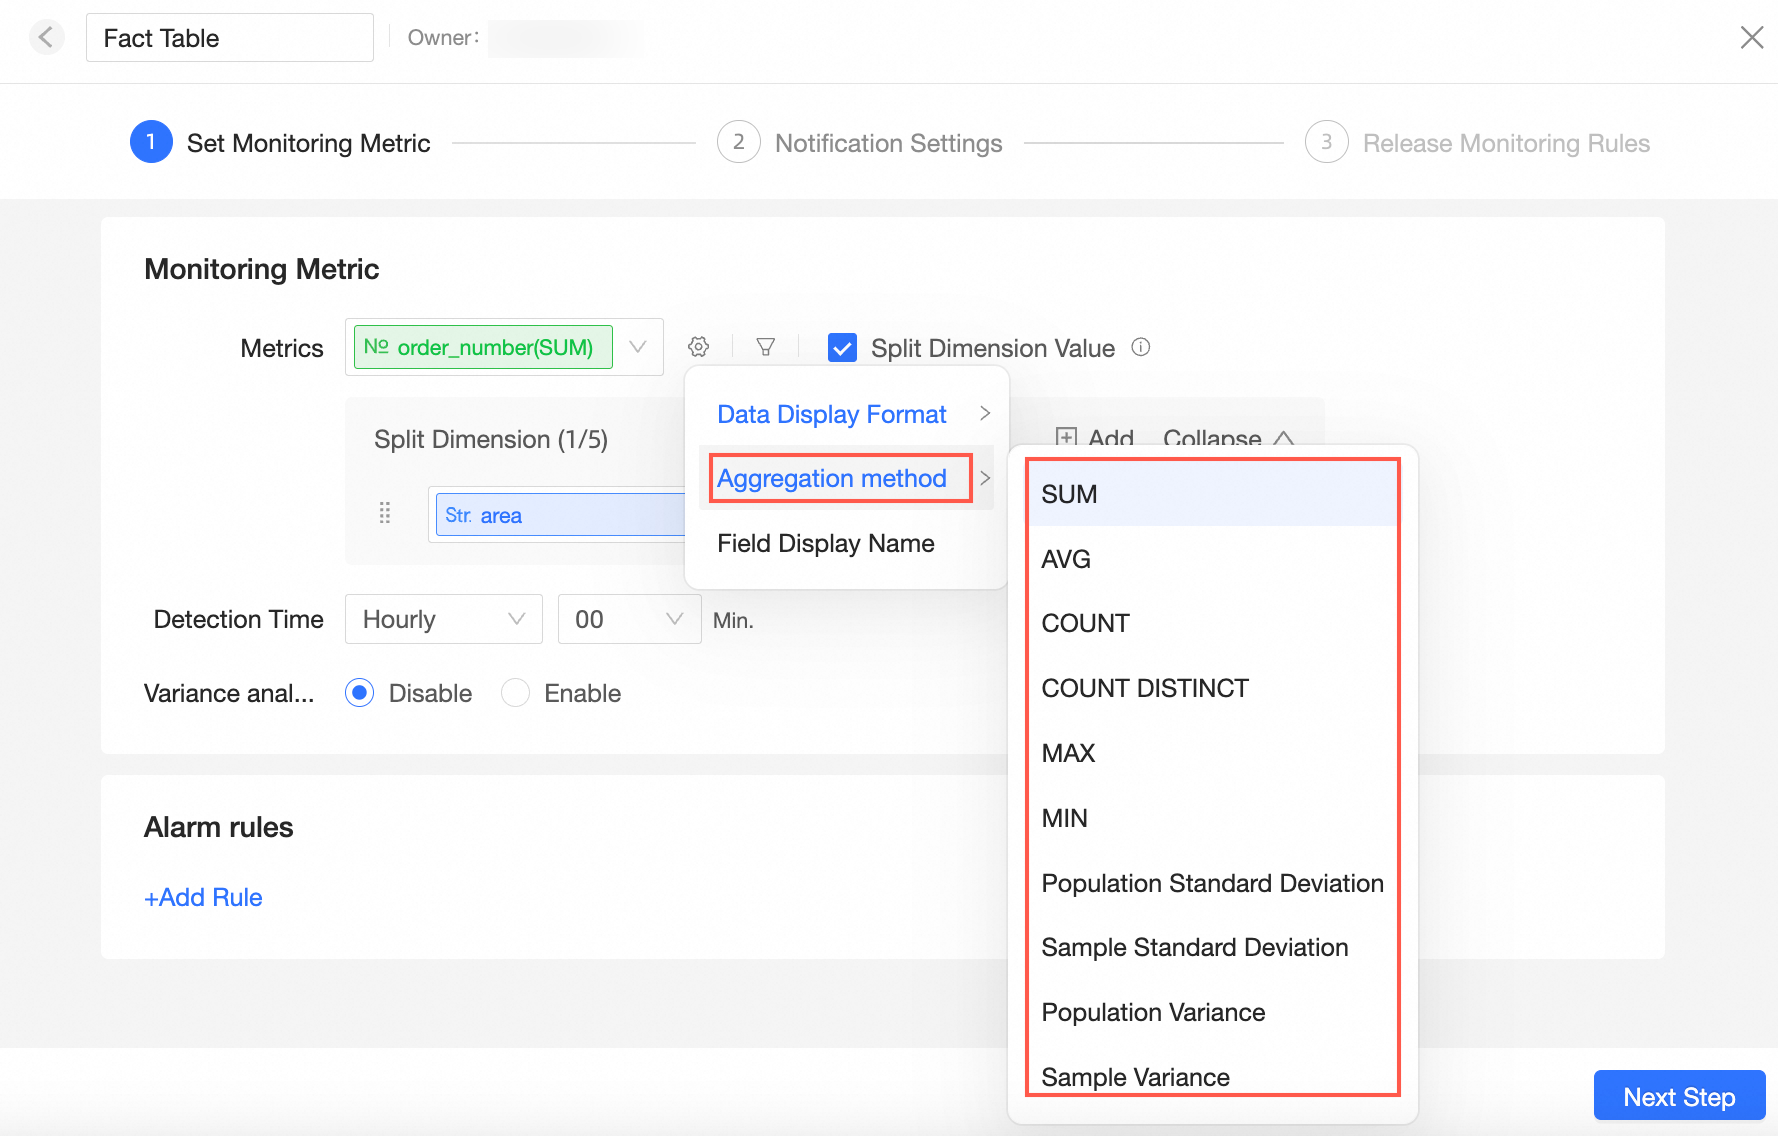
You can select the measure target (①) that you want to monitor. After selecting, you can click the
 icon on the right side of the measure box (②) to set the data display format and field display name for adjusting the measure (③).
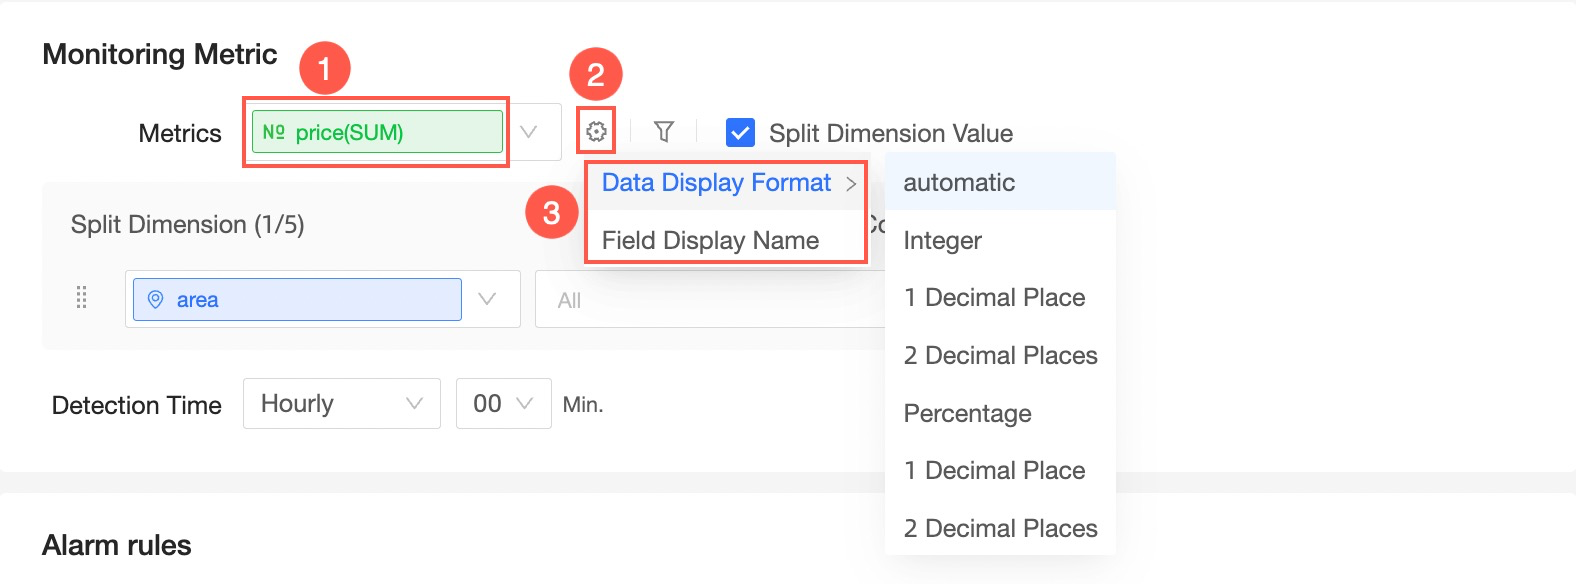 Note
NoteWhen the object of indicator monitoring is a detail table or workbook detail data, the aggregation method can be set.
Support clicking the
 icon to configure filter conditions. Monitoring will be restricted by the filter conditions, and calculations and alerts will only be performed on data that meets the filter conditions. When the line chart is associated with a query control or filter is configured and is in a filtered state, the corresponding filter conditions will automatically synchronize. You can click to enter the indicator filter condition settings popup area to add, edit, and delete filter conditions.
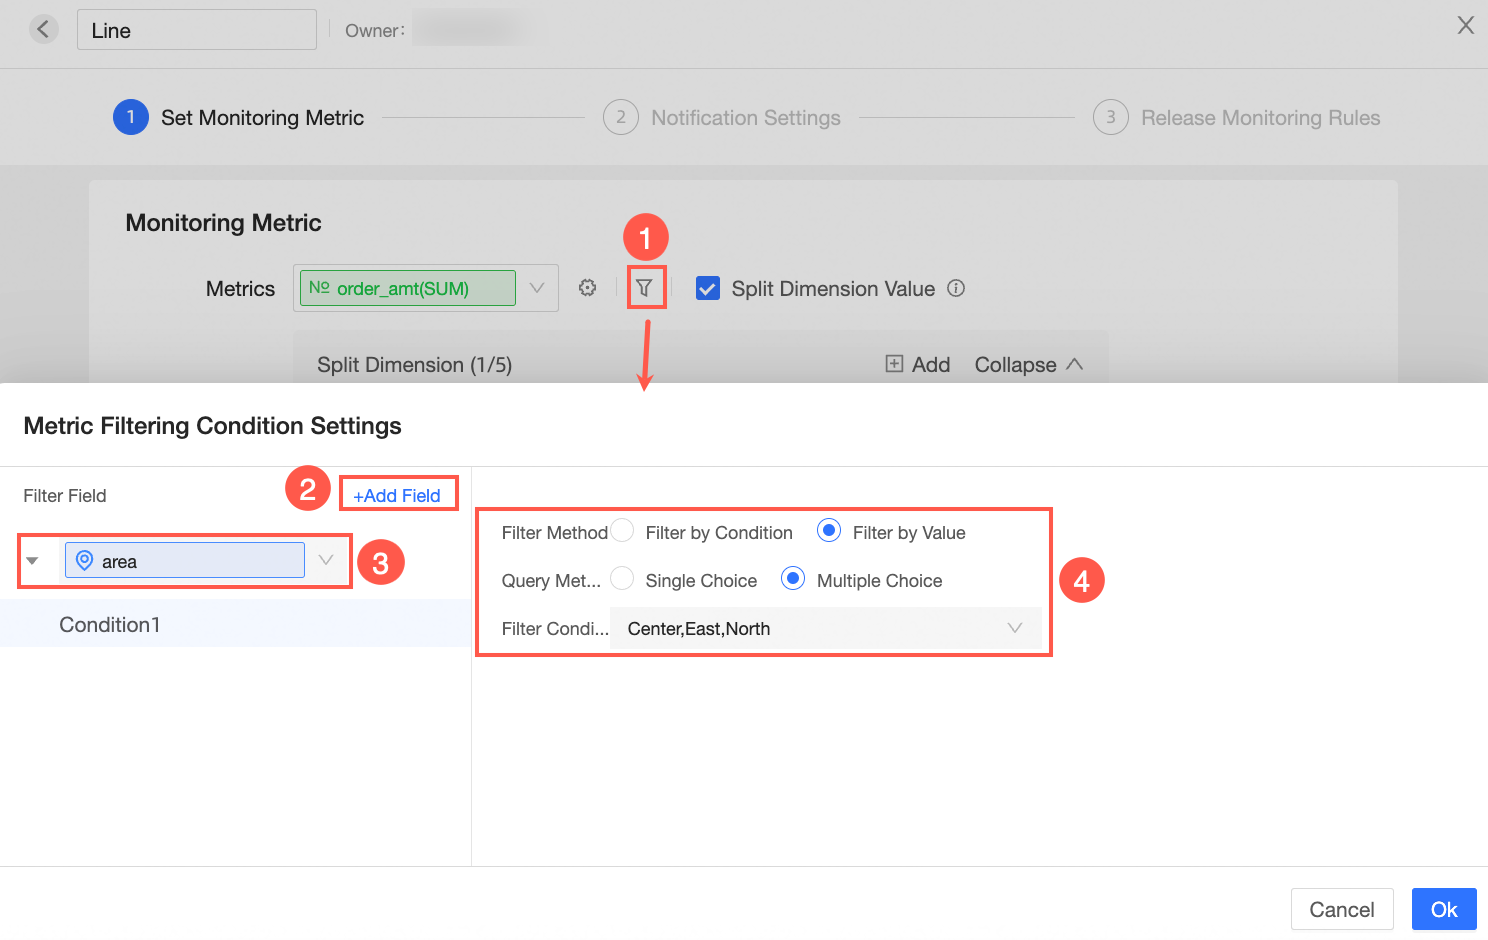
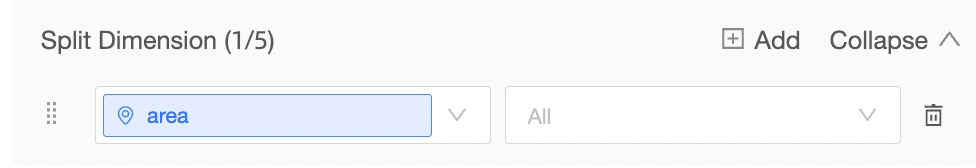
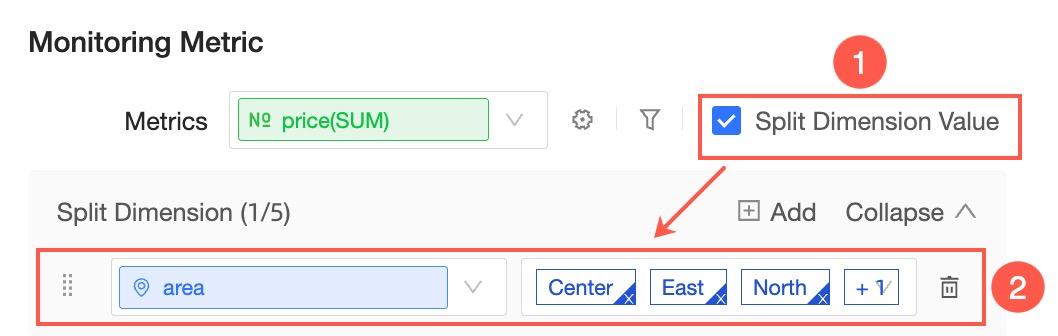
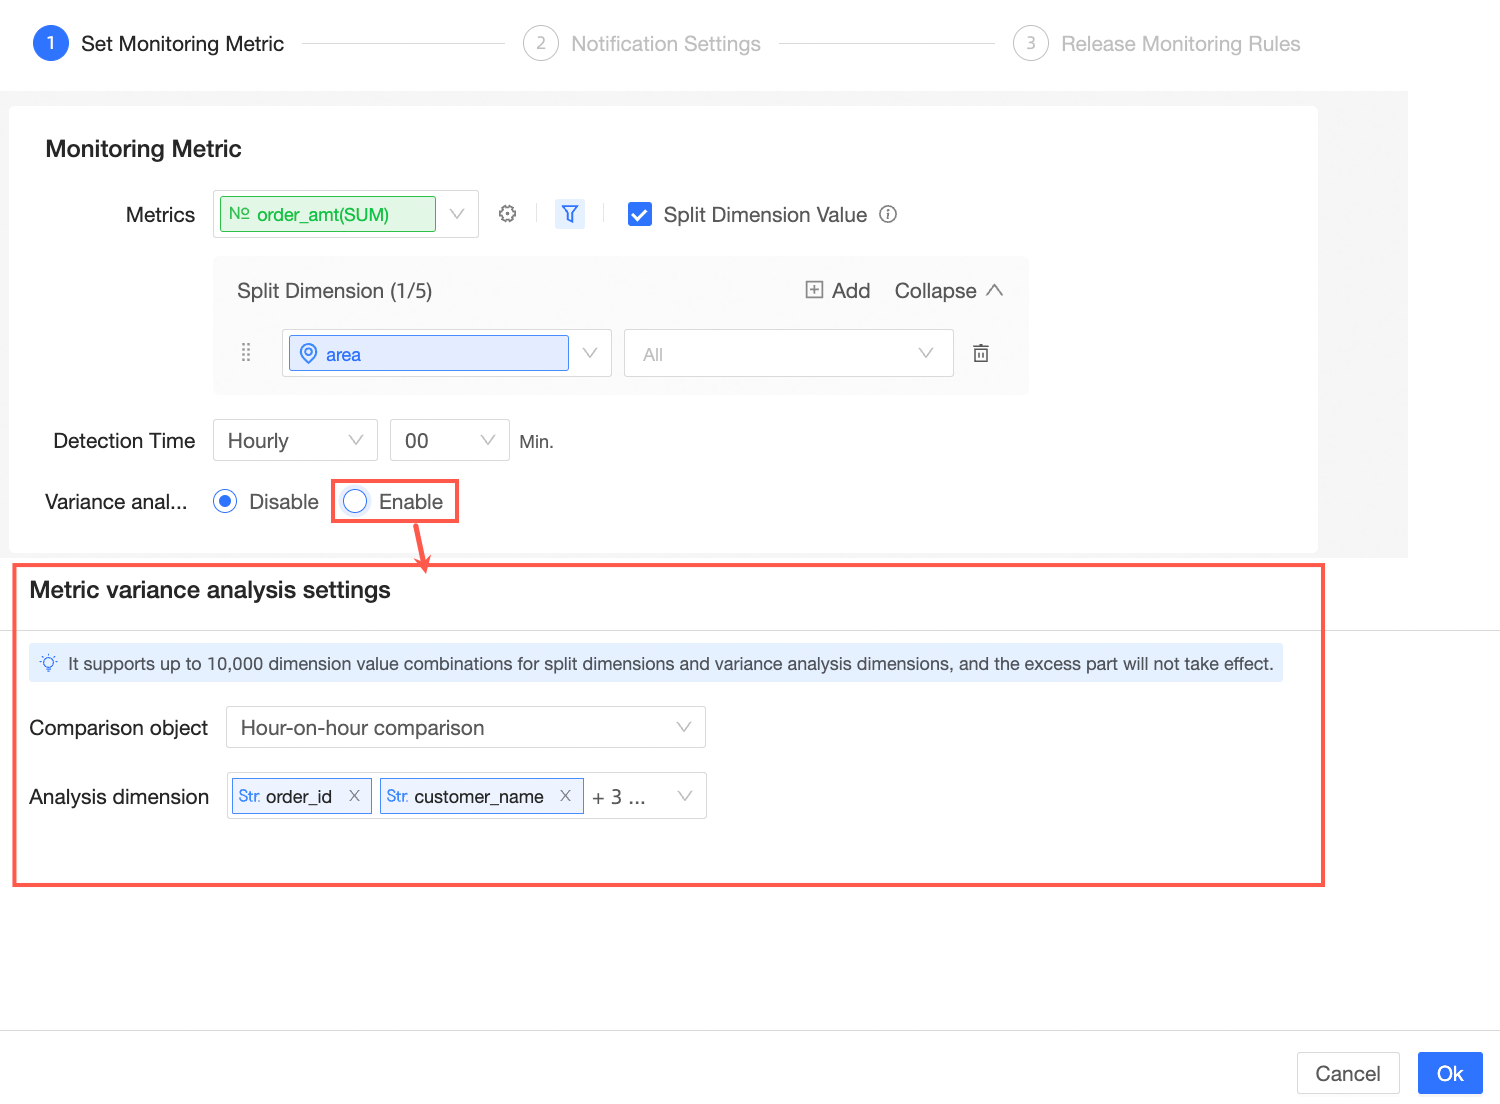
During monitoring, you can independently monitor the measure target and also support splitting by dimension. You can check the dimension split on the far right of the measure box to configure the specific monitoring dimension. After selecting the split dimension, all is displayed by default, and the newly added dimension values are dynamically loaded from the database.
You can also manually select the required dimension values. For example, if the split dimension is area and the dimension values are East China, North China, it means monitoring the data changes in East China and North China separately.
 Note
NoteSupport selecting dimensions in the chart and dimensions in the query control under the filter condition.
Up to 5 split dimensions can be added.
Splitting by dimension does not support selecting date-time type fields.
Up to 10,000 dimension value combinations are supported. Any excess will not be monitored.
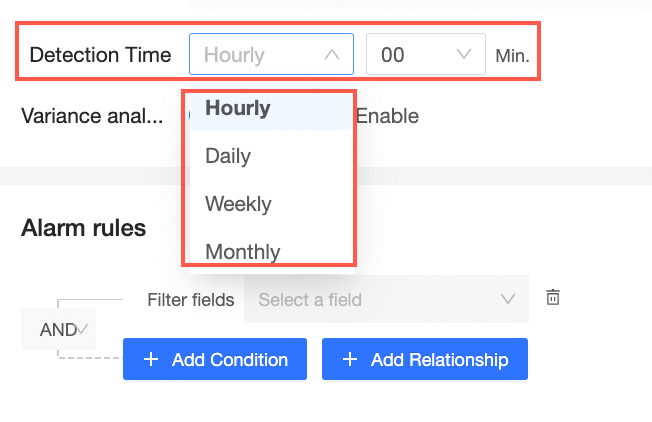
After setting the measure target, you can also select the monitoring detection time. Four granularity methods are supported: hourly, daily, weekly, monthly. Except for the hourly granularity, the other three granularity methods support multiple selections.
You can also set whether to enable fluctuation analysis, which is disabled by default. When the aggregation method of the monitoring measure is sum or count, fluctuation analysis can be enabled. You can select the comparison object and the required analysis dimension. After enabling, the relevant data situation will be displayed in the indicator details.
After you complete the configuration of the monitoring indicators on the monitoring indicator settings page, you can set the alert rules for the corresponding indicators.
When the filter field is measurement target, you can add alert filter conditions based on the measurement value or year-on-year and month-on-month change rate.
As follows, when the measure target profit amount is monitored based on the daily detection time granularity, and the field profit amount is selected in the alert rule, you can click the
 icon on the right to select the corresponding aggregation method. The supported options include measure value, compare (day to day), compare (of same day last week), compare (of same day last month). After selection, configure its filtering method and calculated value.
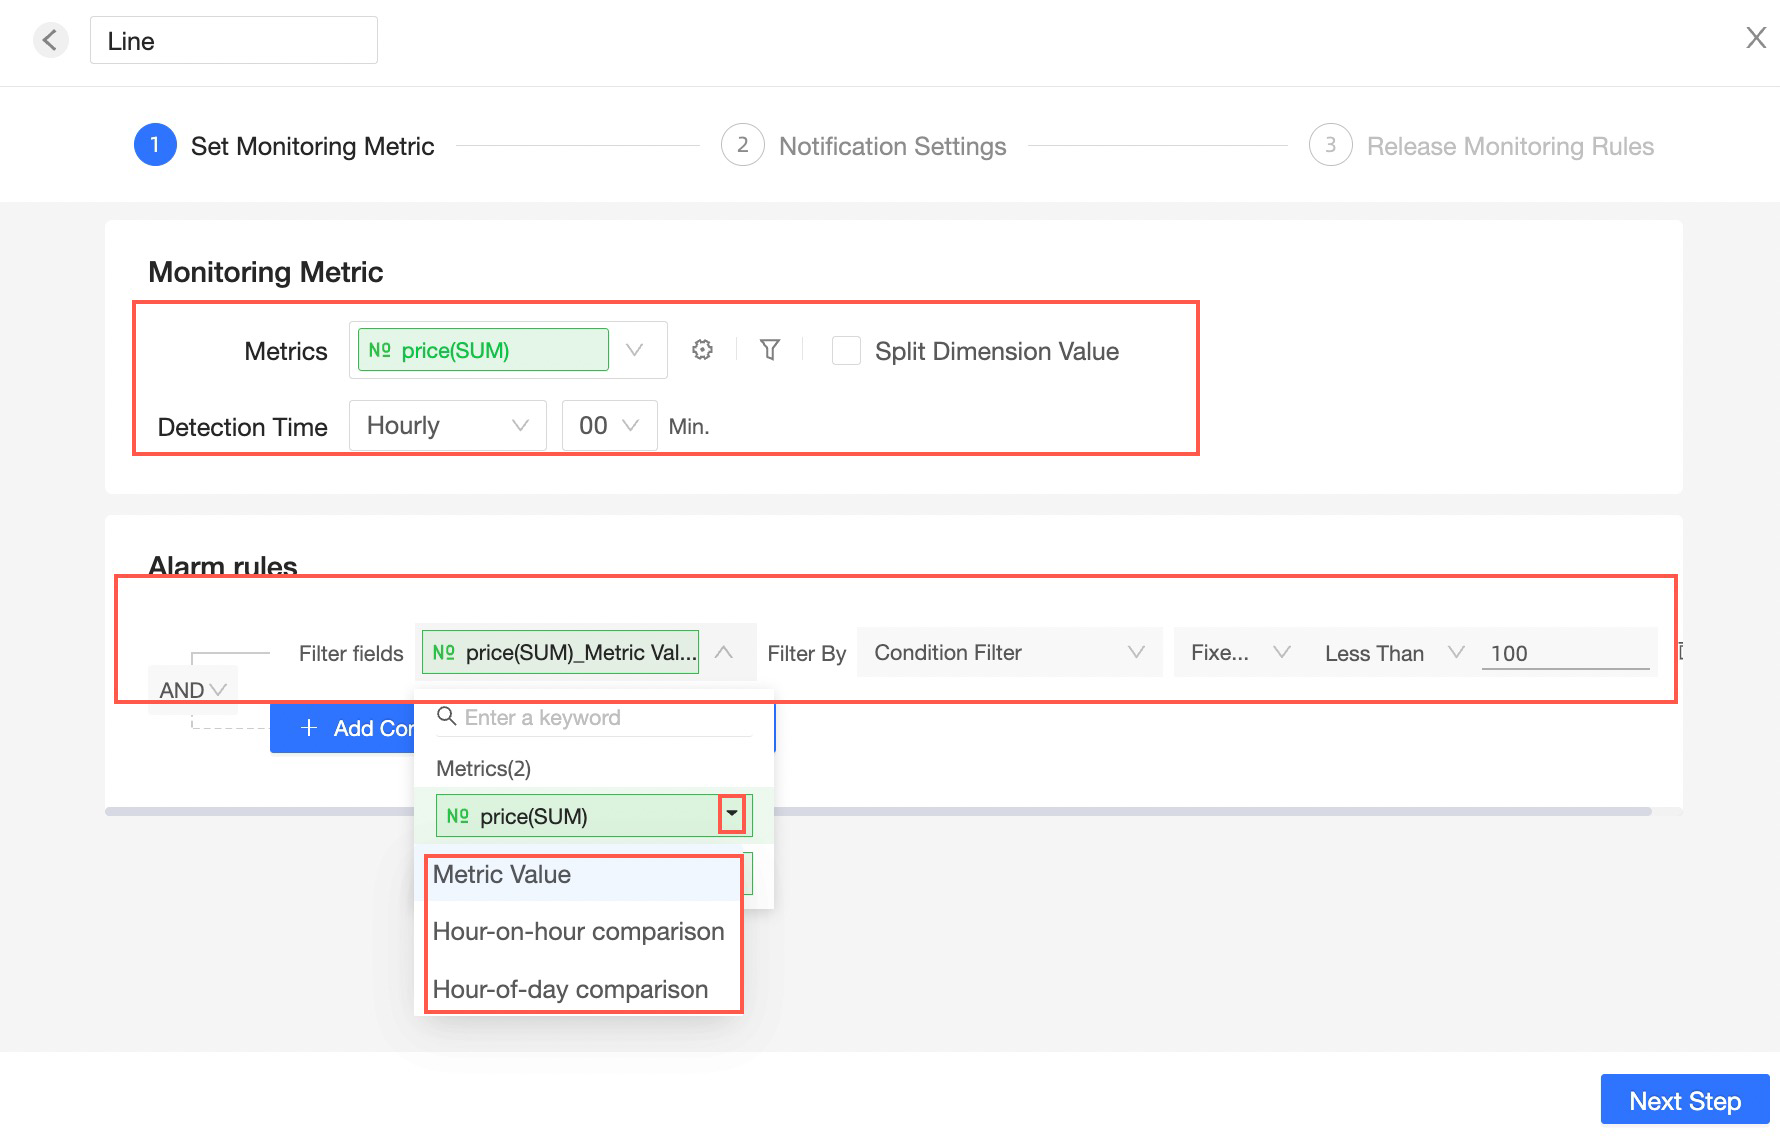 Note
NoteThe optional items for same period comparison are related to the detection time and include the following:
Compare with the previous hour: Compared with the previous hour.
Compare with the same time yesterday: Compared with the same time point the previous day. For example, compare 8 o'clock today with 8 o'clock the previous day.
Day-to-day comparison: Compared with the previous day.
Week-to-week comparison: Compared with the previous week.
Month-to-month comparison: Compared with the previous month.
Compare (of same day last week): Compared with the same day of the previous week. For example, compare this Wednesday with last Wednesday.
Compare (of same day last month): Compared with the same day of the previous month. For example, compare the 15th of this month with the 15th of last month.
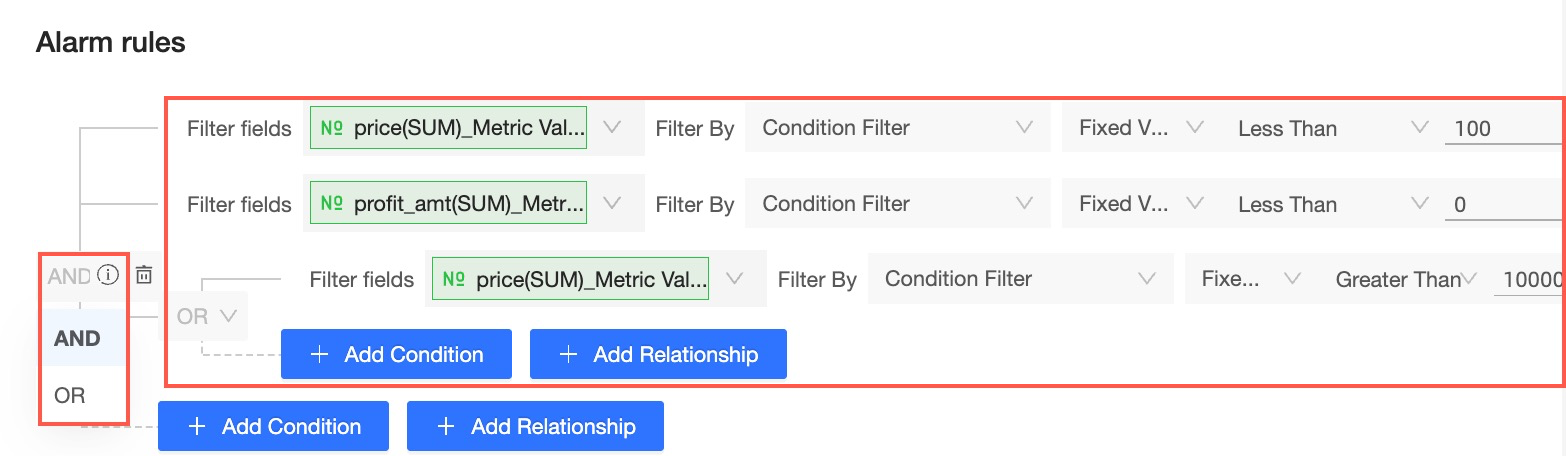
When the filter field is a non-measure target, you can add alert filter conditions based only on the measure value. The rule supports switching the and/or condition relationship, and under the relationship, supports adding multiple conditions.
Push Message Settings
After completing the monitoring indicator settings (steps 4 and 5 are completed), you can configure the monitoring alert push messages.
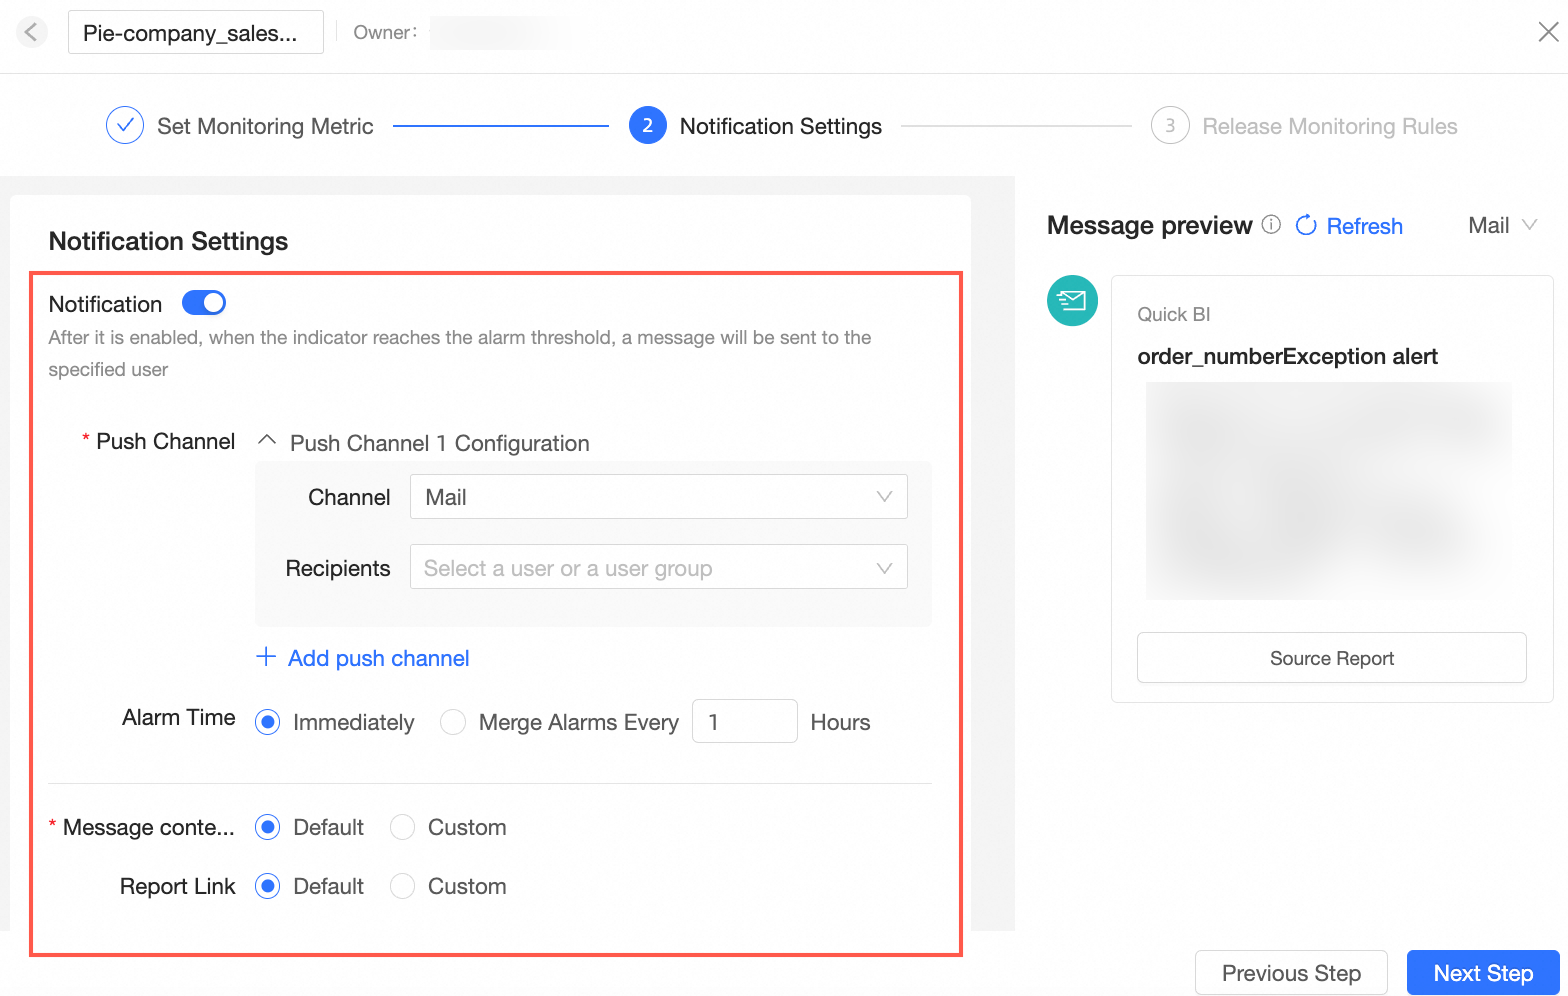
You can set whether to enable push message notification. After you check enable, you can configure the following parameters:
Channel
Click to add one or more push channels. The supported channels are DingTalk, Lark, Email, and Custom Channel.
Before you use the DingTalk, WeCom, or Lark alert methods, make sure your account is attached to the corresponding mini program. For more information, see (Public Cloud) Enable the DingTalk mini program, Activate a Micro Application for Feishu, and (Public Cloud) Enable the Lark mini program.
Before you use the Email alert method, make sure you have attached a Mailbox in Account Settings & Management > Account Binding.
Before using the Custom Channel alert method, make sure that a custom bot has been added. After configuring the custom channel, messages can be pushed to external interfaces. For more information, see custom channel.
Multiple recipients can be configured. Support selecting users and user groups.
ImportantMonitoring alerts only support sending to users within the organization. User groups.
This parameter is only displayed when the alert method is email.
This option is only displayed when the Detection Time is set to Hourly/daily granularity.
When the push method is custom channel, custom interval time to merge alerts is not supported.
In the default state, the message title and description cannot be modified.

In the custom state, you can modify the message title (①) and message description (②), and support message preview (③).

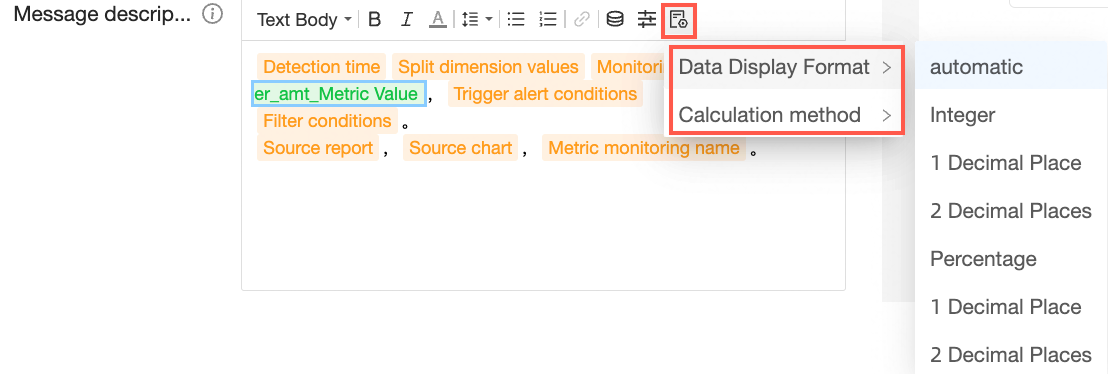
The message description supports adding parameters, setting fields, and formatting text. You can apply bold, italics, underline, font color, alignment, line spacing, unordered lists, ordered lists, links, metrics, and the @mention feature.

Add parameters
Support adding the following parameters.

Field settings
Support selecting the measure value and setting the data display format and calculation method of the measure value.
@Capability
Click the at sign (@) or enter @ to select a member from the drop-down list.
NoteOnly alert messages sent to a Lark group through the Quick BI Mini Program bot support the @mention feature. For other channels, the @mention is parsed as plain text.

The message description content is limited to 100 words.
Custom channels do not support custom message content.
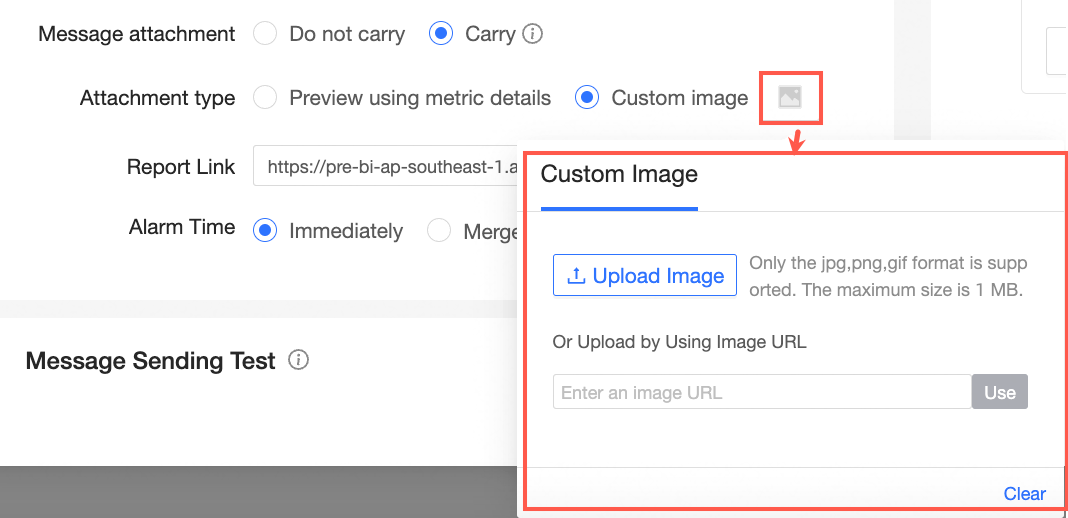
After checking carry, the thumbnail supports selecting use indicator detail preview or custom image.
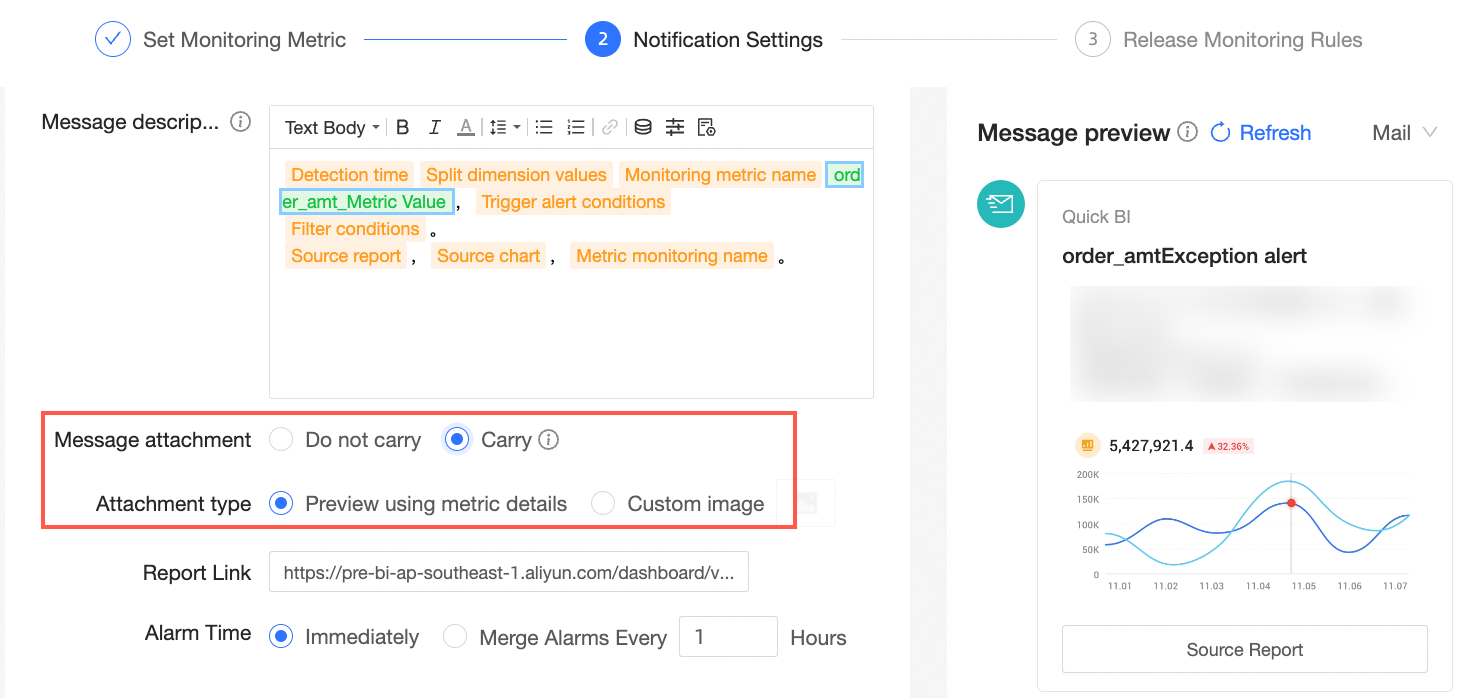
Custom image supports uploading local images or uploading via image links.
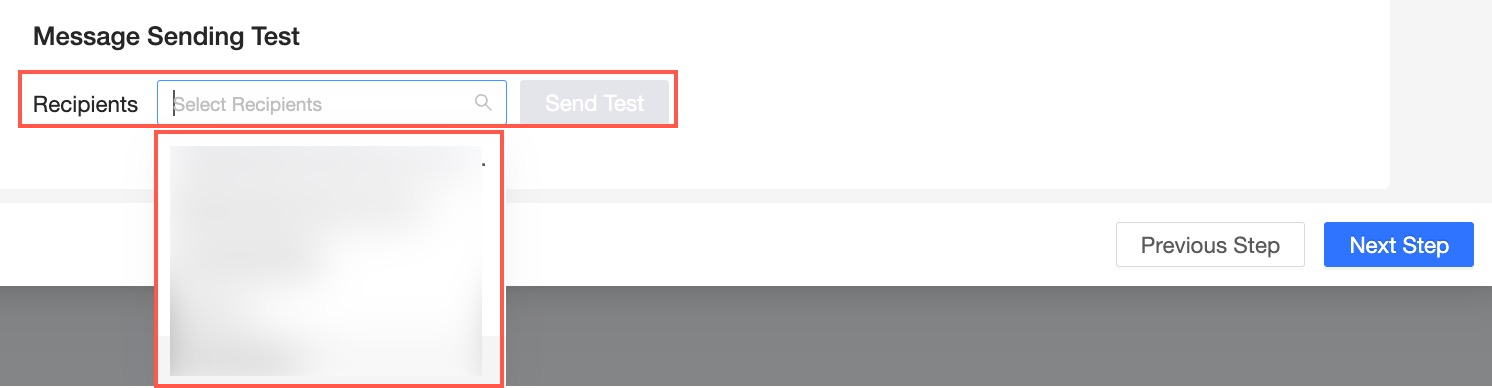
After you complete the message push settings, you can select the recipient in the message sending test area below to receive the test.
Configuration item | Configuration item description |
Push channel | |
Alert time | Support selecting alert immediately when an abnormality is detected or custom interval time to merge alerts. Note
|
Message content | Support selecting default or custom. Note |
Message attachment | By default, it is not selected to carry. Enabling it may cause a delay of about 10 minutes. |
Report link | Support selecting default or custom. By default, it is the link of the corresponding dashboard, and custom modification is supported. |

Publish Monitoring Rules
After you have completed the monitoring indicator settings and push message settings, you can set the publish rules and also set the historical data retention period.
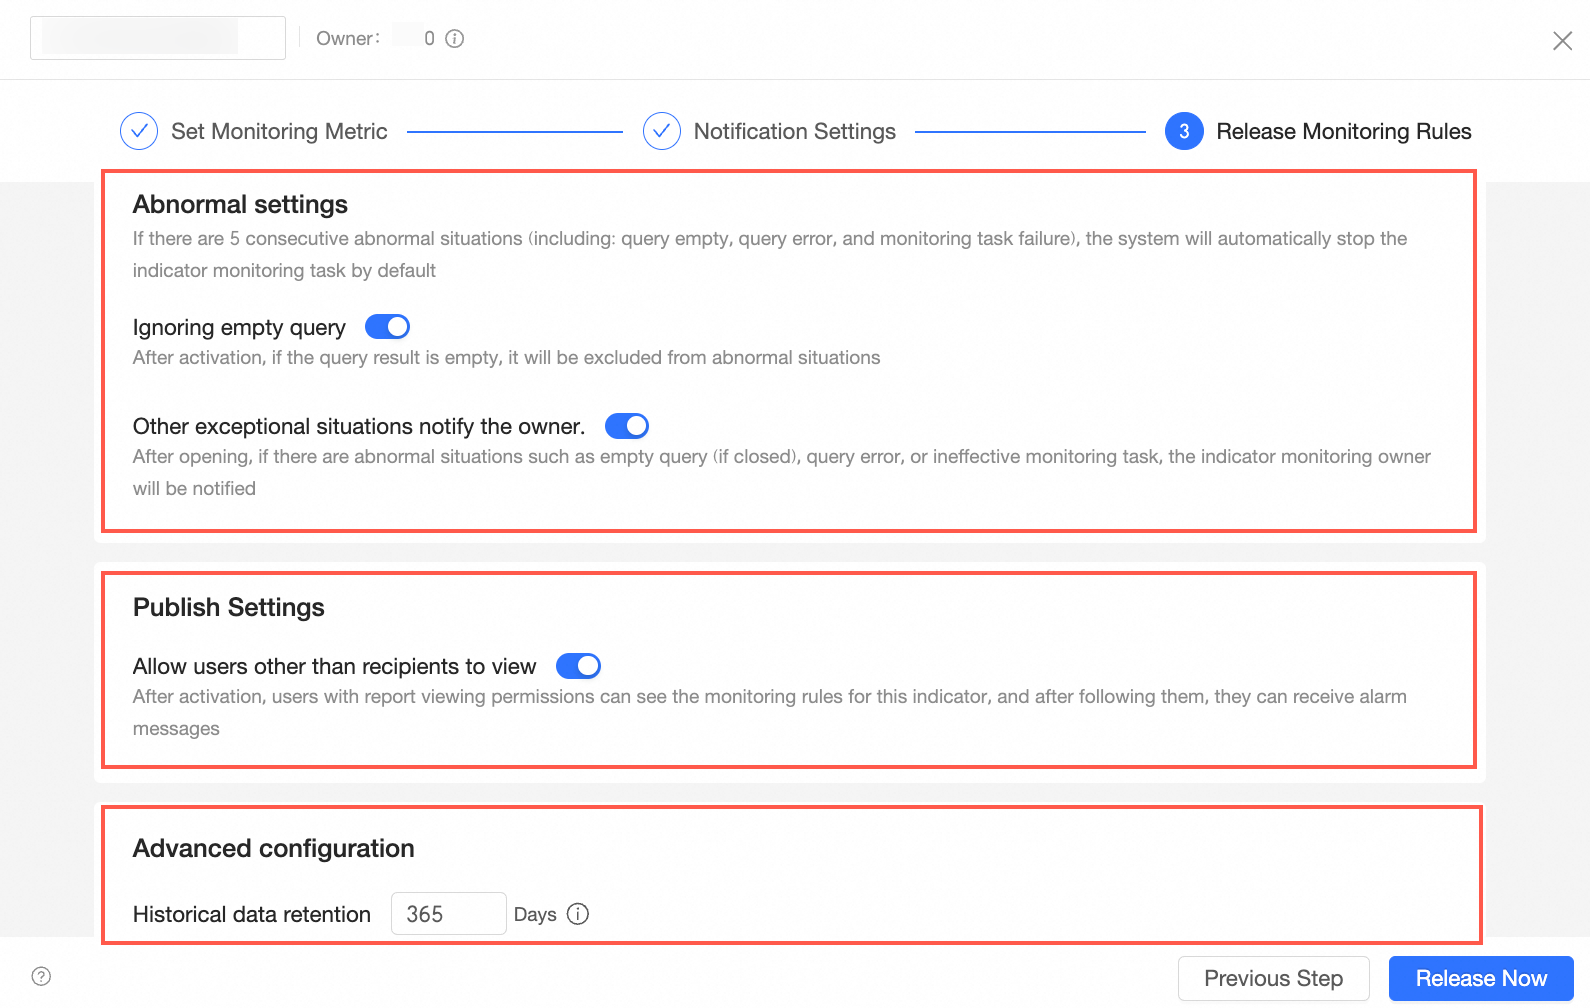
Abnormal Settings
If an abnormal situation occurs five times in a row (abnormal situations include the following: query is empty, query error, monitoring task failure), the system will automatically stop the indicator monitoring task by default.
Ignore empty query: After enabling, empty query results will be excluded from abnormal situations. For example, if the main monitoring indicator is set to payment amount, and the alert rule is set to monitor number of paying buyers or average customer transaction. When the payment amount query result returns empty, the system will still verify the alert rules for number of paying buyers and average customer transaction.

Notify the owner of other abnormal situations: After enabling, if no data is obtained, query error, or monitoring task failure, the indicator monitoring owner will be notified. If the task fails five times in a row, the task will be stopped.
Publish Settings
Allow users other than recipients to view: After enabling, authorized users can see the indicator monitoring rules and receive alert messages after following them.
Advanced Configuration
Historical data retention: Set the retention time of historical data. The default is 30 days. Up to 1,000 entries of data can be retained.
After setting, click the bottom right corner to publish immediately, and the monitoring rules will be successfully published.