A ranking board displays the rankings of items in a dimension. The items are ranked in descending order. For example, you can use a ranking board to display the top 10 cities that have the largest sales volumes. This topic describes how to create a ranking board and configure the styles of the ranking board.
TensorBoard
The leaderboard contains the basic leaderboard and the percentage scrolling leaderboard. The following figure shows the effect. 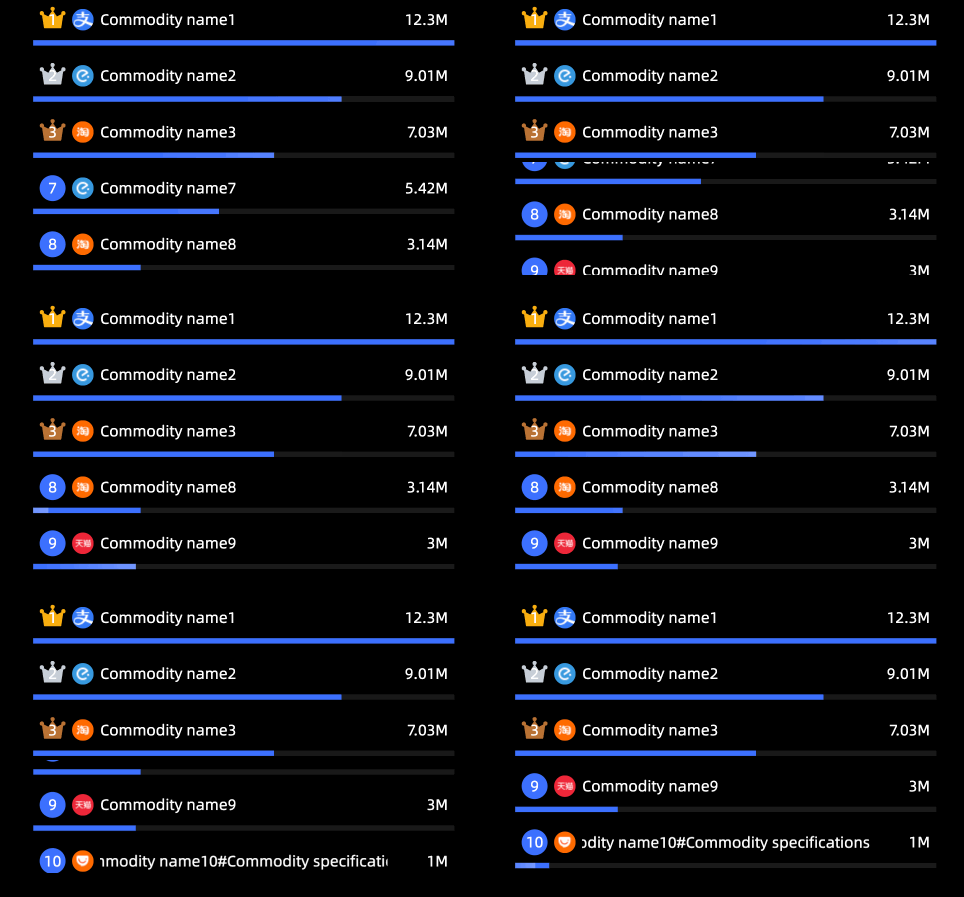
Configuration data
The Basic Leaderboard is used as an example to describe how to configure a leaderboard.
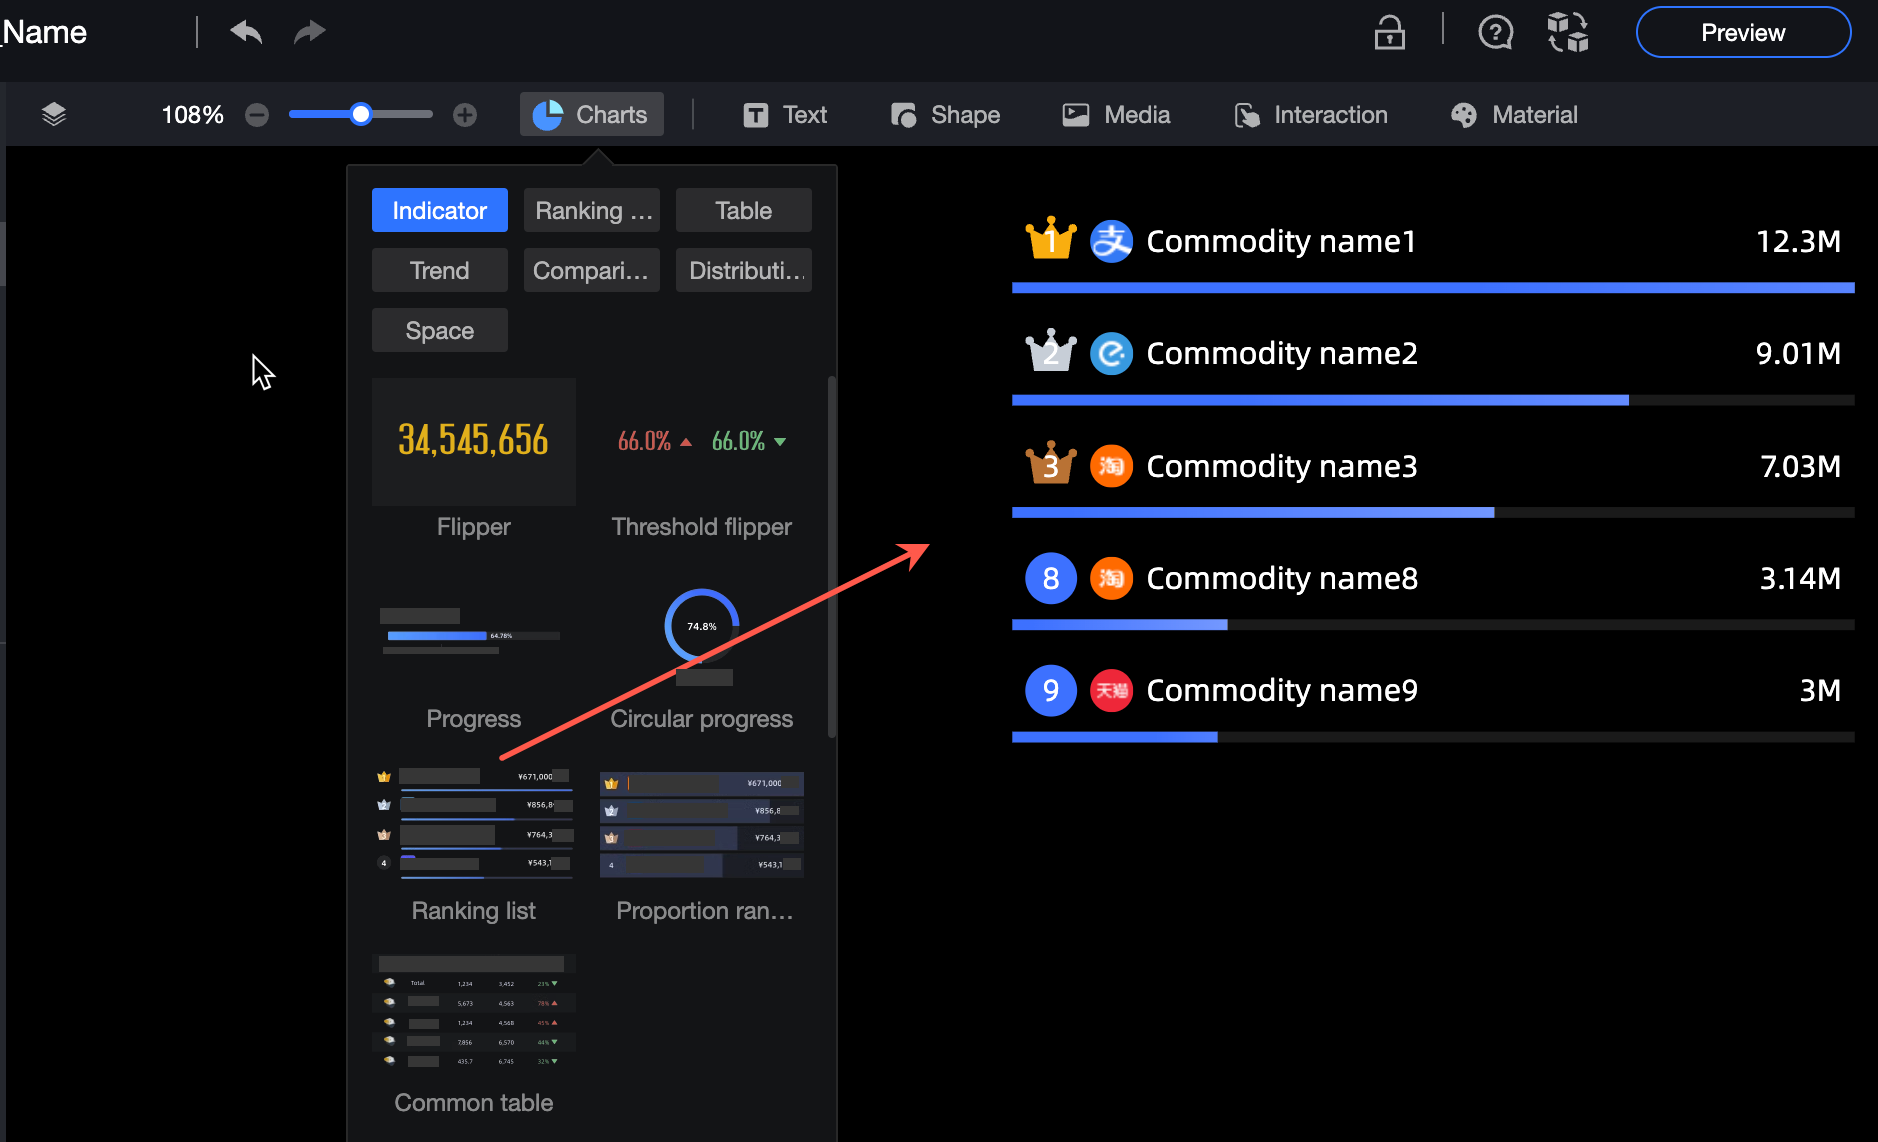
In the Charts section of the Widget Library section, find Basic Ranking and drag it to the canvas.
Click Select Dataset and follow the instructions in the following figure to add data.
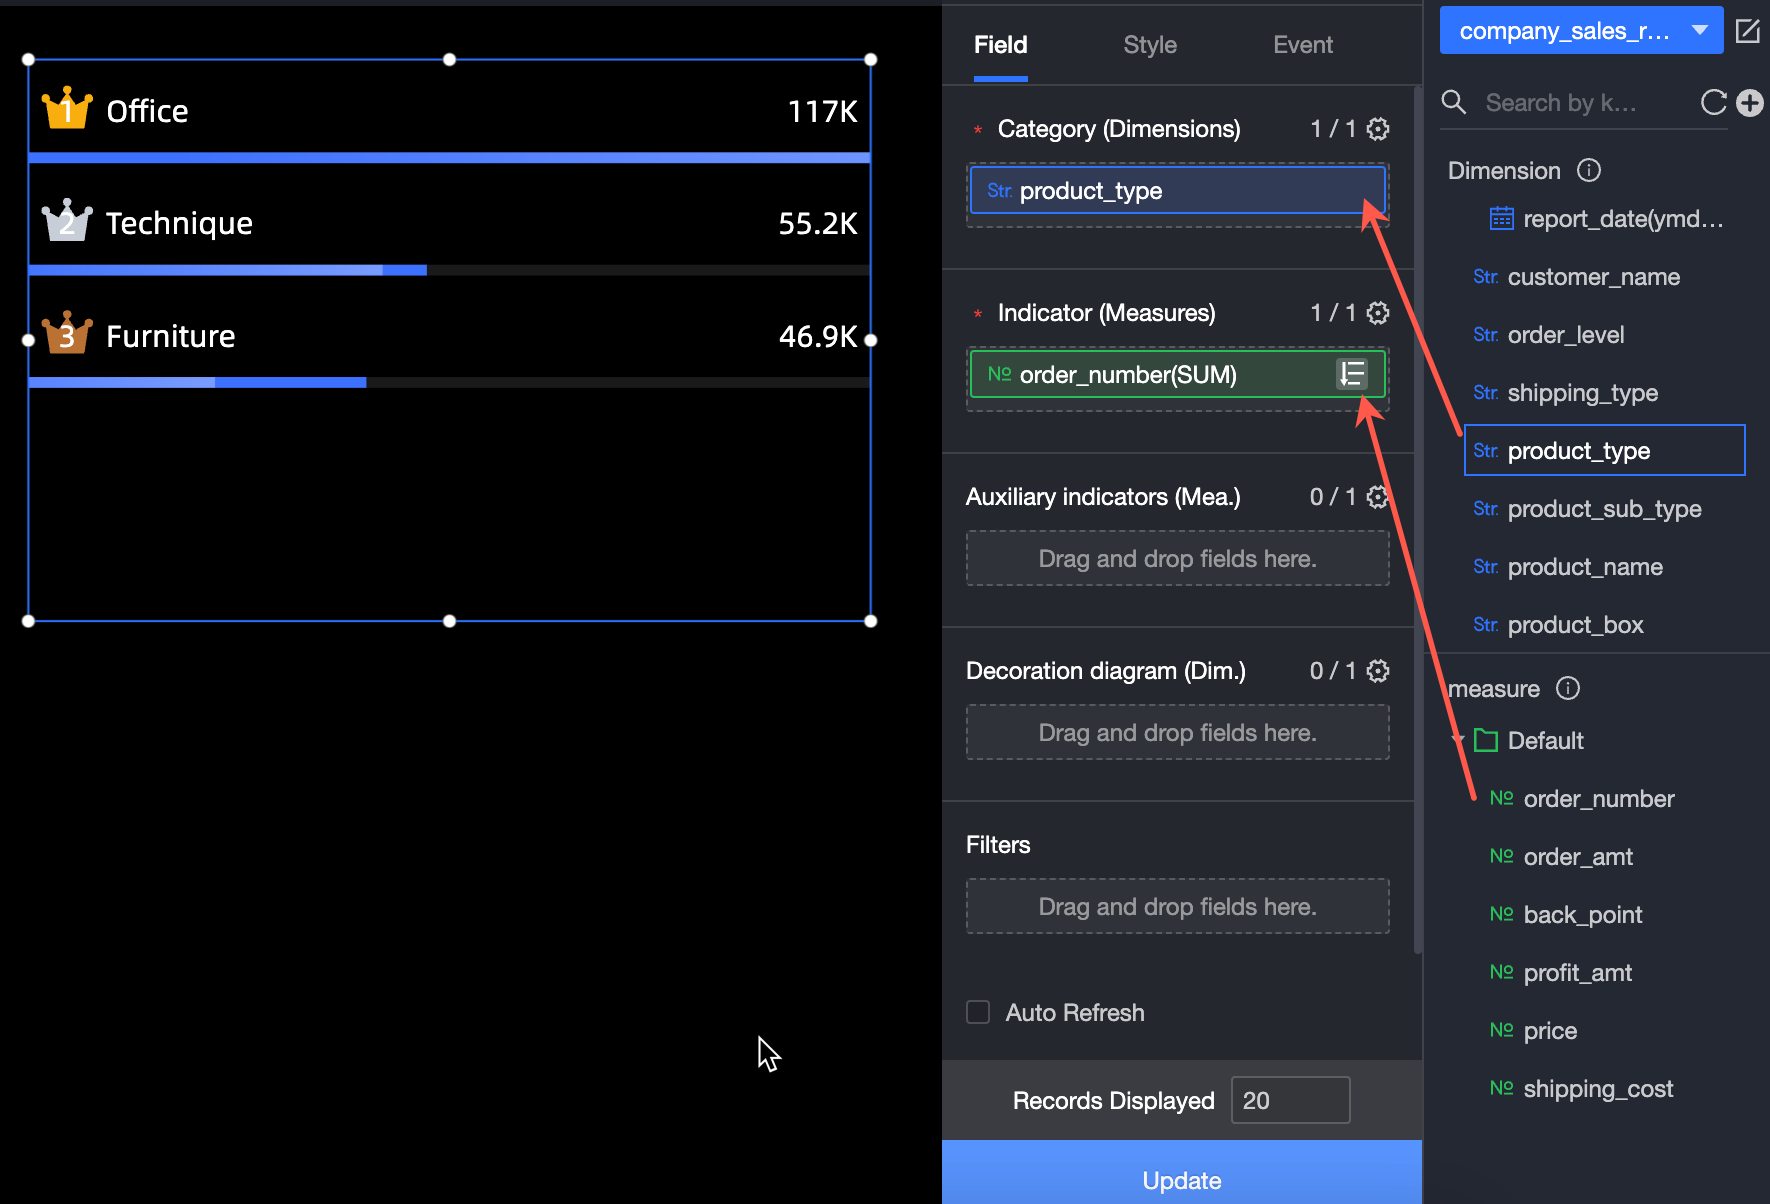
You can also perform the following operations on the data: 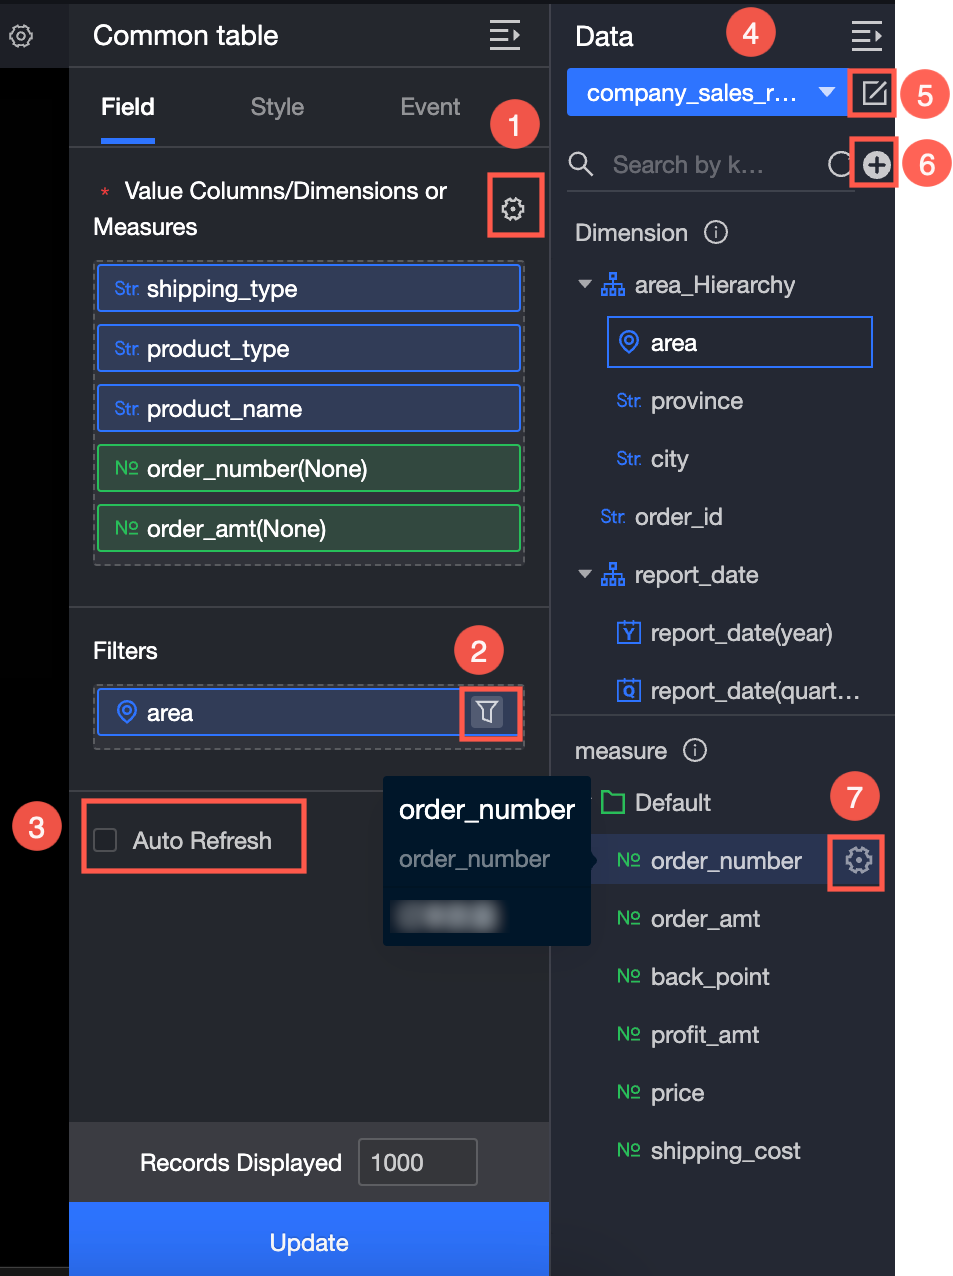
Configure multiple field formats. For more information, see Configure multiple field formats.
Configure field filtering. For more information, see Filter data.
Configure automatic data refresh (③). For more information, see Scheduled data refresh.
Switch a dataset. For more information, see Switch a dataset.
Edit a dataset. For more information, see Edit a dataset.
Data processing (⑥). For more information, see Create a calculated field and Create a group dimension.
Copy fields. For more information, see Copy to Dimension.
Configure Style
In this example, Basic Leaderboards is used to describe how to configure a leaderboard.
Location and size
You can configure the components in the configuration section as follows:
Adjust widget alignment (①): supports left alignment, center alignment, and right alignment.
Adjust the size of the widget (②): Use the upper left corner as the origin, set the values of the X and Y axes, and adjust the position.
Adjust the angle of the component (③): Set the value of the rotation angle.
Adjust the size of the component (④): Set the values of W and H to adjust the width and height of the component.
Lock component (⑤): After locking the component, the size of the component cannot be adjusted.
Transparency (⑥): You can configure the transparency range to 0%-100%.

Row and column settings
In the Row and Column Settings section, you can perform the following operations:
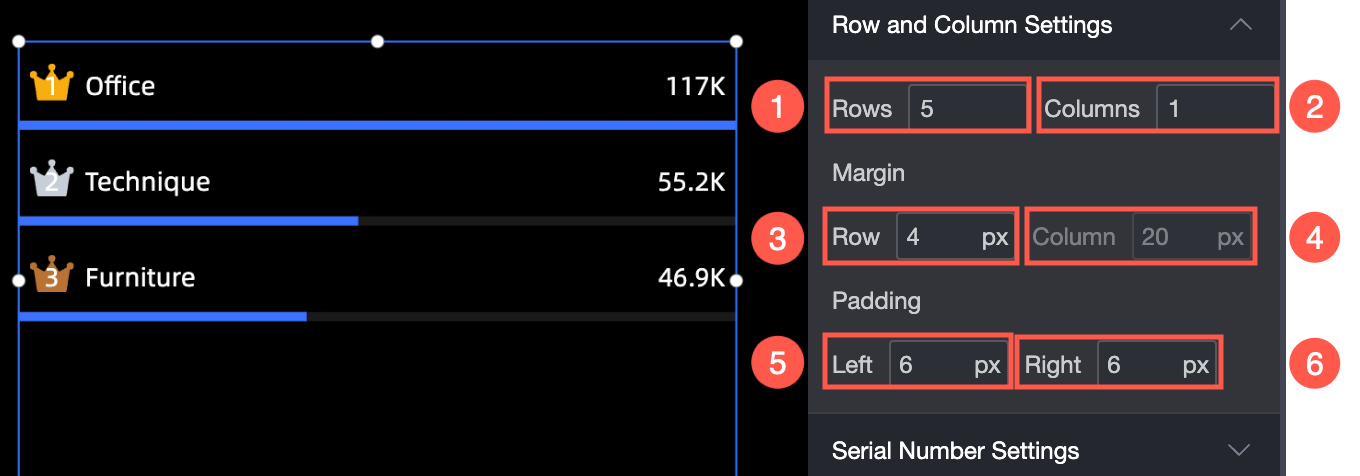
Set the number of rows and columns (① and ②) in the leaderboard.
Set the row and column spacing values (③ and ④) and the left and right margins (⑤ and ⑥) in the row.
The sequence number of the template.
In the Serial Numbers section, you can set the Text Style, Icon Size, Corner Radius, Background Color, and Top 3 Style parameters. 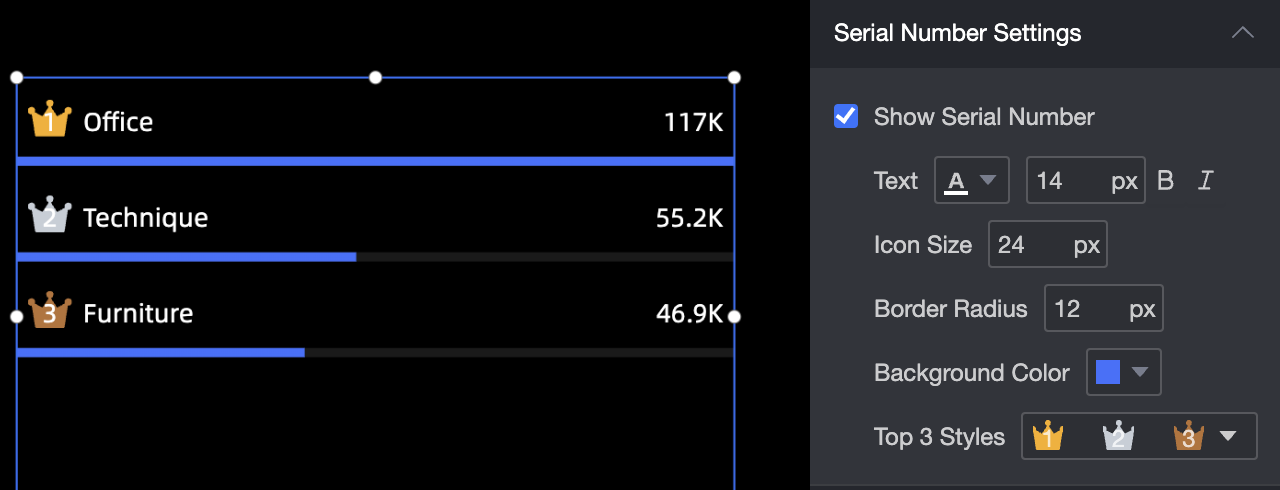
Rows header
In the Rows section, you can specify the color, size, bold, and italic text for the row header. 
Metric
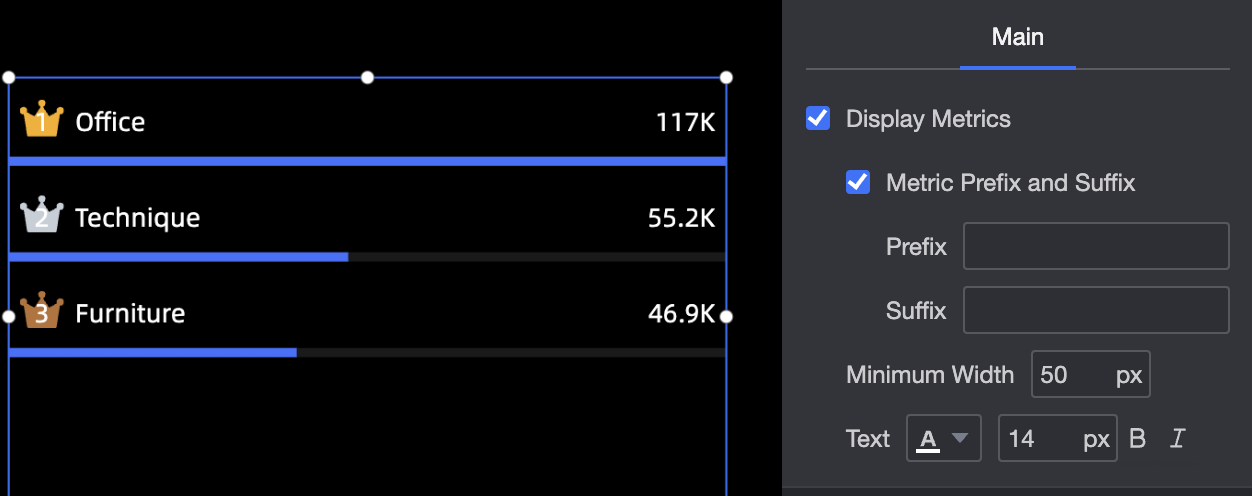
In the Metrics section, you can perform the following operations:
Prefix and Suffix: Set the prefixes and suffixes (③ and ④) of the primary and secondary metrics (①) and secondary metrics (②).
Minimum Width: Set the minimum width (⑤) between the metric and the row header.
Text: Set the color, size, bold, or italic of the indicator text.
Proportion bar
In the Scale Blocks section, you can set the height, color, and background color of the scale bars. 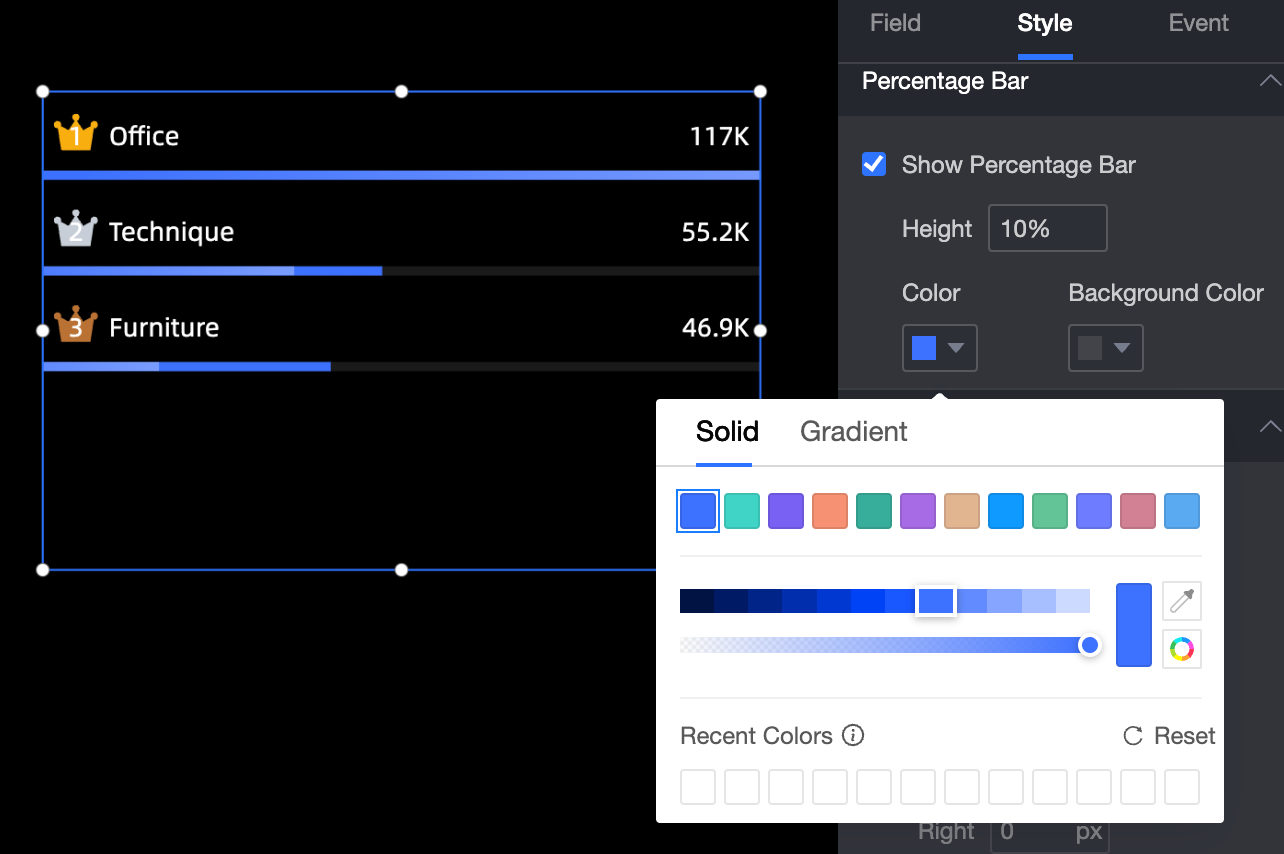
Separator line
In the line separator section, you can set the height, color, and left and right margins of the divider. 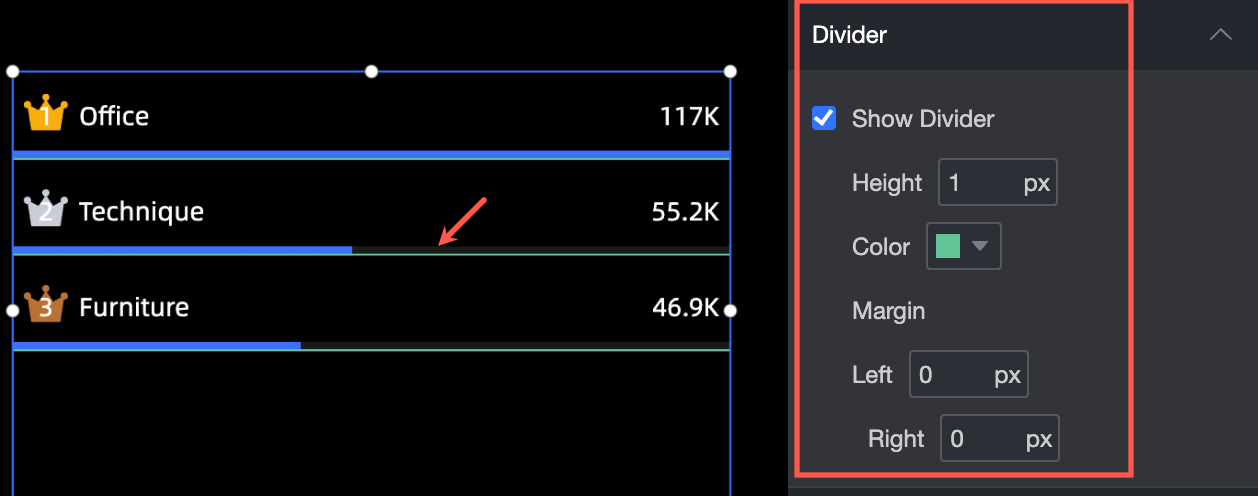
Animation effect
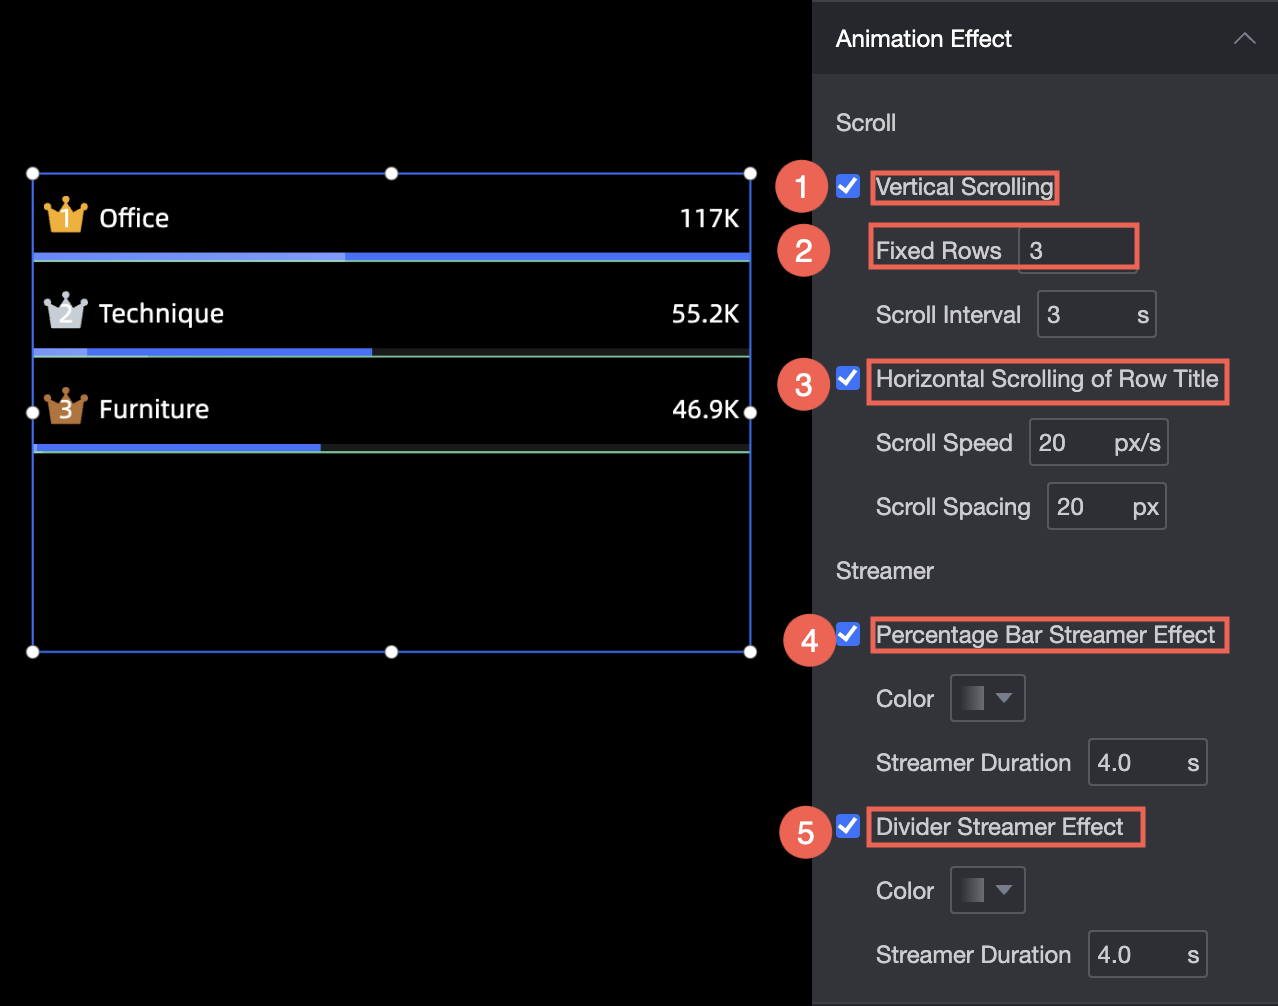
In the Animation Effects section, you can configure an animation effect for the leaderboard. You can configure the following items:
Enable Vertical Scrolling: specifies the number of rows to scroll in the vertical direction of the leaderboard and the time interval for scrolling.
Turn on Line Header Scrolling: Set the horizontal scrolling speed and interval of the row headers.
Enable Stream Effect: Set the color and duration of the Stream Effect.
Turn on Split Stream Effect: Set the color and duration of the split streamer effect.
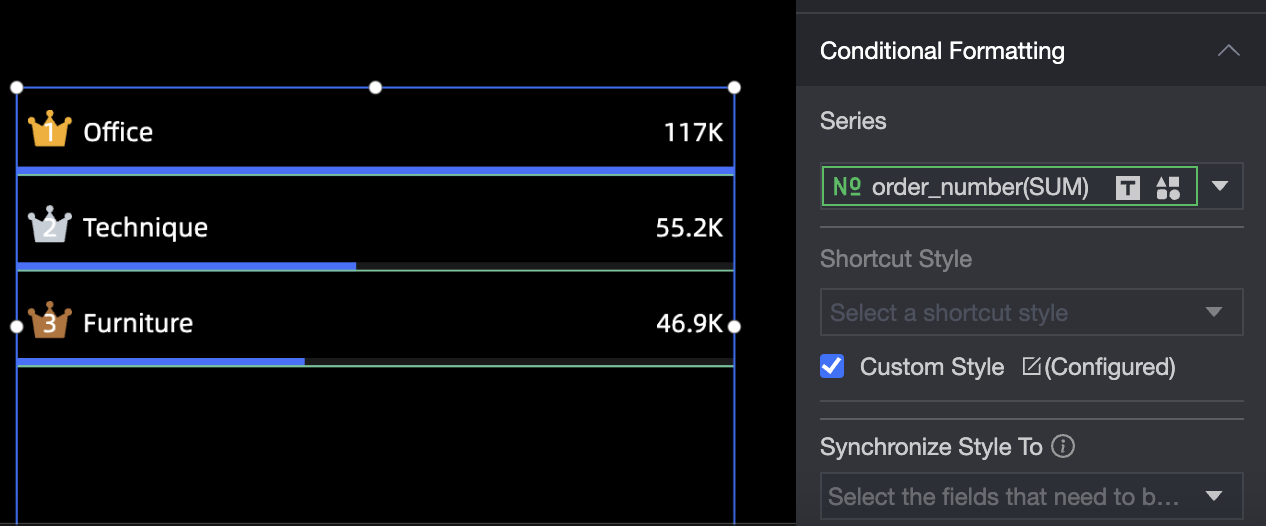
Conditional Formatting
In the Conditional Formatting section, you can specify a conditional format for the metrics.
Select Series: You can select all measures that you add to the Indicators section.
Shortcut Style: Specify the color of the marker icon and font.
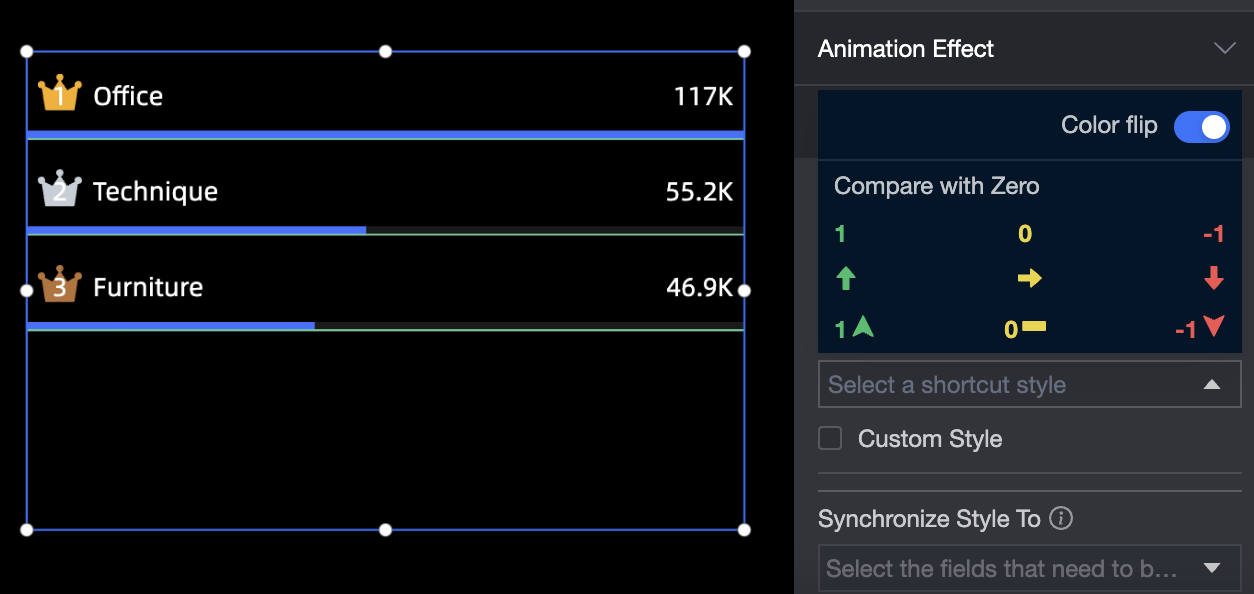
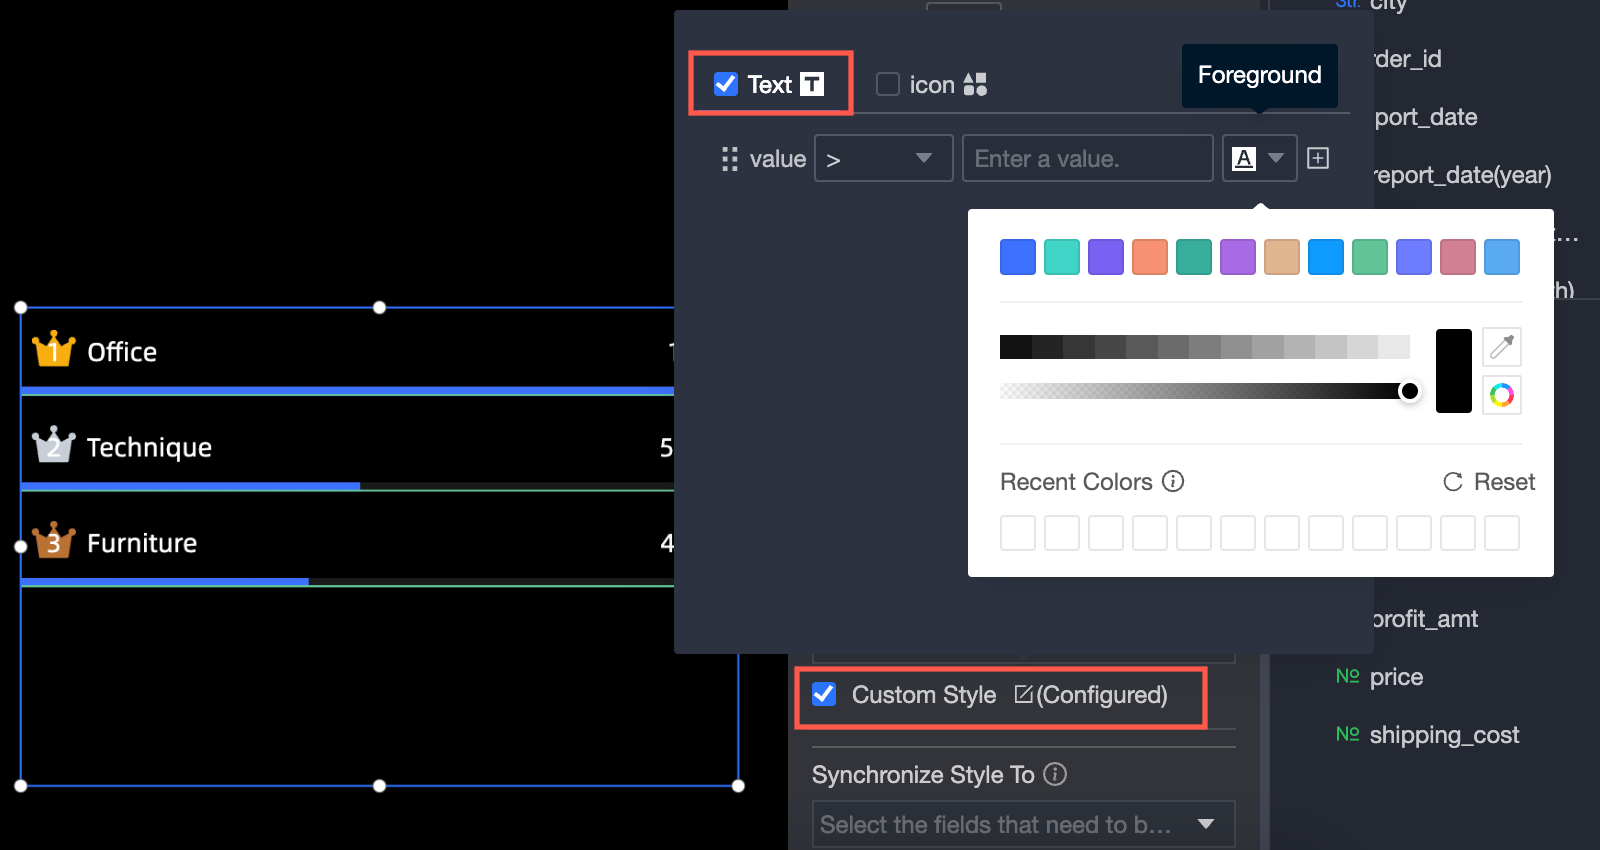
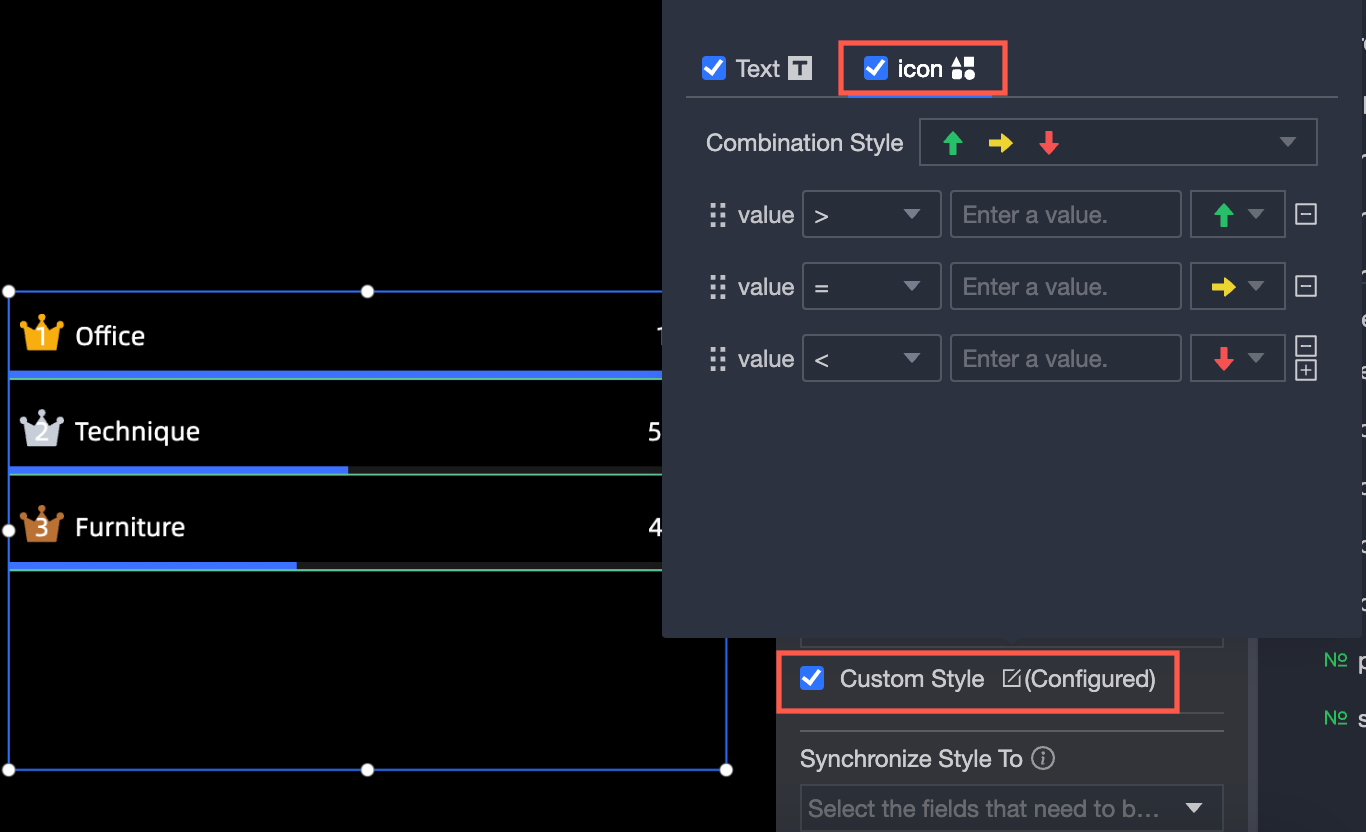
Custom Style: You can customize the text and icon styles. You can also set conditions, mark icons, range values, and font colors.
Custom Text:
Custom Icon:
Sync Style To: synchronizes the current conditional format to other metrics.
