A query control generates one or more query conditions that you can use to query data in one or more charts. You can add multiple query controls to a dashboard, but only one can be pinned to the top.
Prerequisites
A dashboard has been created. For more information, see Create a dashboard and Overview of visualization charts.
Background information
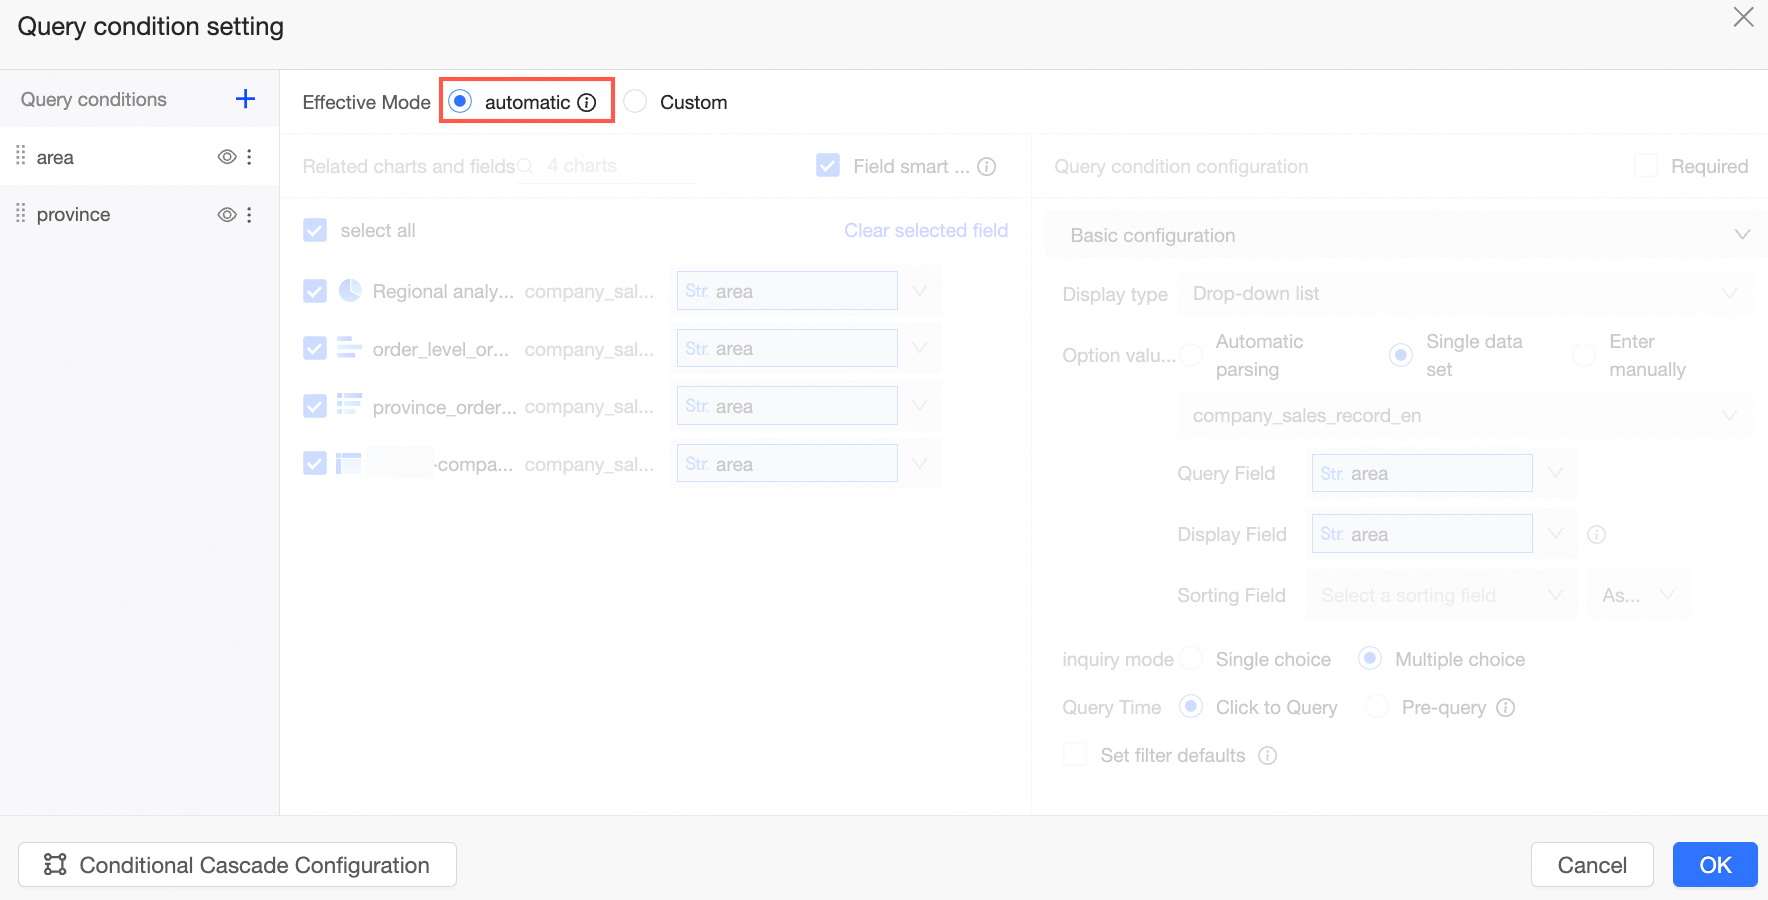
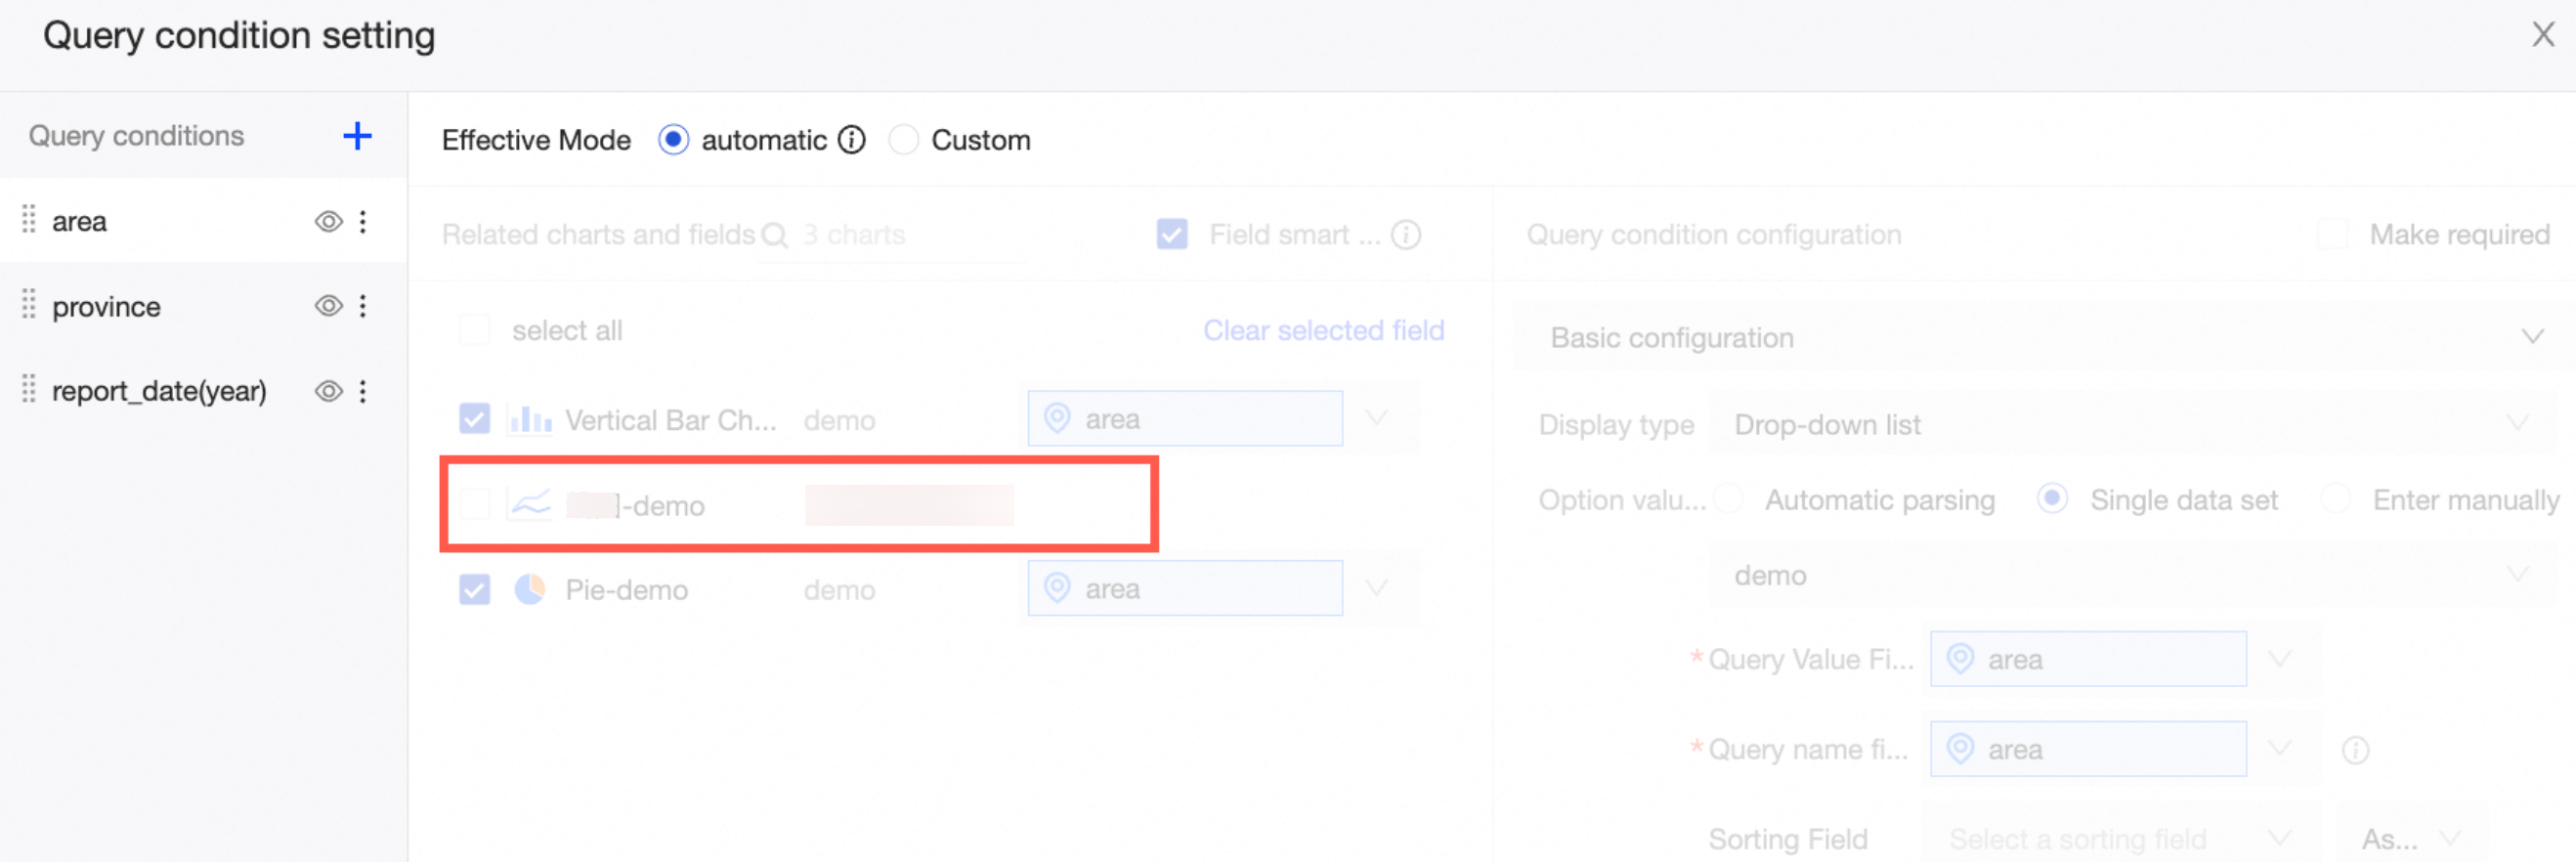
A query condition has two types of Effective Mode:
Automatically generate a query condition by dragging a field.
You can drag a field to a query control to quickly generate a query condition. For more information, see Quickly add query conditions.
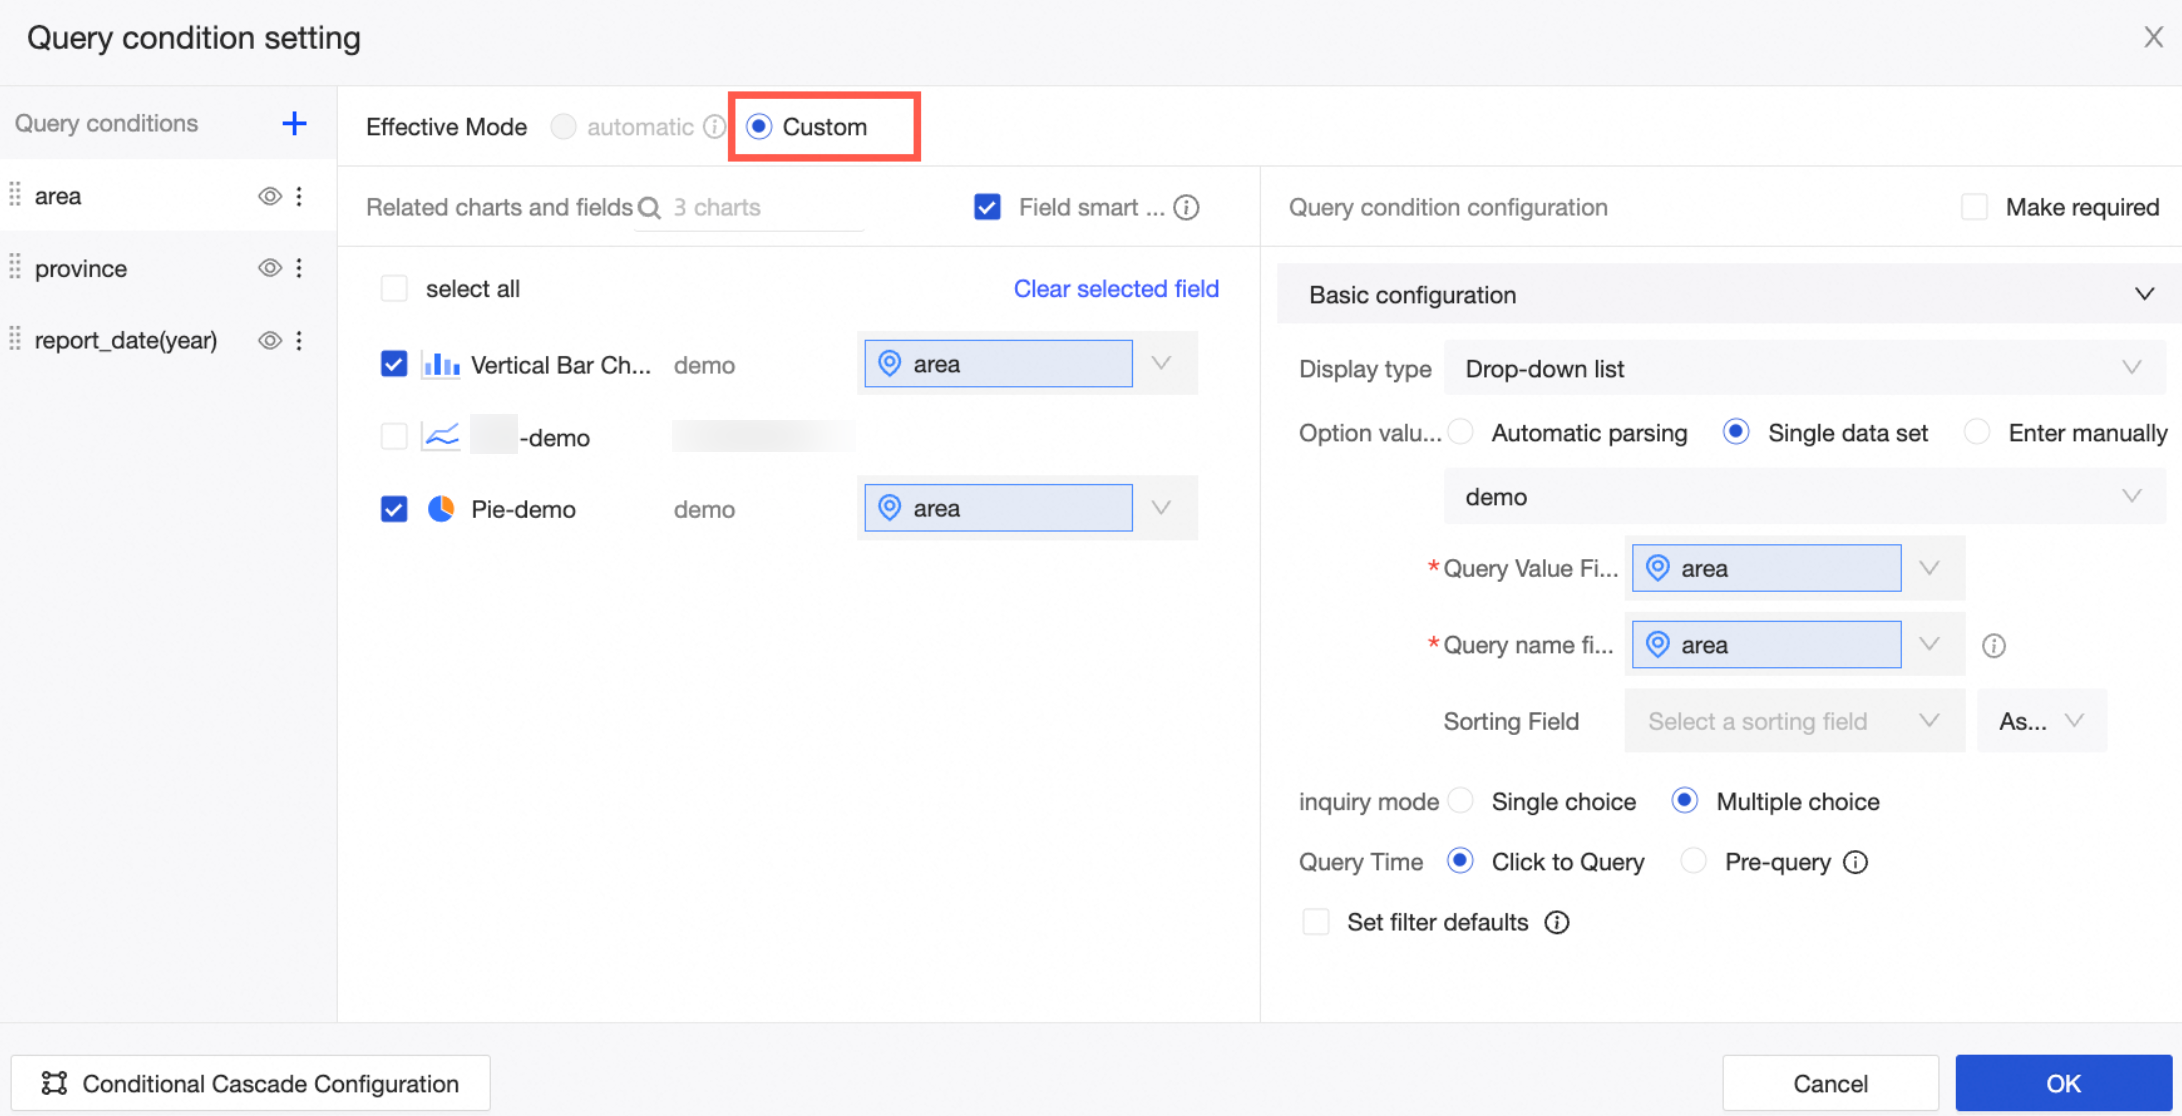
Set a custom query condition for a field.
If an automatically generated query condition does not meet your needs, you can set a custom query condition. For more information, see Set custom query conditions.
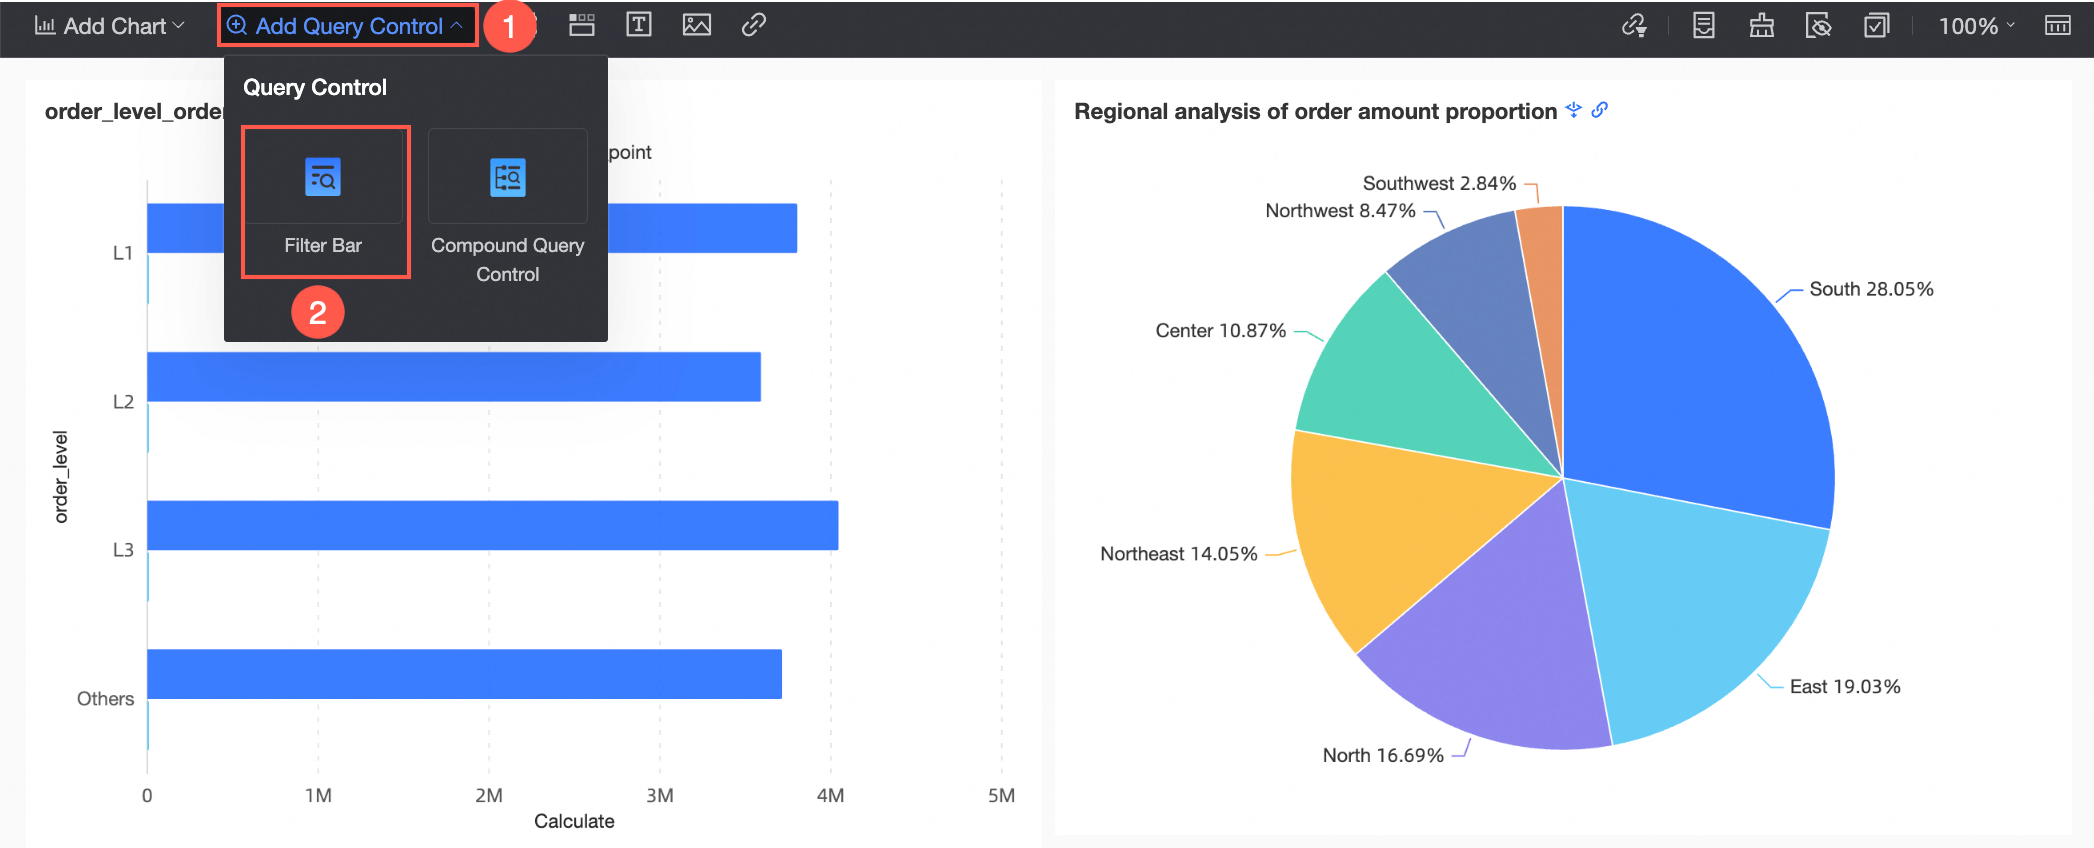
Quickly add query conditions
You can quickly generate a query condition by dragging a field to a query control.
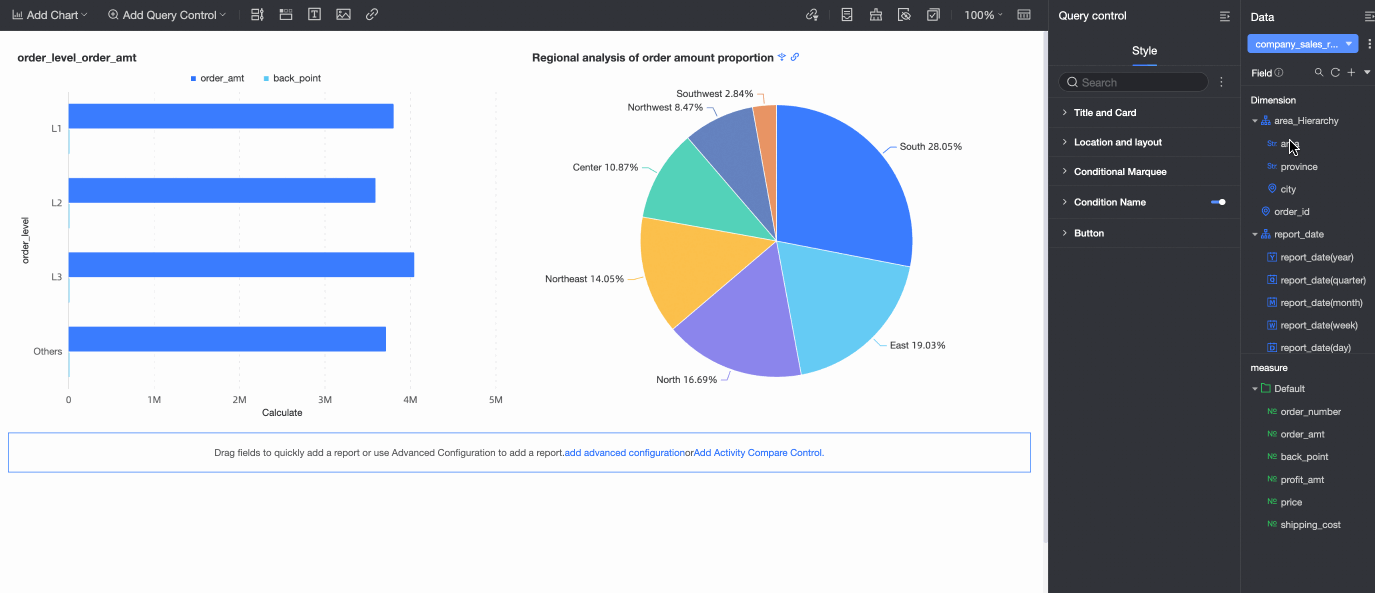
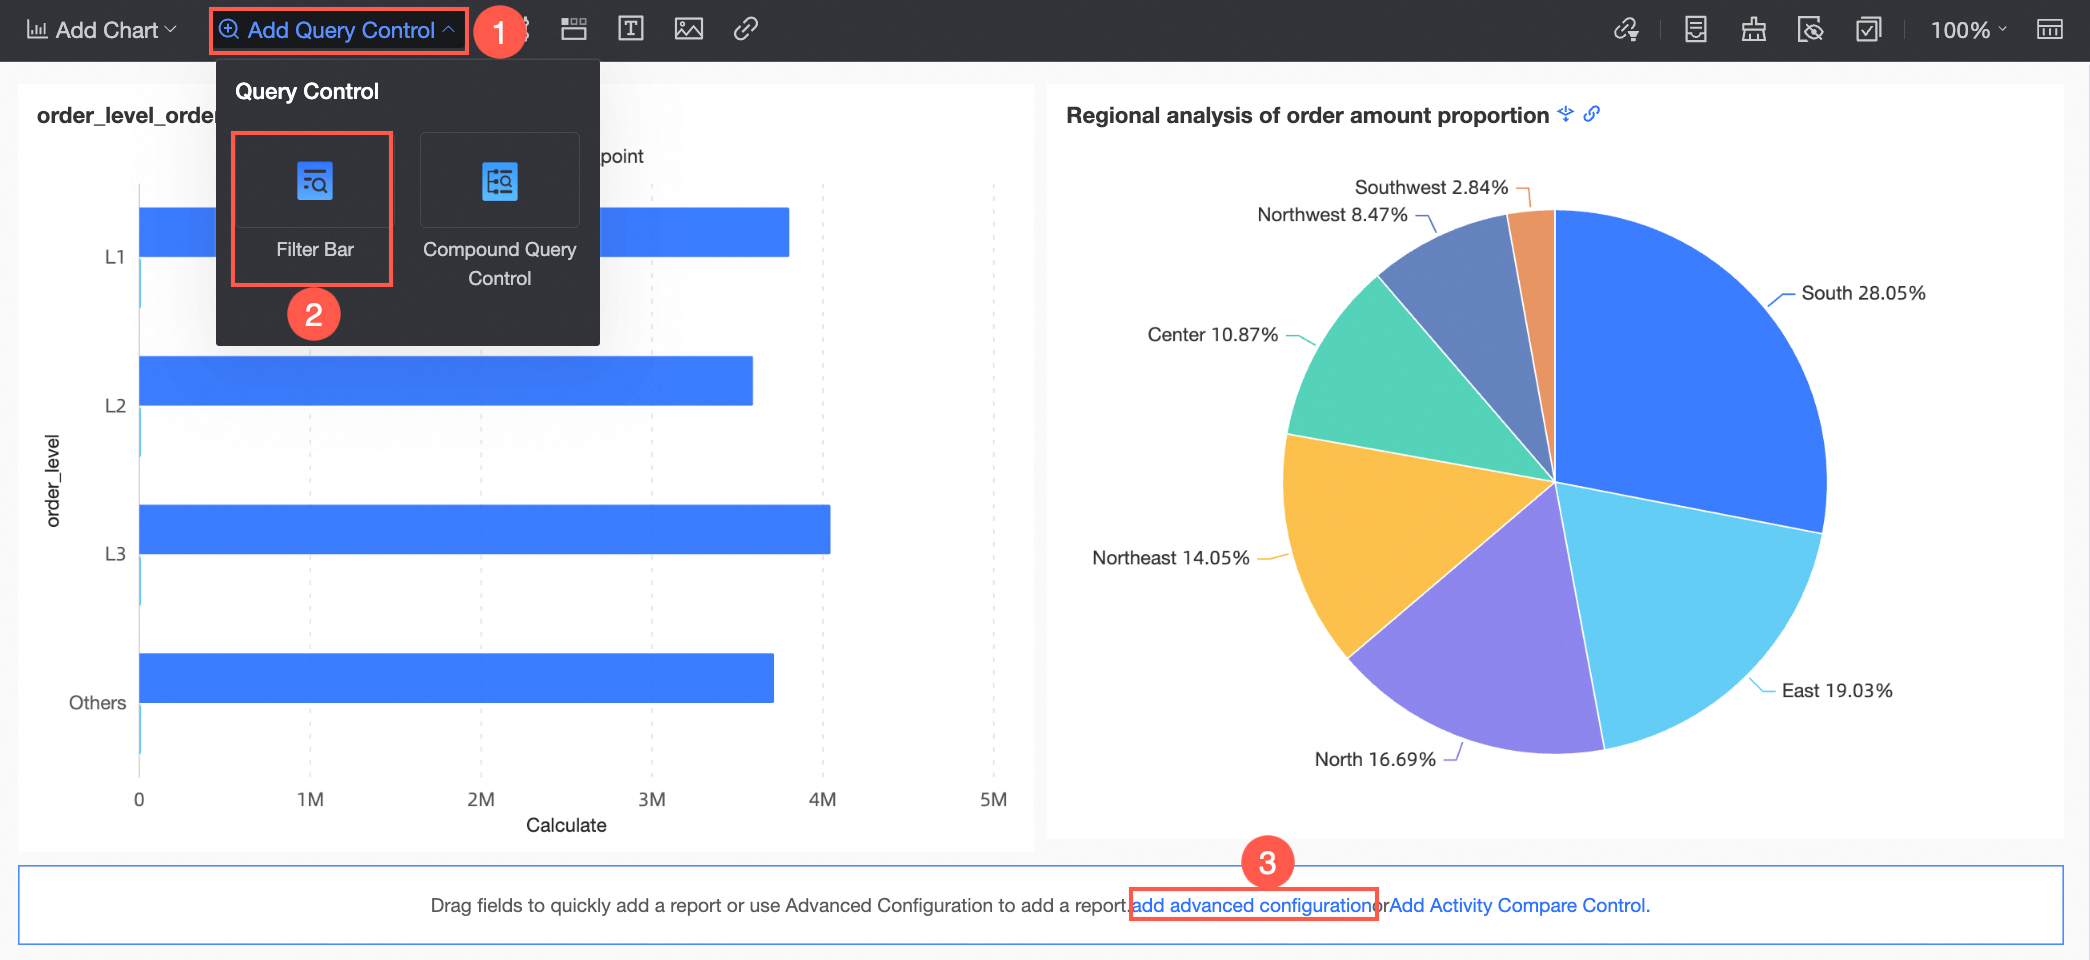
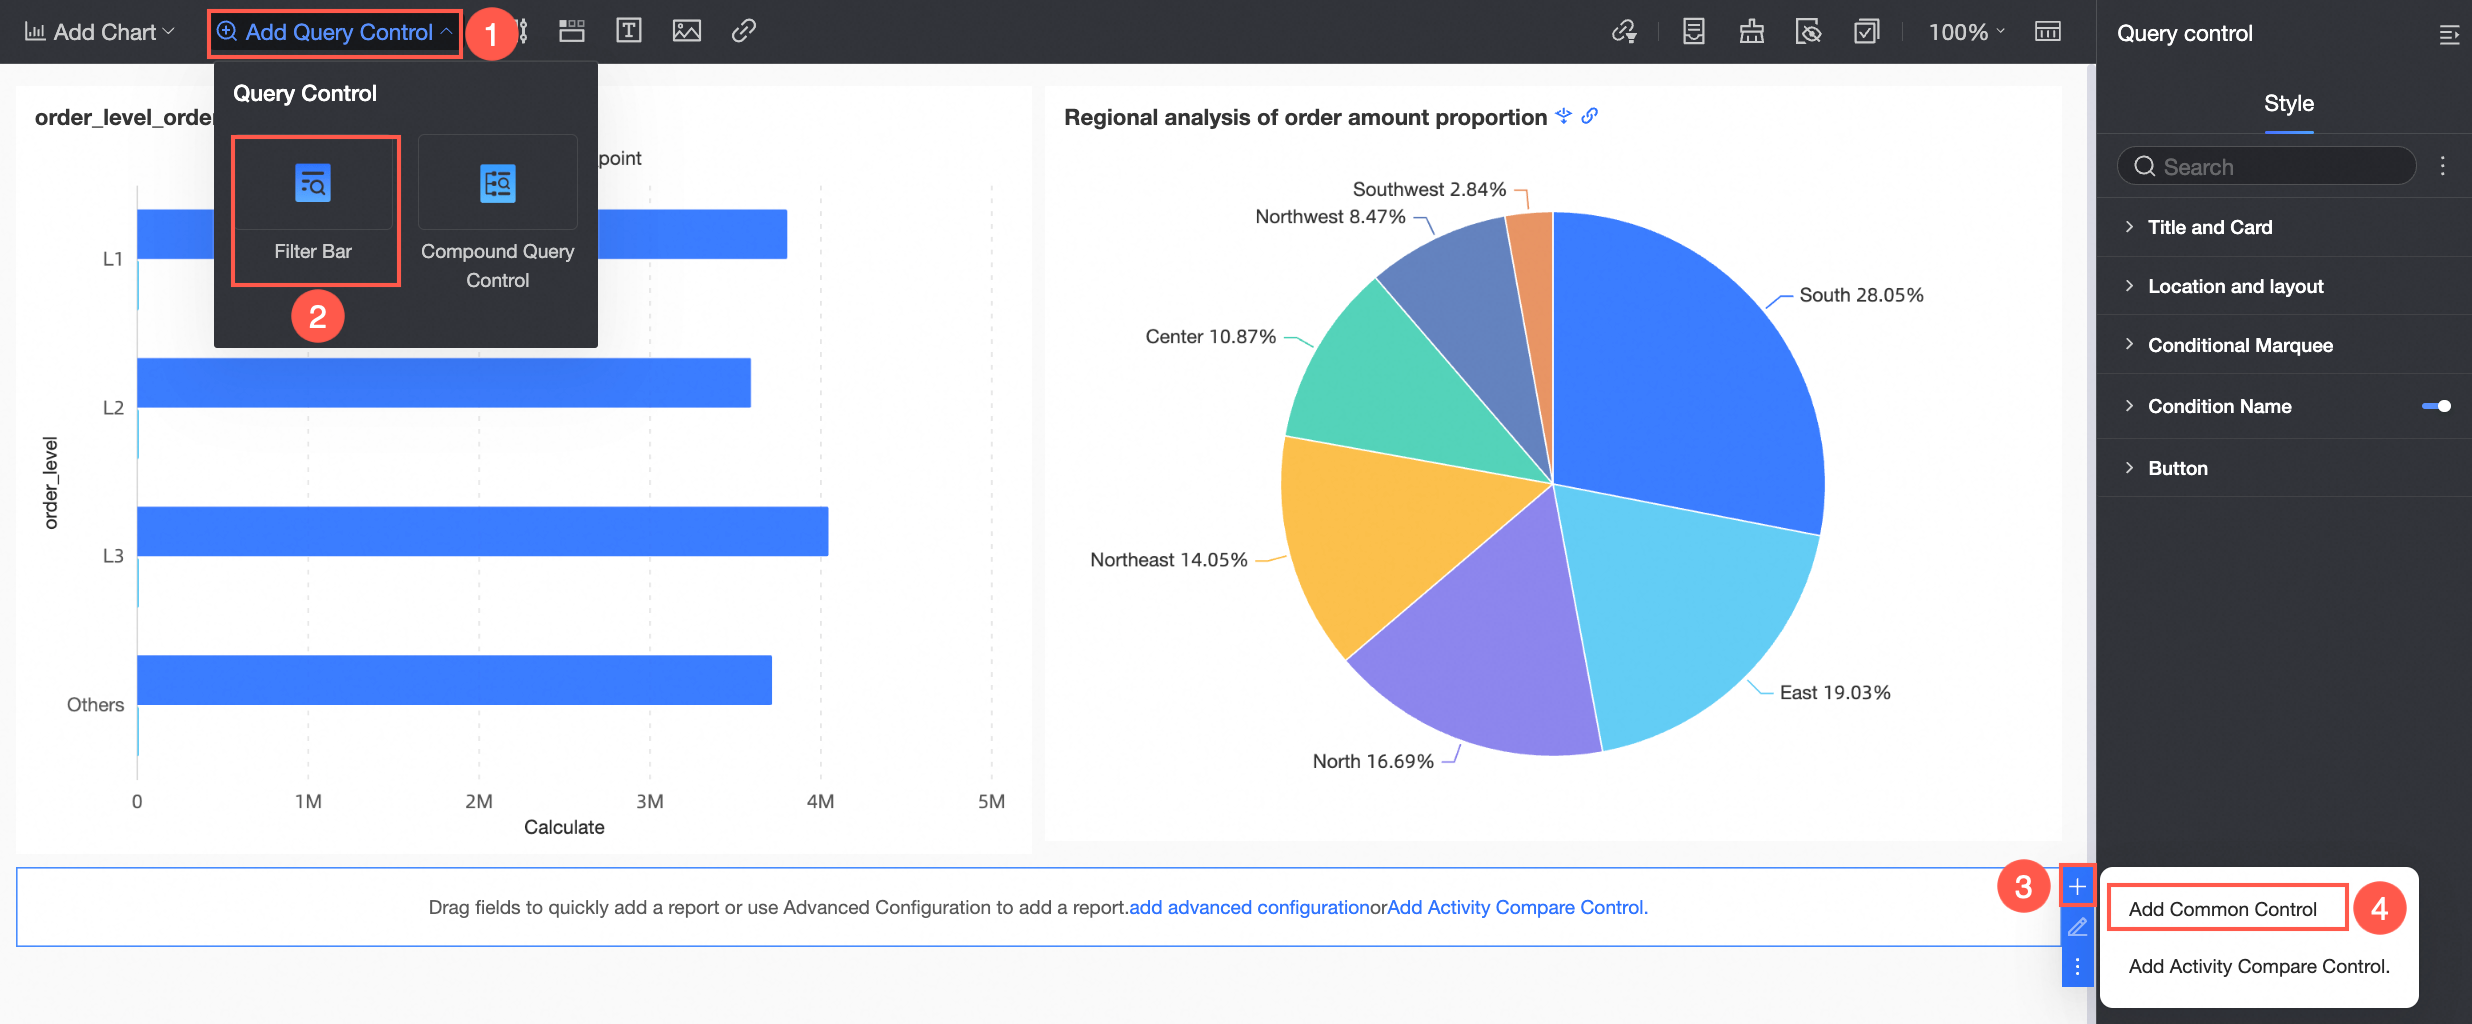
In the dashboard editing area, click Add Query Control in the top menu bar and select a query control from the drop-down list.
From the Data area on the right, drag the target field to the query control.
A query control is generated with a display type that is appropriate for the field type.

If the charts and the query control on the dashboard are from the same dataset, dragging the target field to the query control automatically associates all charts from that dataset. Any new charts that you create from the same dataset are also automatically associated.
If the charts and the query control on the dashboard are from different datasets, dragging the target field to the query control does not automatically associate charts from different datasets.
In this case, you must switch to custom mode to associate charts from different datasets.
For more information about how to configure query conditions, see Configure query control styles.
Select a target value and click Query.
After the configuration is complete, you can modify the style of the query control. For more information, see Configure query control styles.
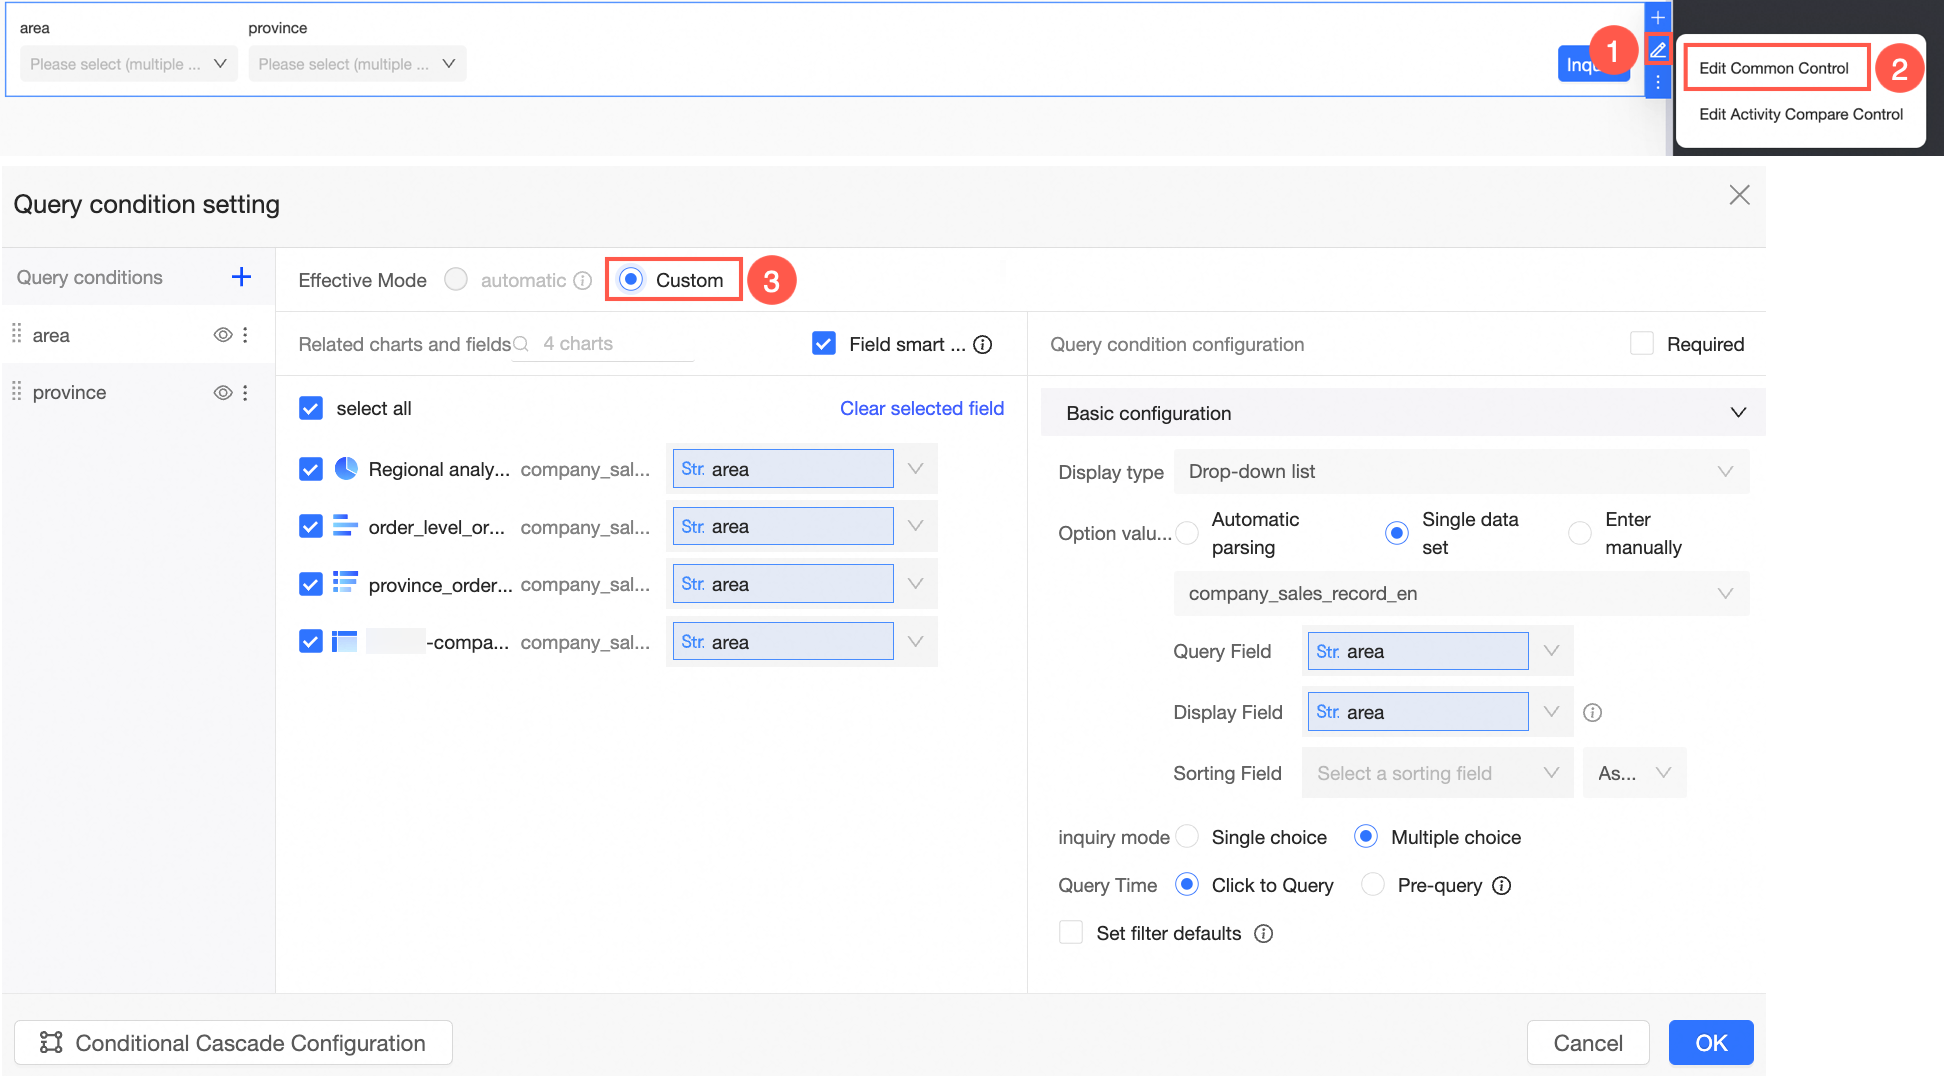
Set custom query conditions
The following example shows how to add a custom query by setting the Effective Mode to Custom.
In the dashboard editing area, click the query control icon in the top menu bar and configure the query control.
Method 1:
Method 2:
Entry point 3:

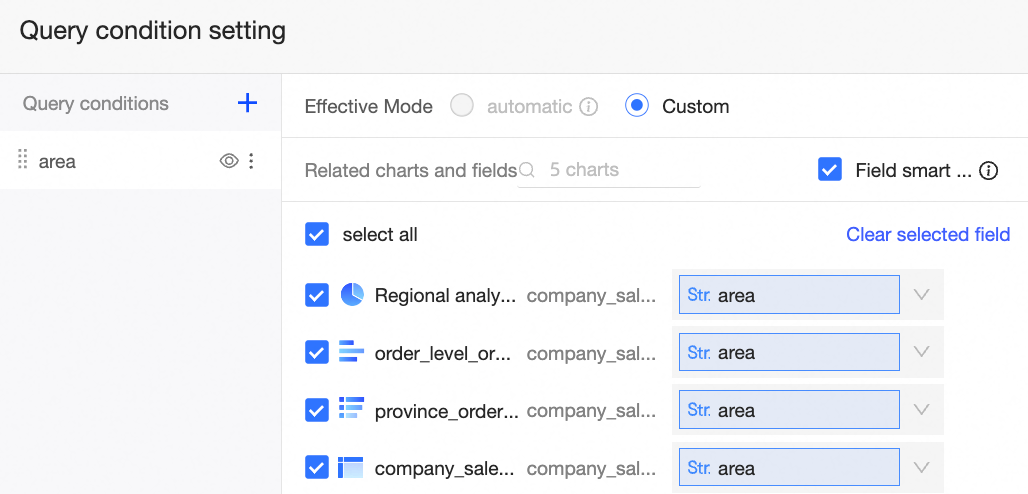
On the Query Condition Settings page, configure the following settings.
Query Criteria
When you click the
 icon in the Filter Condition area, a new filter condition is added with the default name Untitled, which you can then rename.
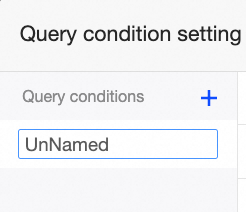 Note
NoteThe name is saved after you enter it and navigate away from the field.
You can click the
 icon to hide a query condition. The configuration is saved, but the condition is no longer displayed on the dashboard.
Click the
 icon to rename or delete the query condition.
Associate Charts and Fields
Select the charts and fields to associate. You can use the smart field selection feature to automatically populate the foreign key fields for selected charts from the same dataset. If there are too many charts, you can use the filter feature to select the charts you need.
If the associated chart uses a dataset combination, the foreign key field can apply to both the primary and secondary datasets.
If you select a foreign key field from a dataset combination, the following message appears:

If you select "Yes", fields that match this foreign key field are also selected. The query control then applies to both the primary and secondary datasets. If you select "No", the query control applies only to the currently selected field.
If you select a placeholder, and other sub-datasets contain a placeholder with the same name, the following message appears:
 If you select "Yes", placeholders with the same name in other sub-datasets are also selected. The query control then applies to both the primary and secondary datasets. If you select "No", the query control applies only to the currently selected placeholder.
You can also manually select and associate multiple fields of the same type that have different names.

NoteYou can select only one field or one placeholder from each sub-dataset.
If you select multiple fields from a dataset combination, only basic query features are supported. Advanced features, such as synchronized time granularity changes, are not supported.
If you select multiple fields from a dataset combination, you cannot set the display type to Tree Drop-down.
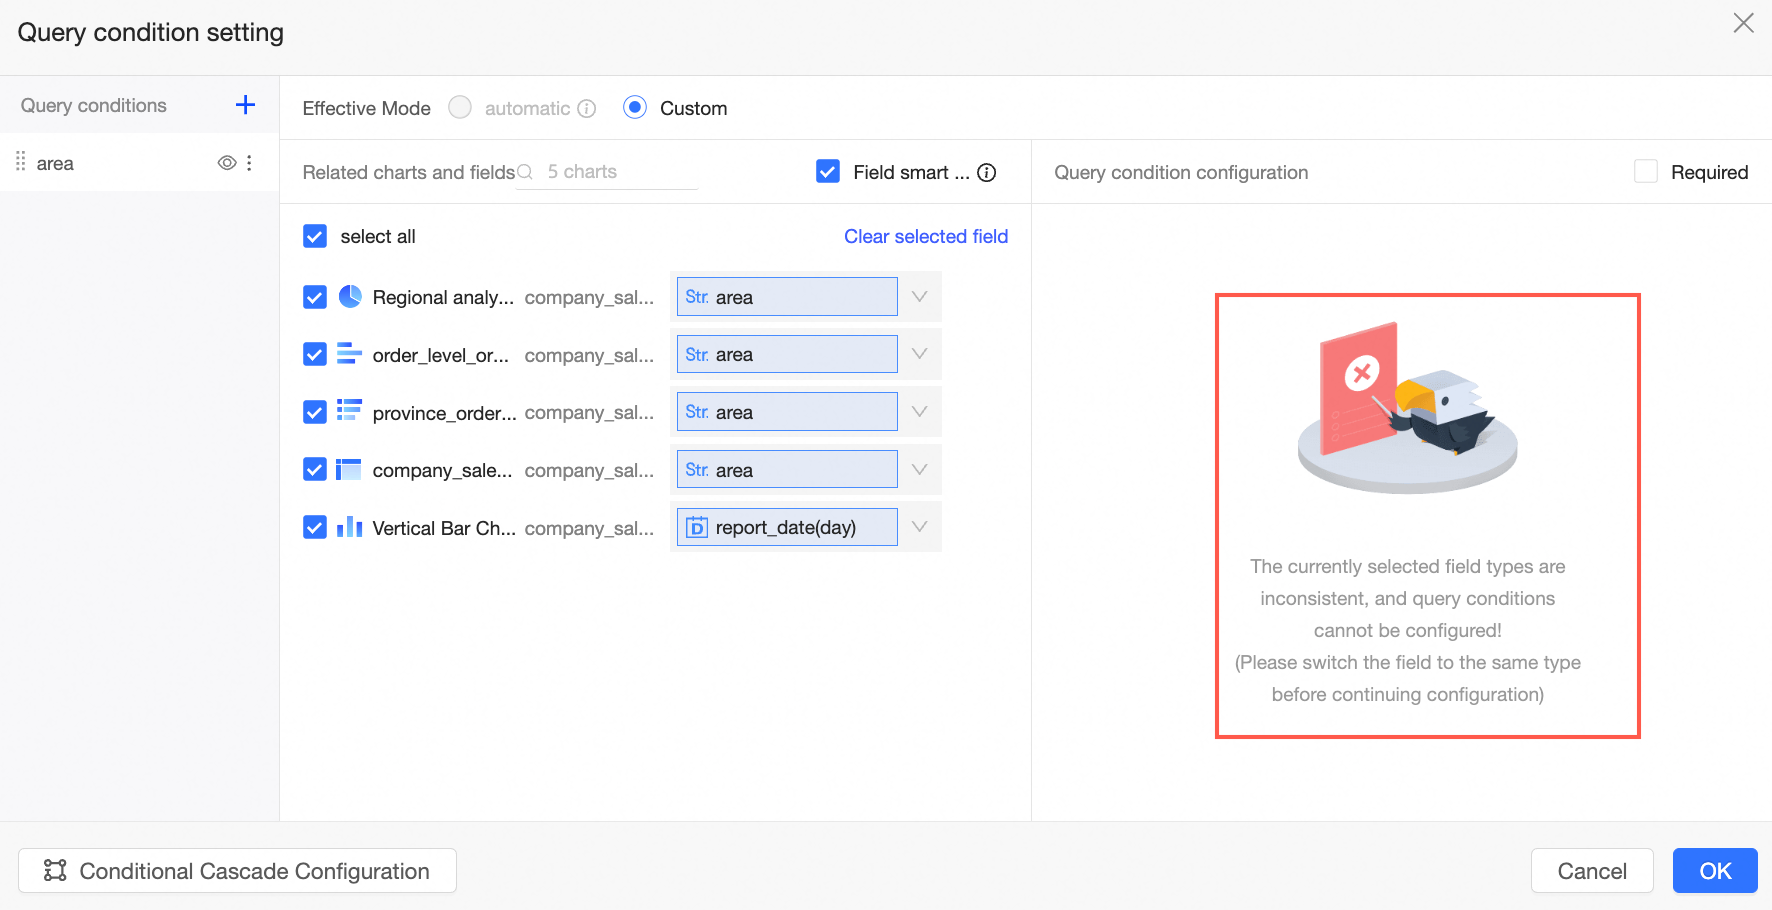
You cannot associate fields of different types at the same time. For example, if you try to associate a date field and a numeric field, the following message appears.
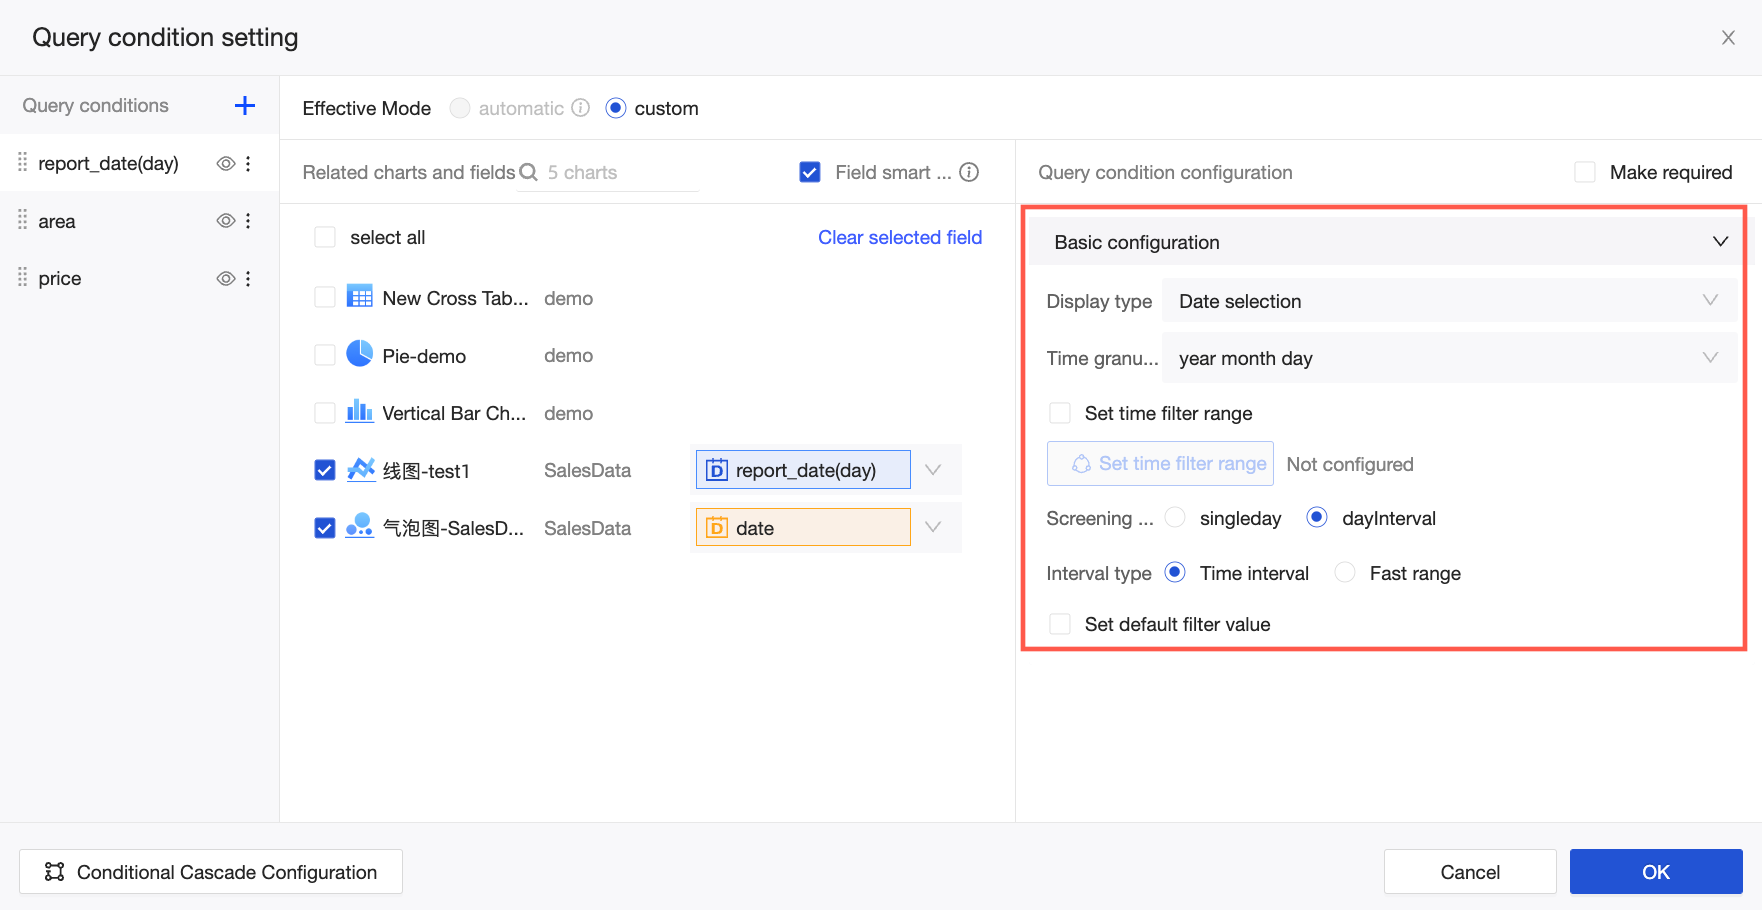
Query Condition Configuration
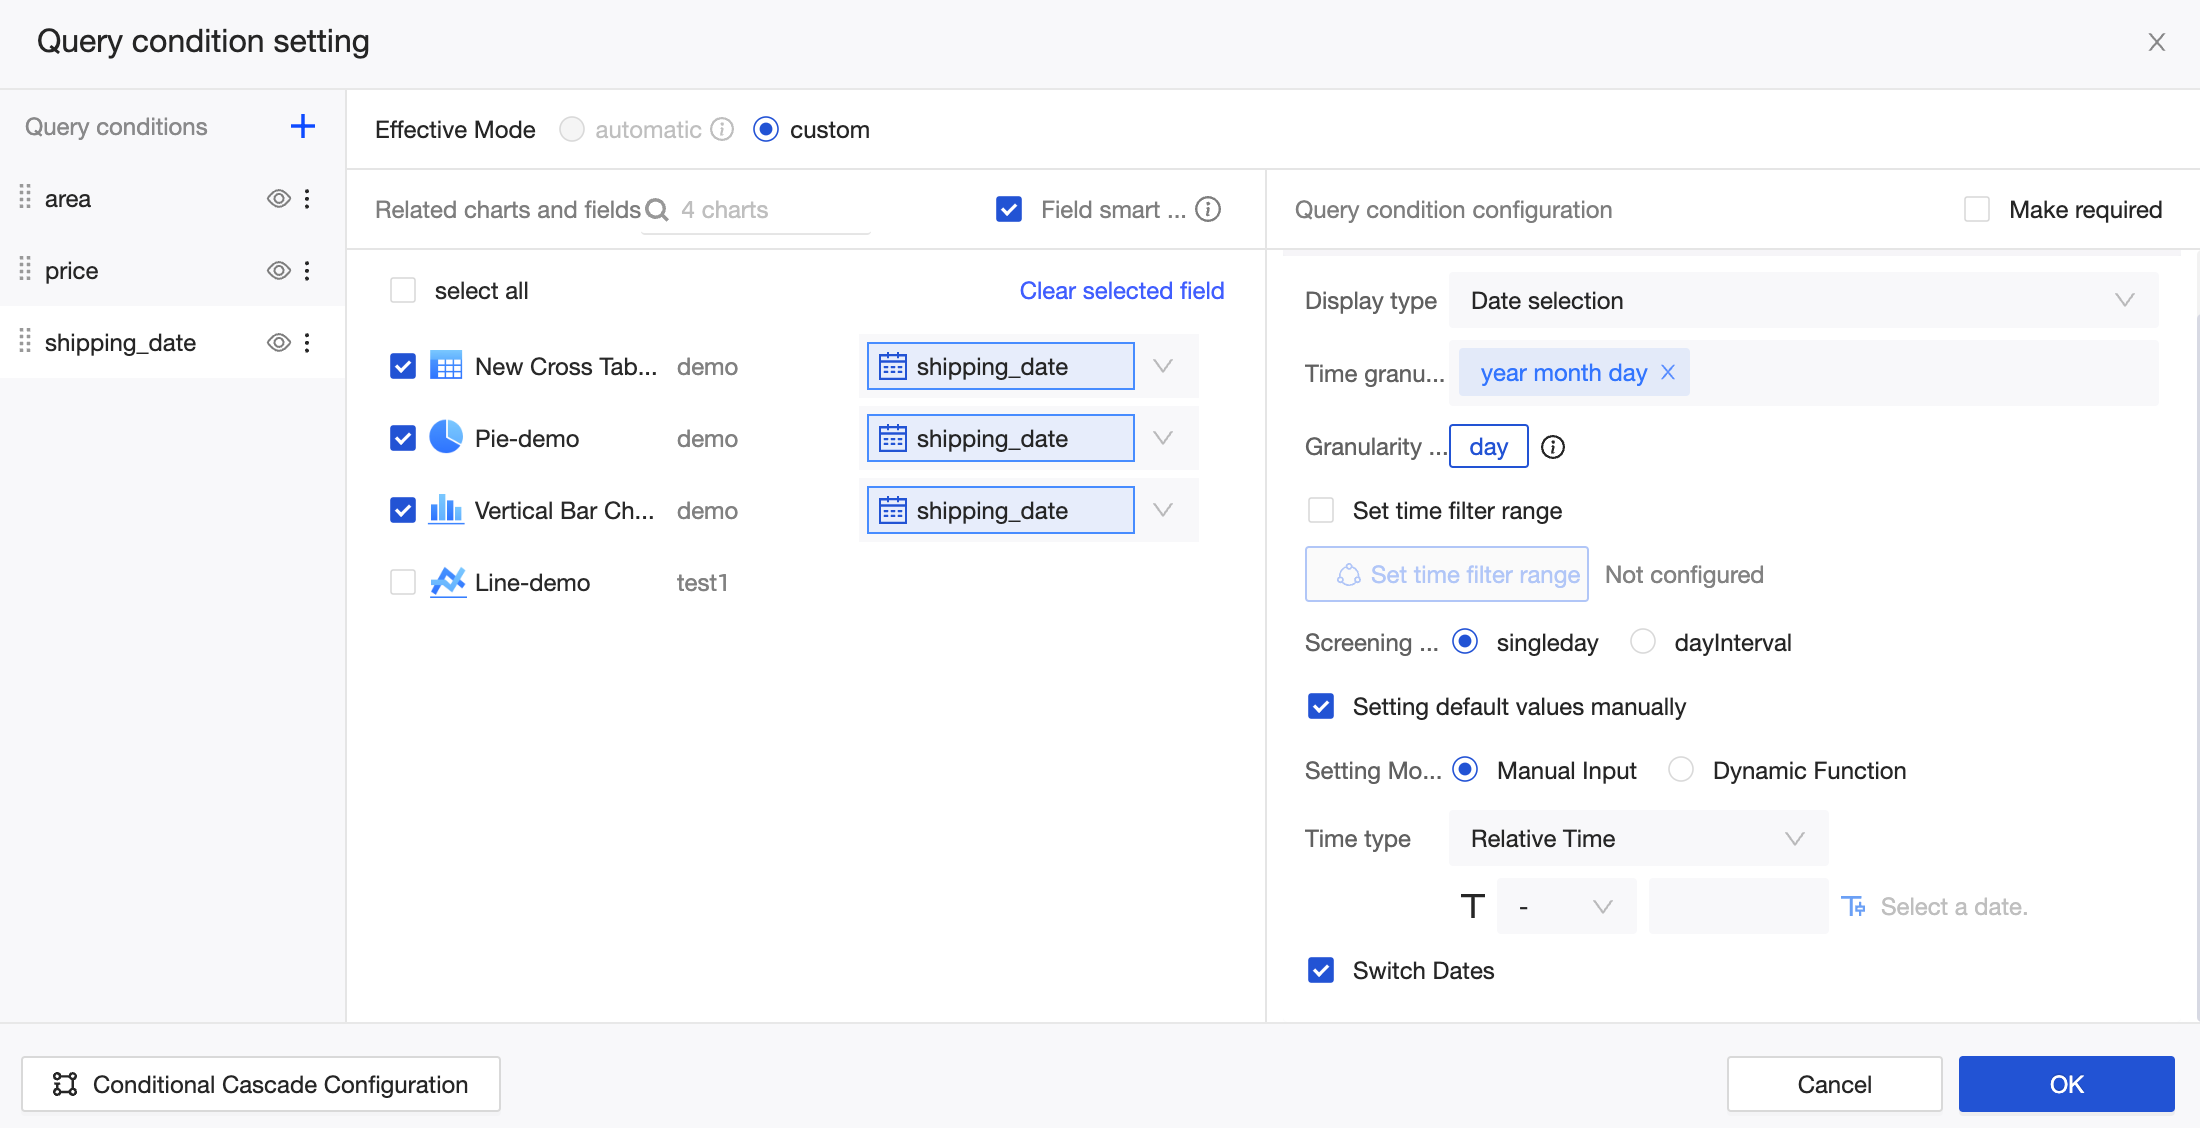
The configuration options for a query condition vary based on the associated field type. The following figure shows the configuration for a date field with a Year time granularity. For more information about other configuration types, see Query type configuration display.
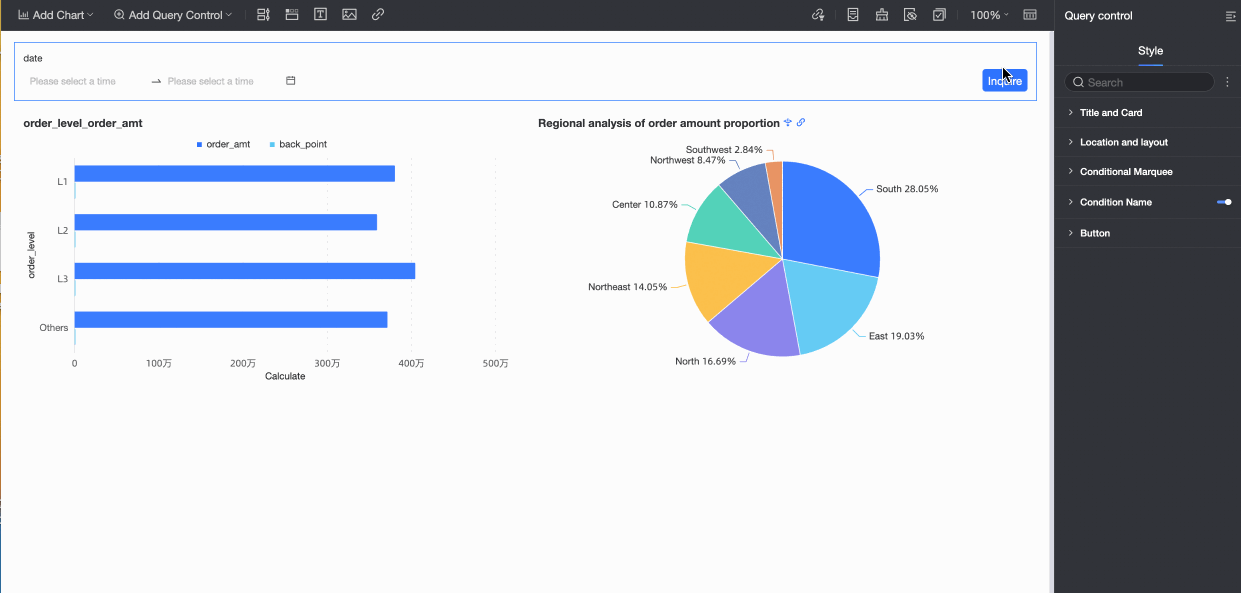
When the Quick Date Switch feature is enabled, an arrow appears on the date control on the report page. You can click the arrow to quickly switch between years, as shown in the following figure.
Conditional Cascade Configuration
For more information, see Configure query control cascade.
Configure query condition groups
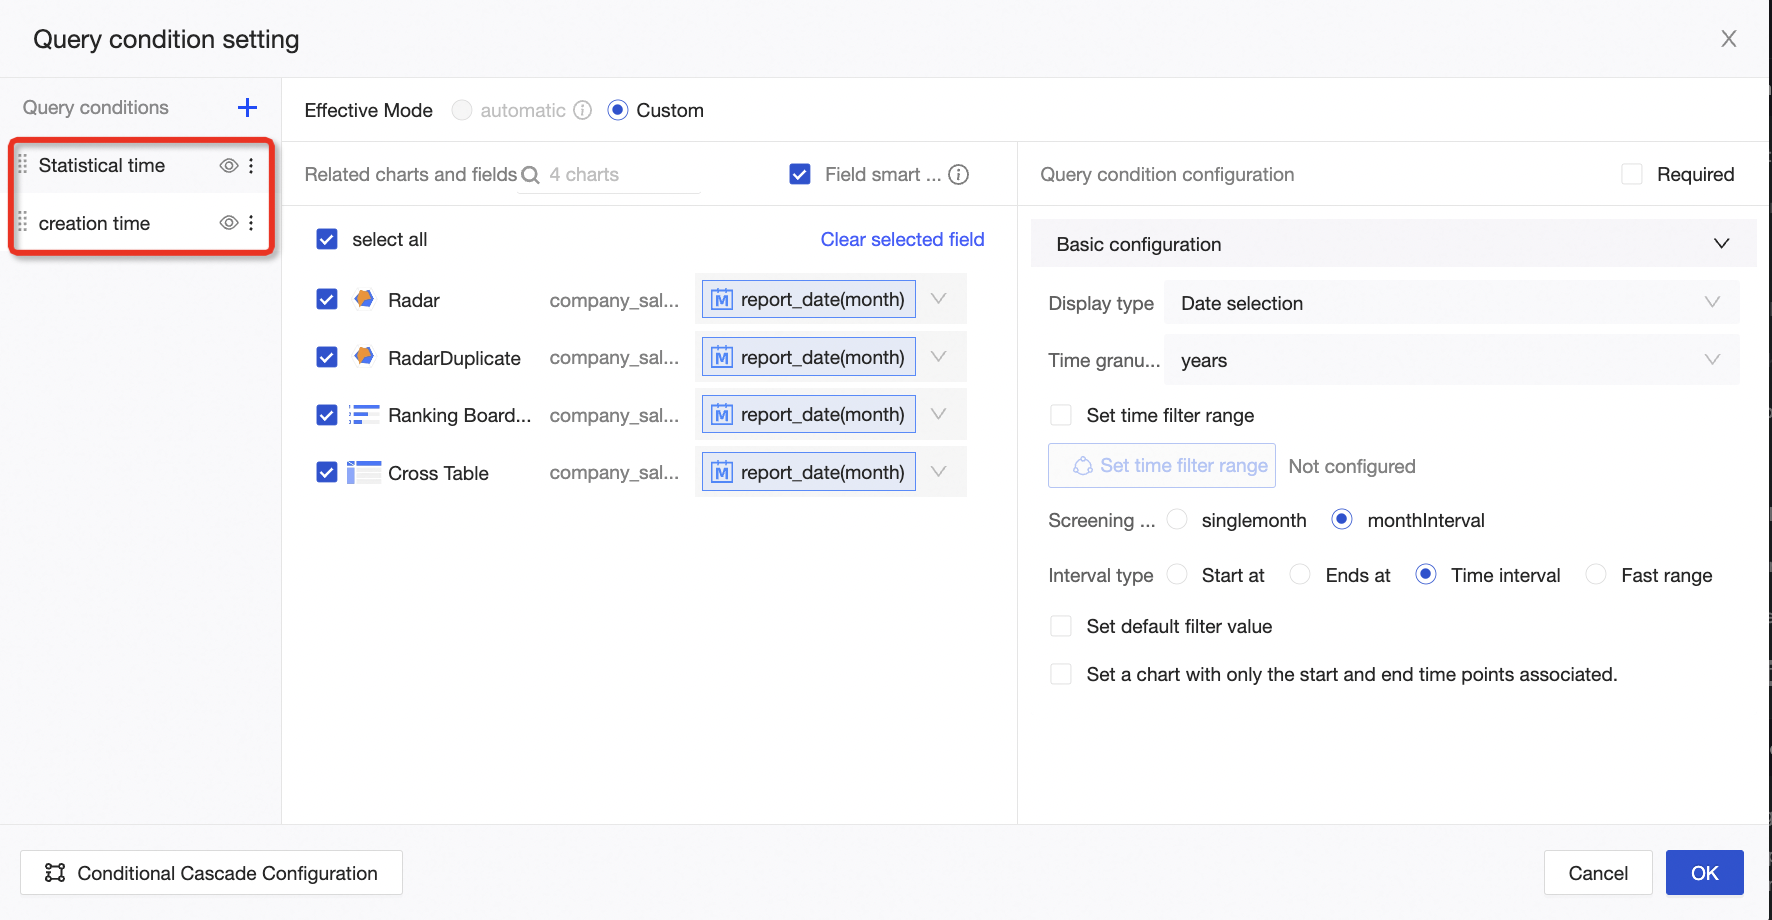
If you add multiple query controls of the same type, such as the Statistics Time and Creation Time date controls, you can group them by configuring a condition group. Then, you can use the switch feature to select which control to apply.
Procedure
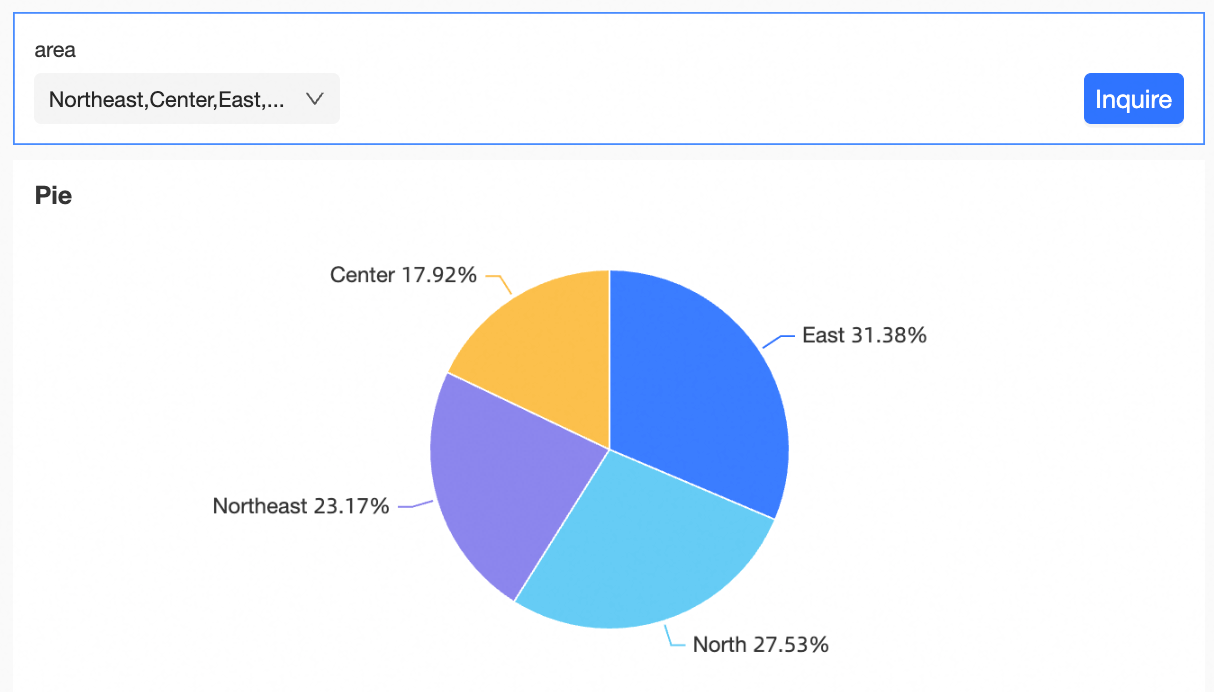
Assume you have configured the Statistics Time and Creation Time date selection controls as described in the previous sections. The following figure shows the result.
On the left side of the pane, next to Query Condition, click the
 icon and select Condition Group from the drop-down list.
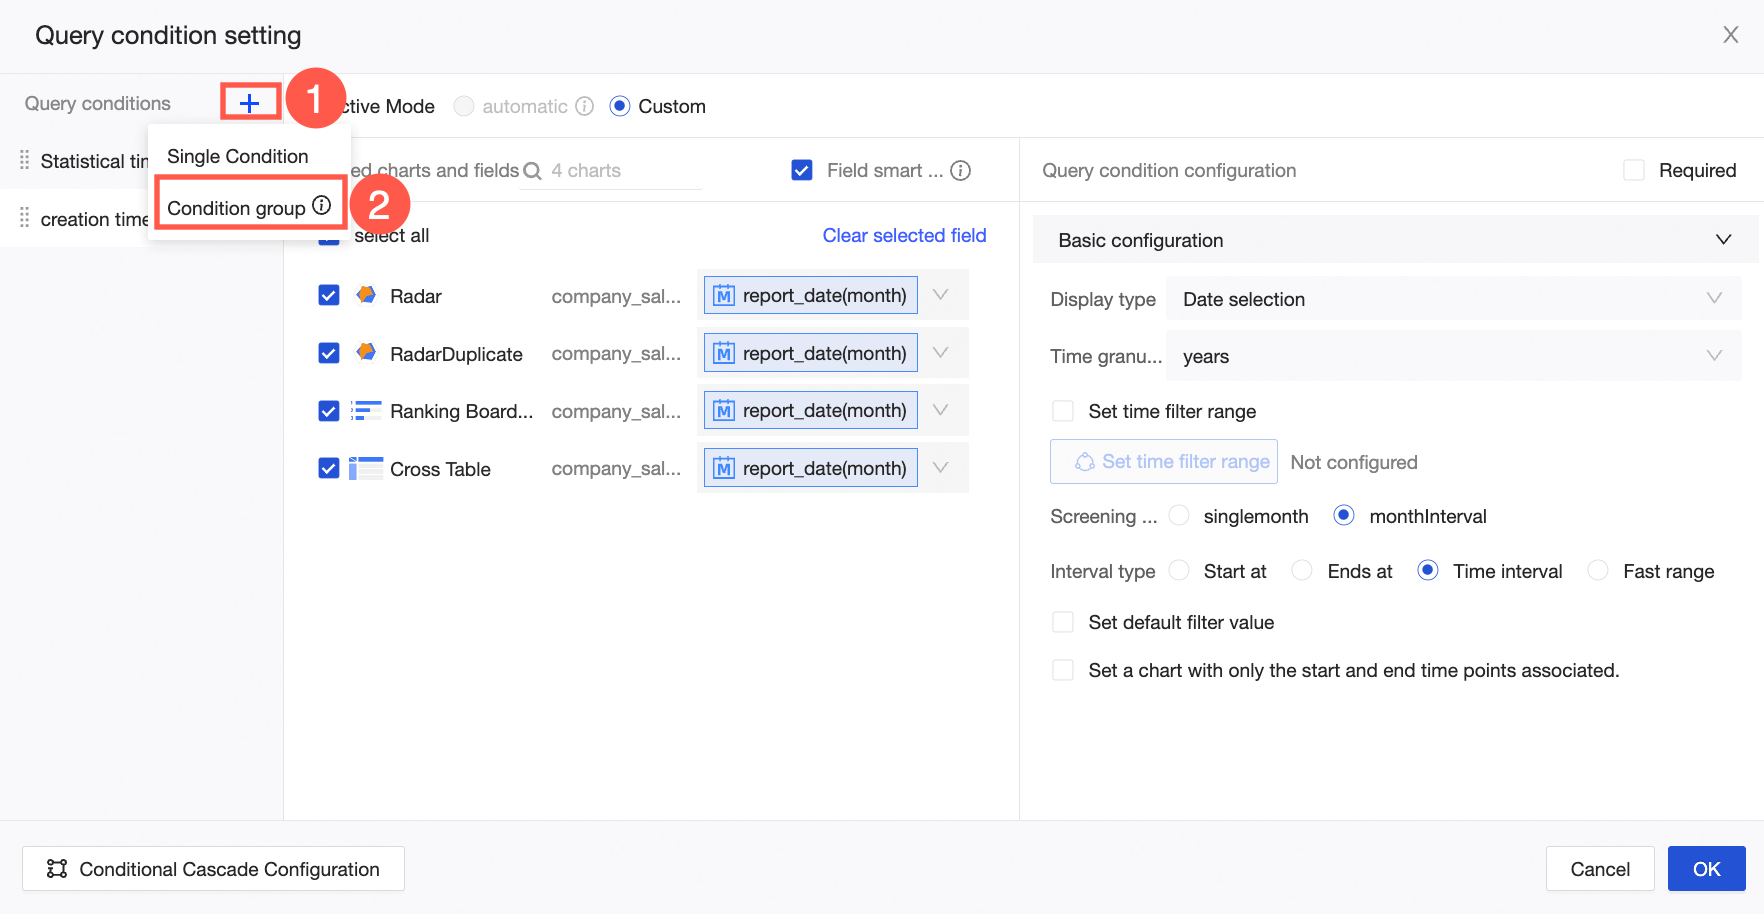 Note
NoteAfter you add a condition group, you can drag individual conditions into the group.
Only one condition in a condition group can be active at a time. By default, the first condition is active. You can switch the active condition within the report. Inactive conditions do not take effect, even if they have a default value or receive a global parameter.
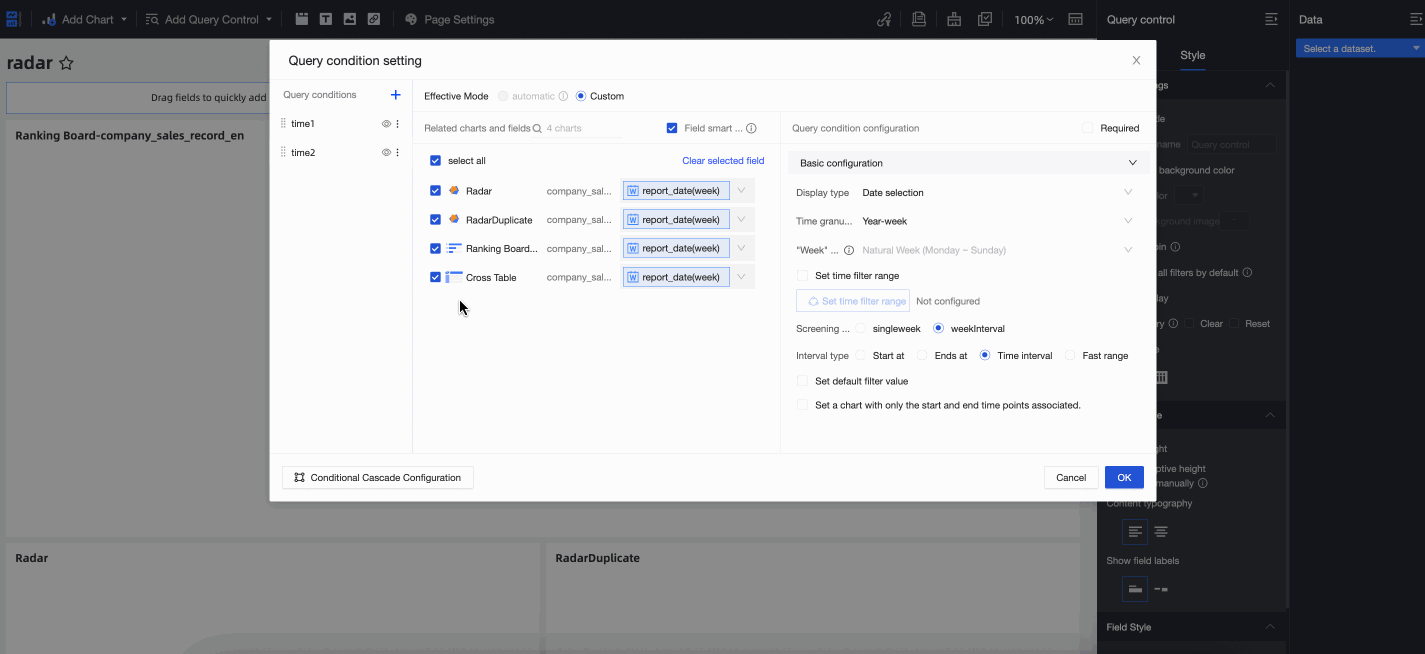
You can assign a custom name to the condition group, such as Time Query. After you name the group, drag the Statistics Time and Creation Time conditions into the Time Query condition group to complete the configuration. The following figure shows the result.
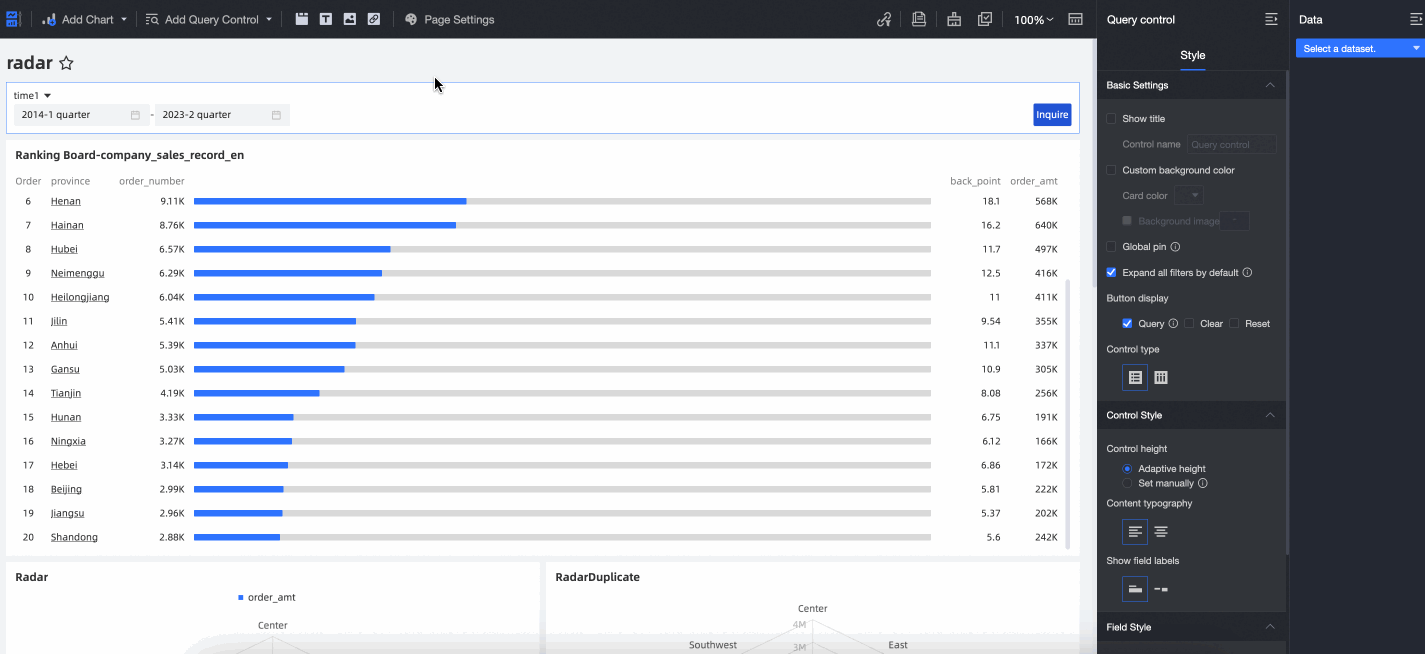
Configuration effect
After the configuration is complete, the first condition in the Time Query condition group, Creation Time, is active by default. You can switch to the Statistics Time condition to run queries.
Query type configuration display
A query control can be applied to parameters, placeholders, and regular fields of the same type.
This section describes the configurations for the following display types.
Date Selection
When you associate a date field, the query control automatically suggests Date Selection as the display type and a time granularity based on the granularity of the associated date field. Supported time granularities include Year, Year-quarter, Year-month, Year-week, Year-month-day, Year-month-day-hour-minute-second, Hour, Hour-minute, and Hour-minute-second.
In this example, Time Granularity is set to Year. For the Year Range filter method, the available range types are Starts With, Ends With, Time Range, and Quick Range.
When using a range filter, the Starts With and Ends With range types allow you to run queries without specifying both a start and an end time.
You can customize quick ranges for different time granularities. The following table shows the mappings.
Time granularity
Quick range
Year
Last year
This year
Based on yesterday (not including today)
This year (based on yesterday)
Year-quarter
This quarter
Last quarter
Based on yesterday (not including today)
This quarter (based on yesterday)
This year (based on yesterday)
Year-month
This month
Last month
Last 3 months
Last 6 months
Last 12 months
First half of this year
Second half of this year
Year to last month
Year to this month
Based on yesterday (not including today)
This month (based on yesterday)
This quarter (based on yesterday)
This year (based on yesterday)
Year-week
This week
Last week
Based on yesterday (not including today)
This week (based on yesterday)
This month (based on yesterday)
This quarter (based on yesterday)
This year (based on yesterday)
Year-month-day
Today
Yesterday
The day before yesterday
Year to date
Month to date
Recent
Last 7 days
Last 15 days
Last 30 days
Last 60 days
Last 90 days
Last 180 days
Last 365 days
Recent (not including today)
Last 3 days
Last 7 days
Last 15 days
Last 30 days
Last 60 days
Current period
This week
This month
This quarter
This year
Current period (not including today)
This week
This month
This quarter
This year
Previous period
Last week
Last month
Last quarter
Last year
Recent day of the week
Recent Monday
Recent Tuesday
Recent Wednesday
Recent Thursday
Recent Friday
Recent Saturday
Recent Sunday
Other
First day of this month
First day of this year
First day of last month
Last day of last month
Hour, Hour-minute, Hour-minute-second
The quick range feature is not supported.
For more information about date queries, see Date query.
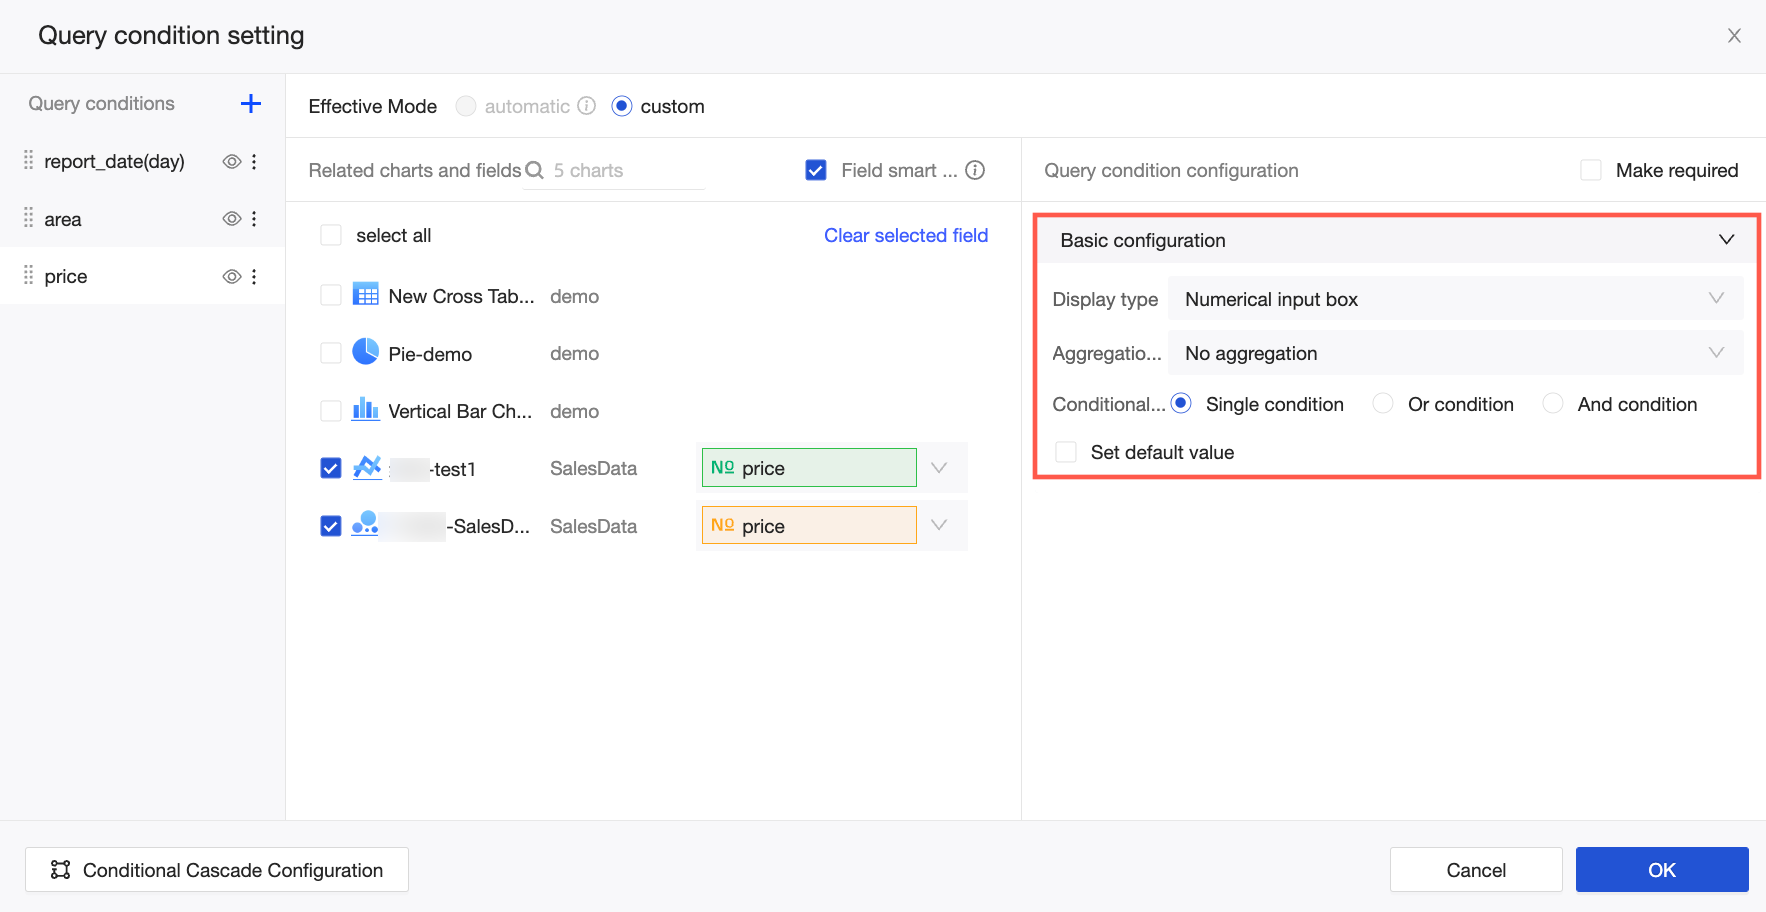
Numeric Input Box
If the associated field is a measure, you can select an aggregation method in the query control. The default method is Sum. You can also select No Aggregation or other aggregation methods.
NoteThe aggregate query control does not support querying detailed data. The conditional query supports different formats, such as a single condition or a combination of AND/OR conditions. To restrict report viewers to a specific condition, such as the Equals condition, select Lock Filter Conditions.
For more information about numeric queries, see Numeric query.
Text Box
As with a numeric input box, you can set the Conditional Form for a text box to Single Condition, OR Condition, or AND Condition.
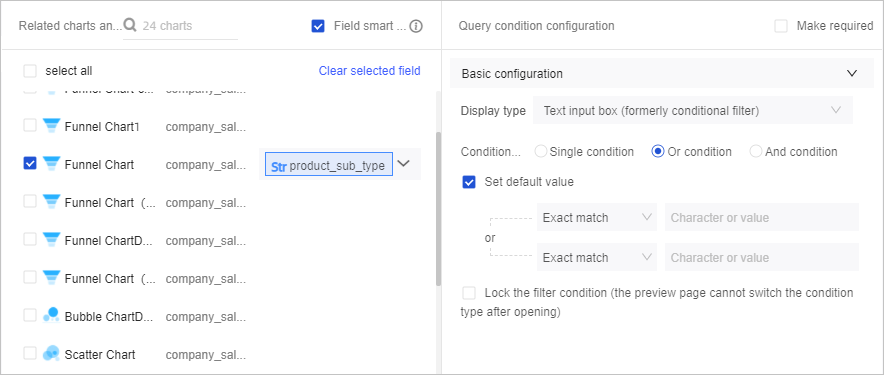
When you set a default value for the product_sub_type field, the following rules and SQL syntax apply:
Rule
SQL syntax
Exact match
product_sub_type='ruler'
Does not match
product_sub_type!='ruler'
Contains
product_sub_type like '%ruler%'
Does not contain
product_sub_type not like '%ruler%'
Starts with
product_sub_type like 'ruler%'
Ends with
product_sub_type like '%ruler'
Is null
product_sub_type is null
Is not null
product_sub_type is not null
No content
product_sub_type=''
Is not empty string
product_sub_type!=''
For more information about text query controls, see Text Query Control.
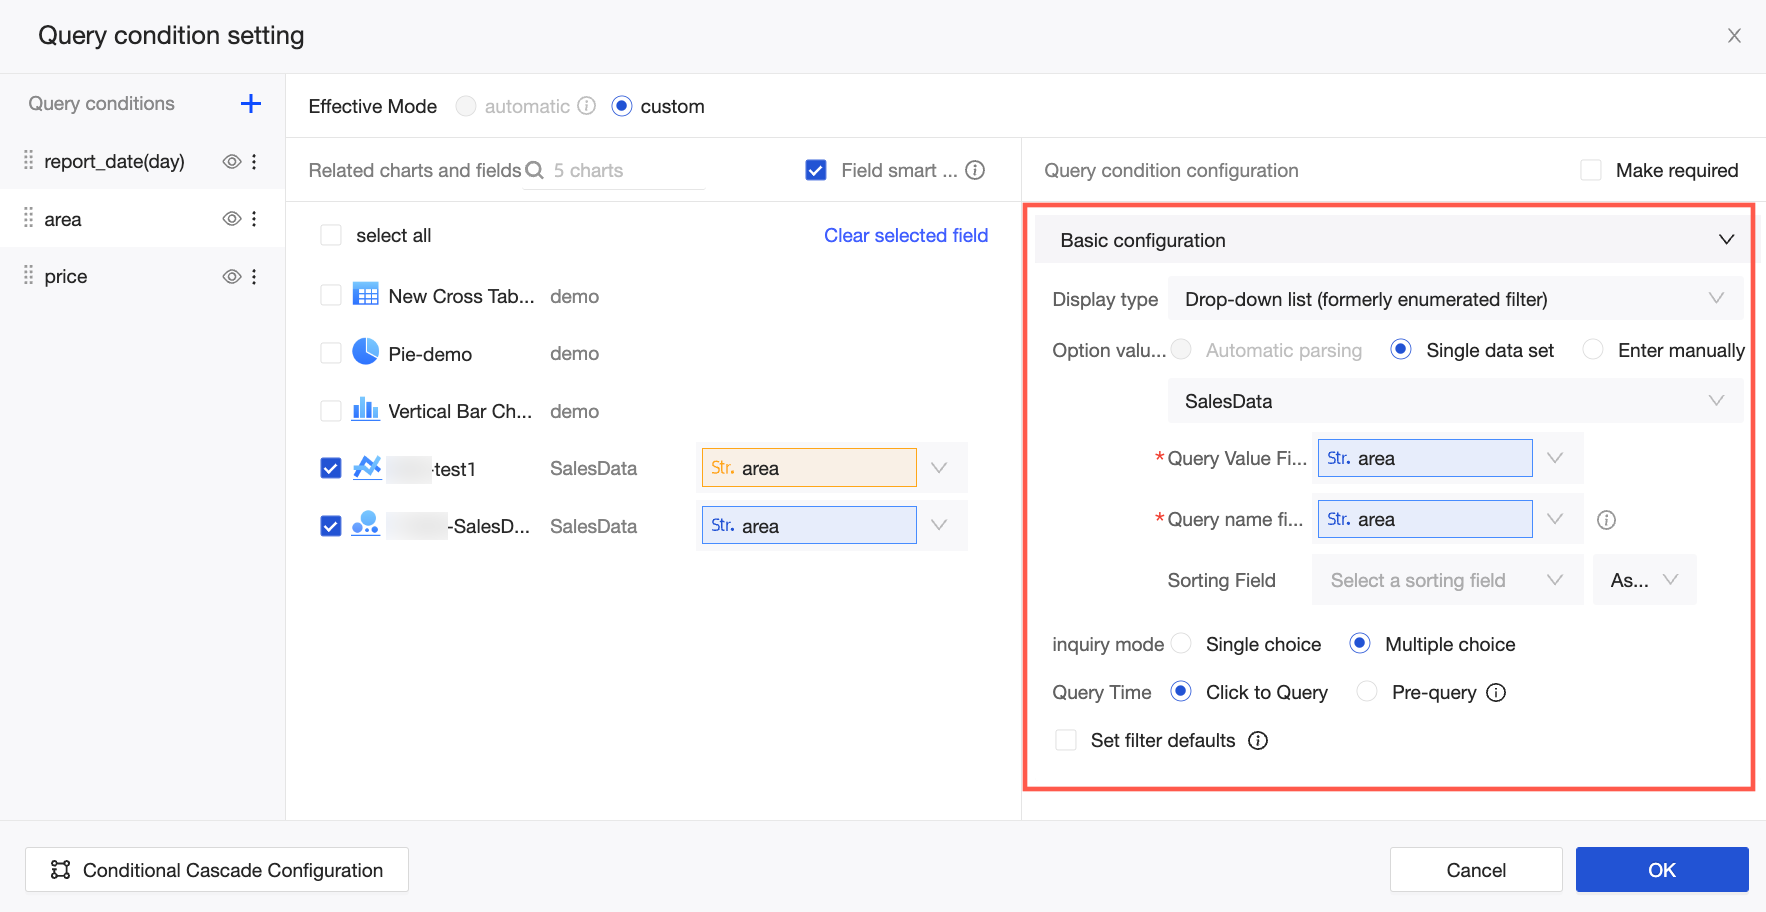
Drop-down List (formerly Enumeration Filter)
When the display type is Drop-down List (formerly Enumeration Filter), the Option Value Source provides the filter values for the query condition field using one of the following methods: Automatic Parsing, Single Dataset, or Manual Input.
When the option value source is set to Automatic Parsing, the system parses the set of values for the selected field in the associated chart area. The interface displays a maximum of 1,000 values.
If you set Query Method to Multiple Selection and Query Time to Click To Query, select Set Default Filter Value and set a default value.
On the Field page, you can perform the following tasks:
Enter a keyword in the search box and click a field in the list on the left to add it to the Added list on the right.
To add all field values from the left to the Added list on the right, click Add All Field Values On The Left.
Select field values from the left to add them to the Added list on the right.
Click Exclude to remove field values from the Added list on the right.
NoteIf you choose to exclude a field value when you configure the default value and then switch the style of the drop-down list to tile, selecting that field value in the query control excludes it from the query.
If you first configure the tile style and then choose to exclude the field value when you configure the default value, the regular tile style is replaced with the tile exclusion style.
Click Delete to clear the Added list on the right.

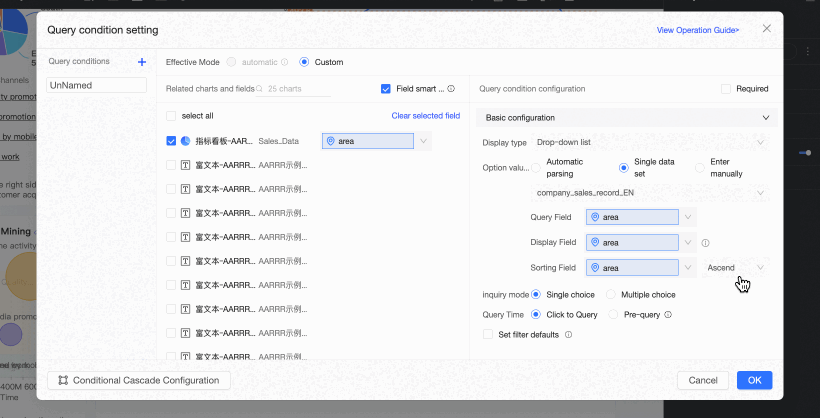
When the option value source is Single Dataset, you can select a dataset from all datasets in the current dashboard's space. We recommend using the source datasets of associated charts. The following figure illustrates the relationship between the chart's foreign key field and the single dataset's query value and display name fields.
Associated Charts And Fields are the charts and fields associated in the query condition.
Query Value Field is the field in the option value source dataset that corresponds to the foreign key field.
Display Name Field is the field in the option value source dataset that is used for filtering and displayed in the query control.
NoteIf the Display Name Field is the same as the Query Value Field, it is because the system automatically populates the display name field after you select the Query Value Field.
You must manually update the Display Name Field if it does not match the Query Value Field.
Sort Field: Sorts the data by the selected field. The available sorting methods are ascending, descending, and custom. If you select custom sorting, you can drag the field values in the Custom Sorting dialog box to arrange their order.
NoteThis is an optional setting. If you do not select a sort field, the data is sorted in the default order of the dataset.
Query Time: You can select Click To Query or Pre-query.
Click To Query: This is the default value and triggers a conditional query when the query button is clicked.
Pre-query: A new feature in Quick BI V3.12.1 that pre-queries the values in drop-down lists when you open a dashboard. The displayed values and the default value for each user vary based on the row-level permissions configuration.
Pre-query is suitable for scenarios with small datasets that have row-level permissions configured. Otherwise, the overall report loading time may increase.
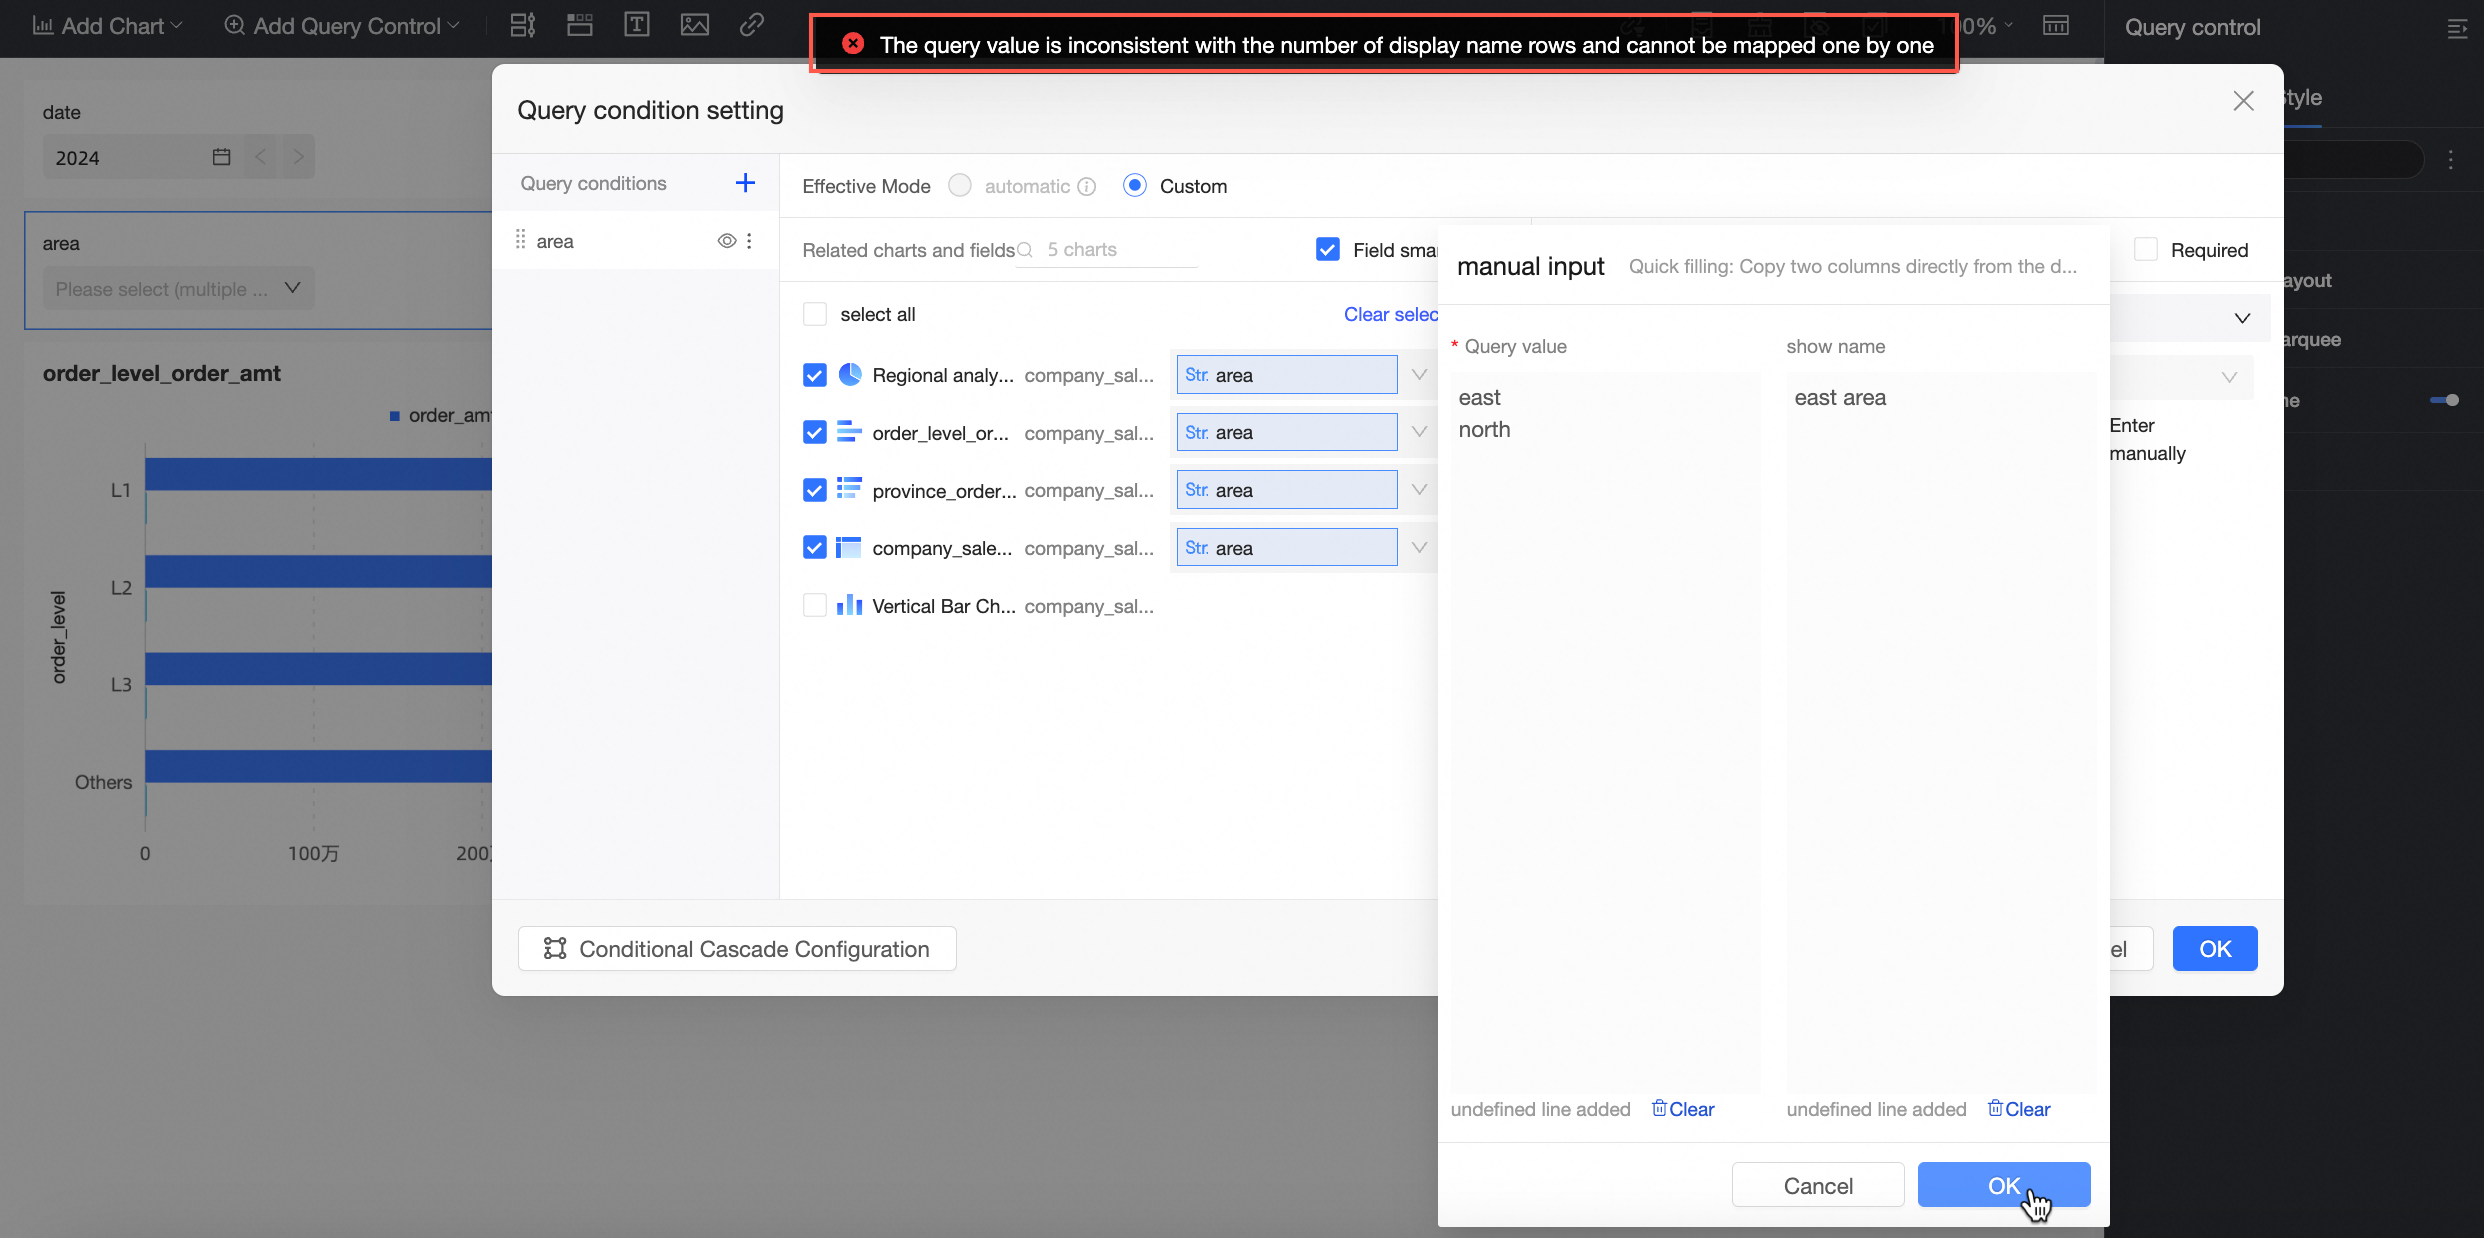
When the option value source is Manual Input, click the
 icon on the Manual Entry page to manually enter the query value and display name:
 If you are manually entering values for the first time and the query value is the same as the display name, enter the query value and click OK. The system automatically populates the display name.
If this is the first time you are manually entering values and the query value is different from the display name, you must manually enter both the query value and the display name.
If you have manually entered values before, you must manually enter both the new query value and the new display name. If you enter only the query value, the following message appears.
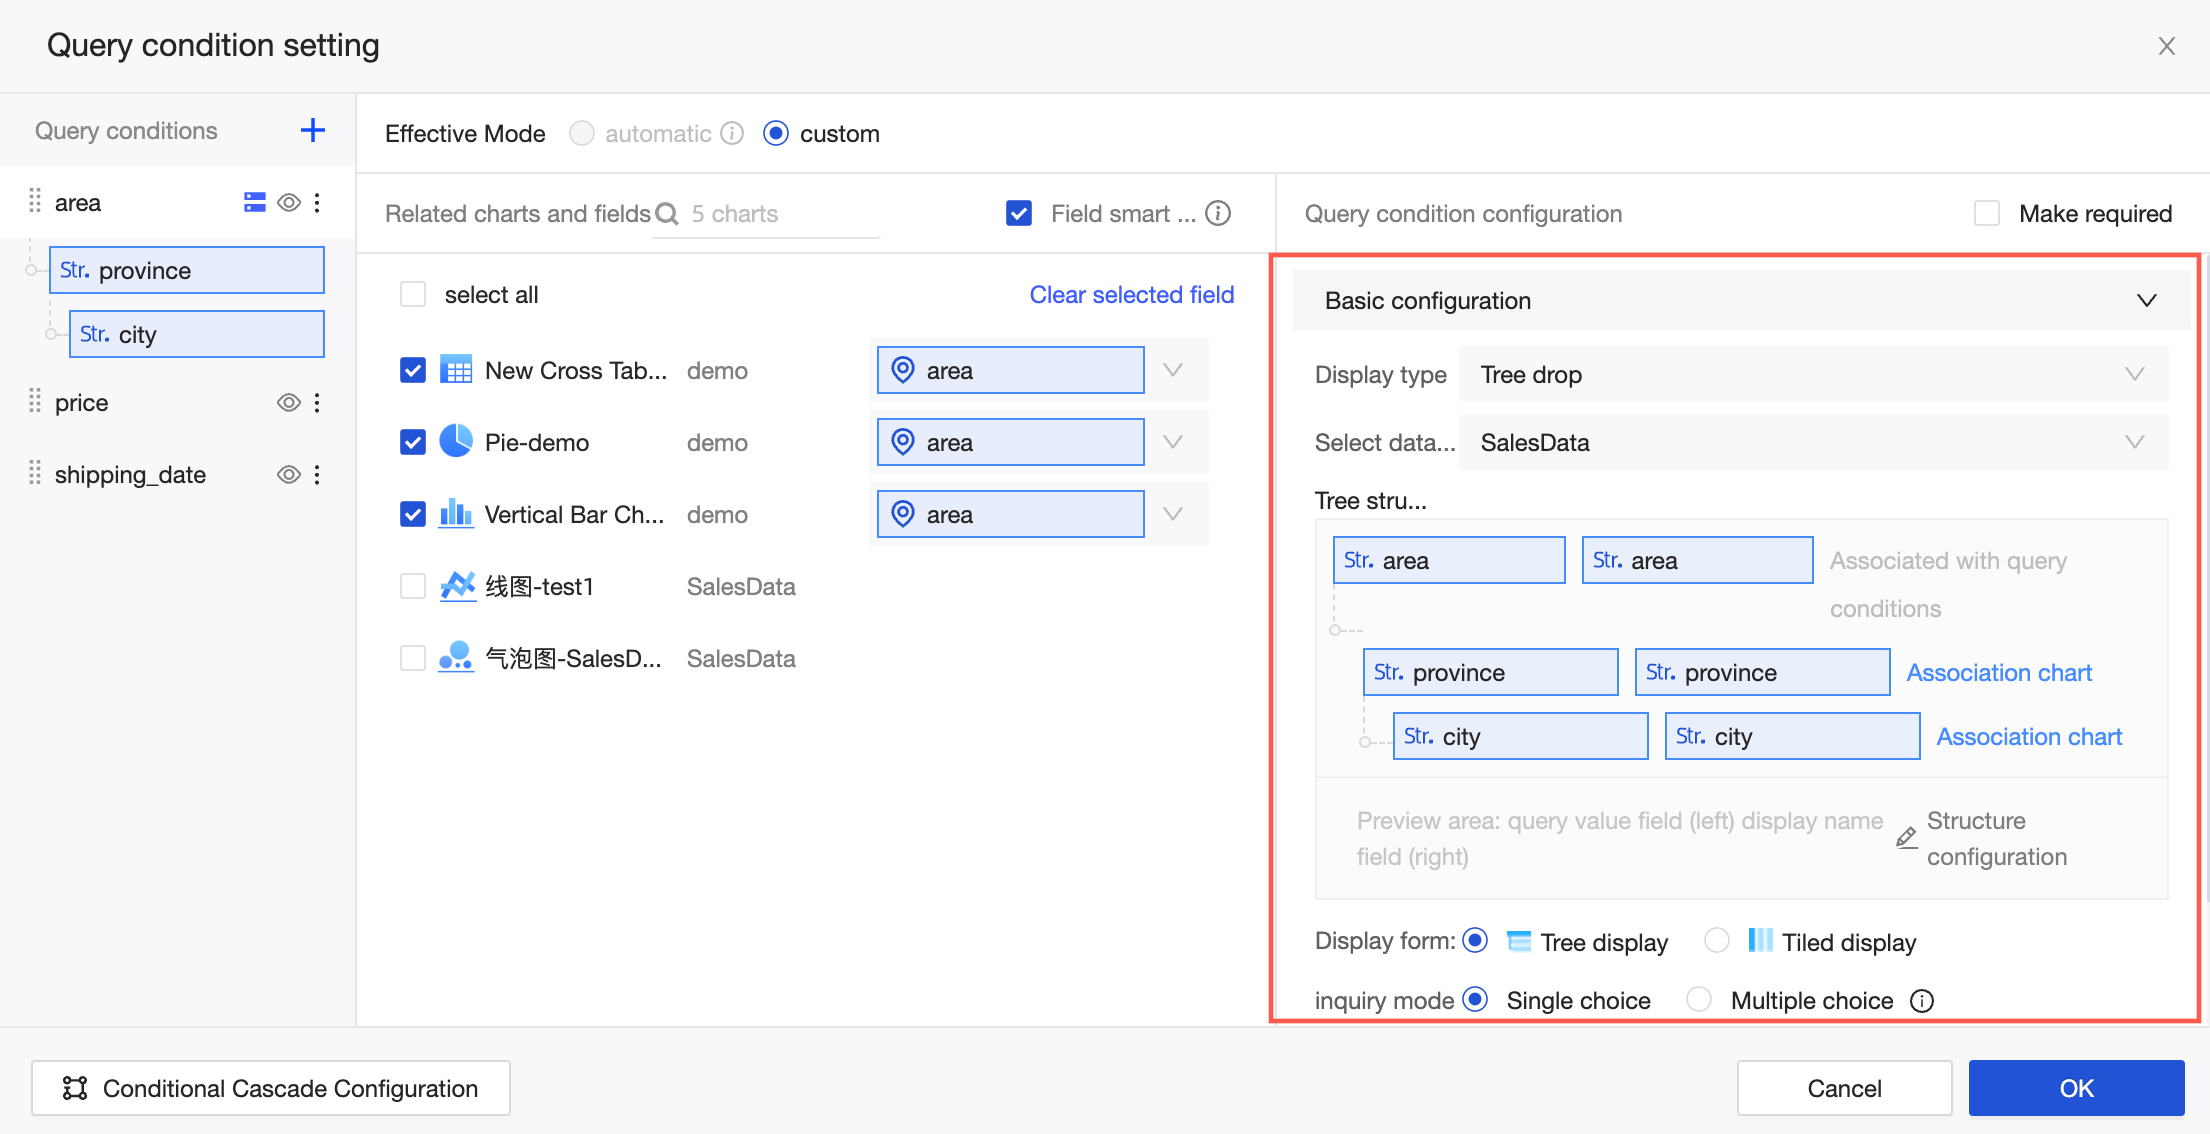
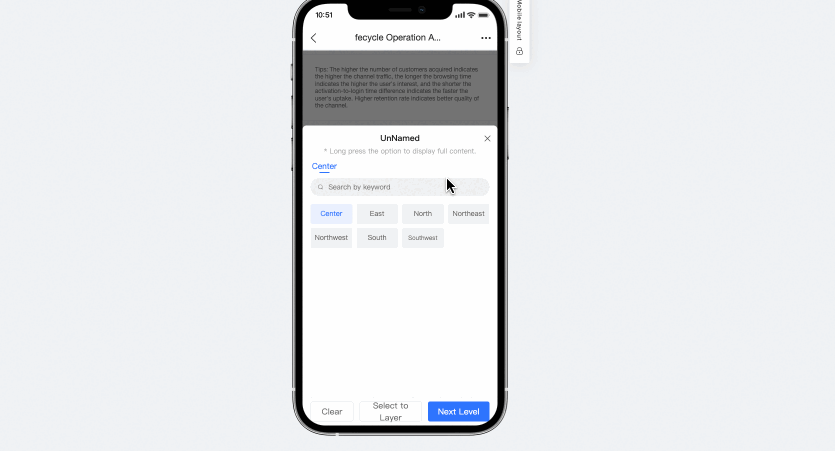
Drop-down tree
When the display type is Tree Drop-down, you can select data from one or more datasets. The display format supports Tree Display and Tile Display. The query method supports Single Selection and Multiple Selection. Query execution supports Click To Query and Pre-query.
NoteThe tree structure supports a maximum of 10 levels.
Tree display with single selection
Tree display with multiple selection
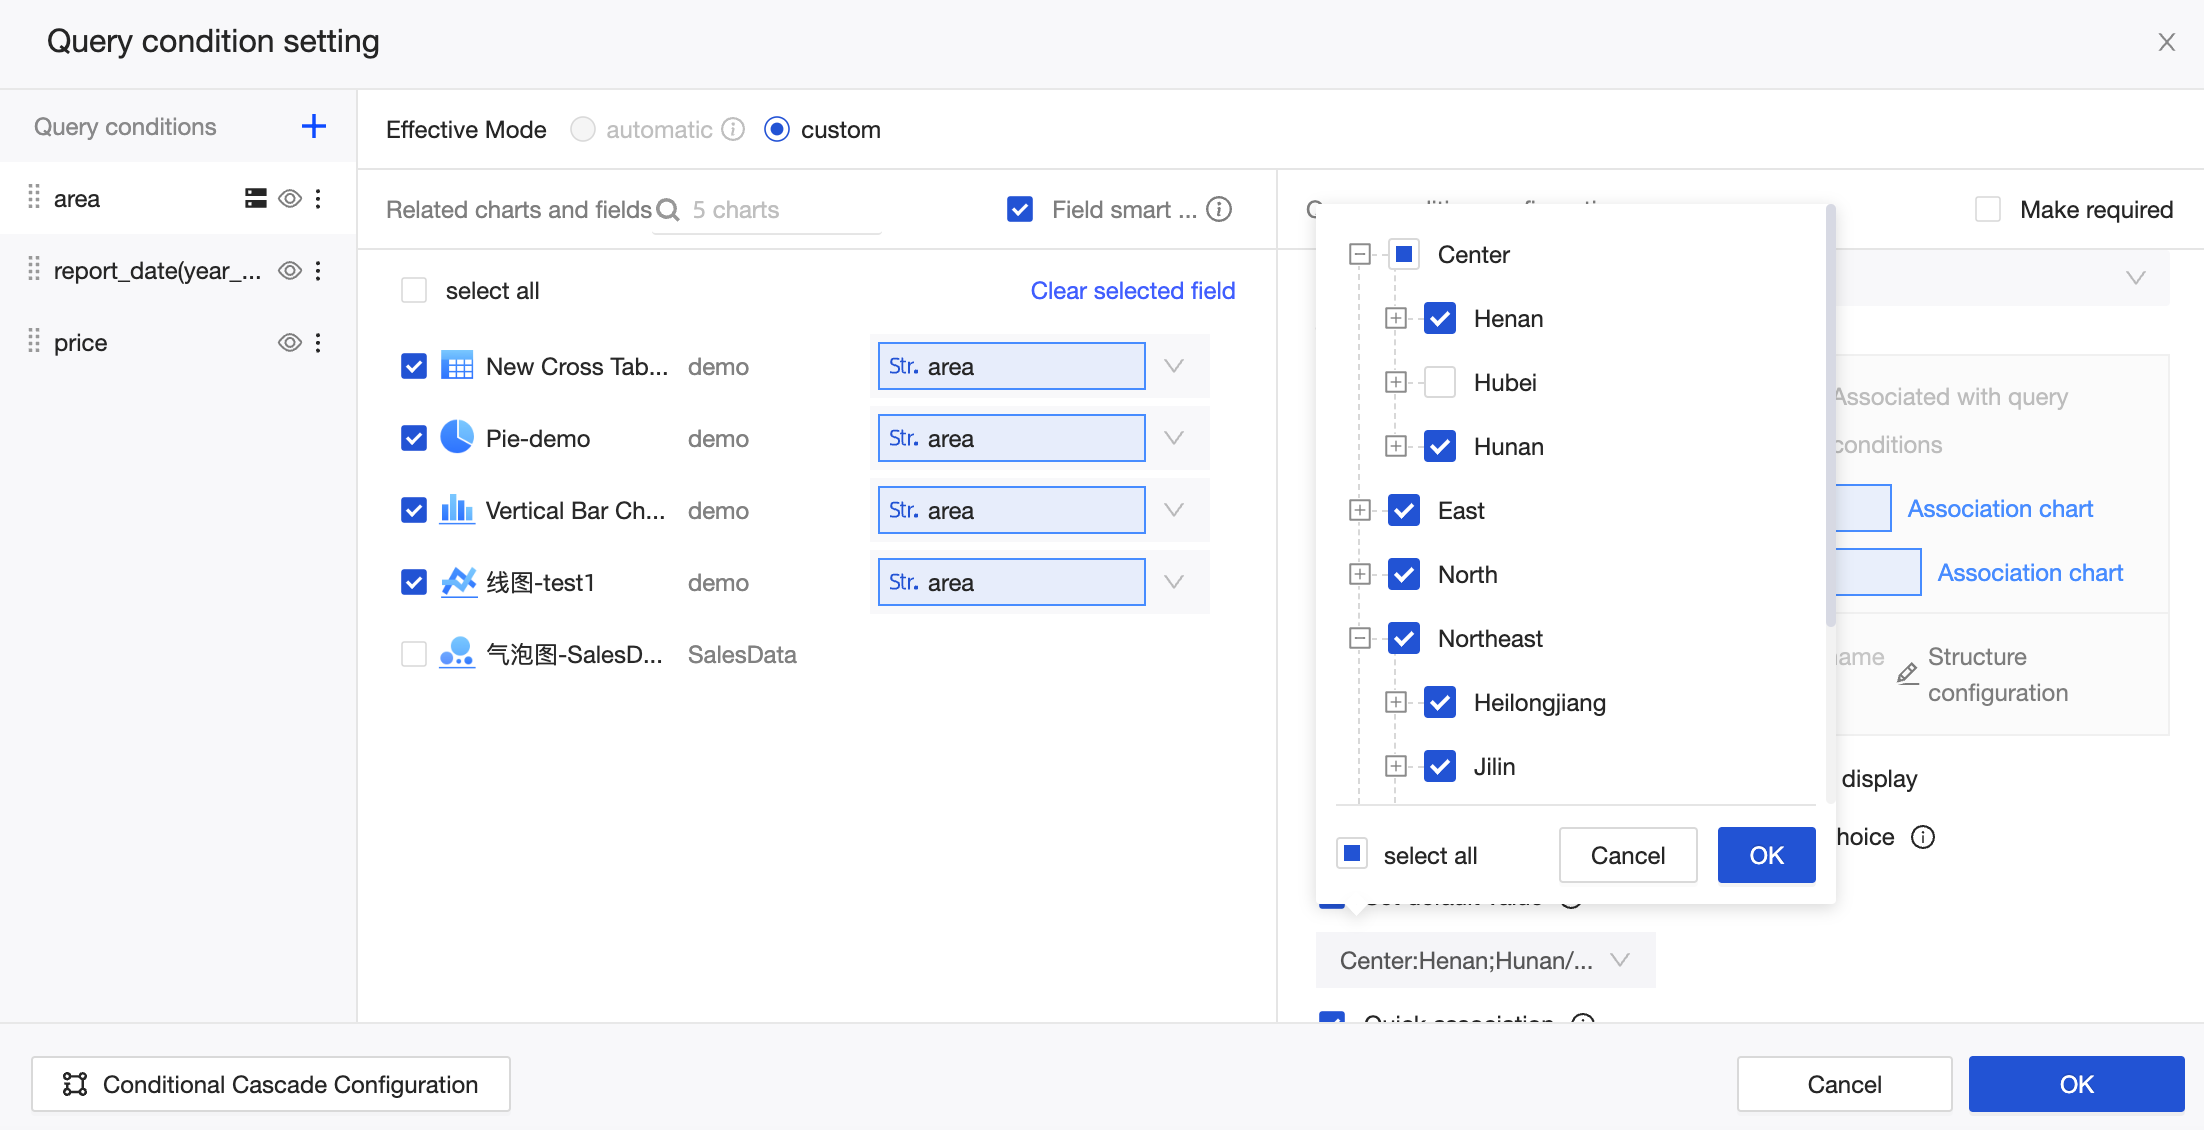
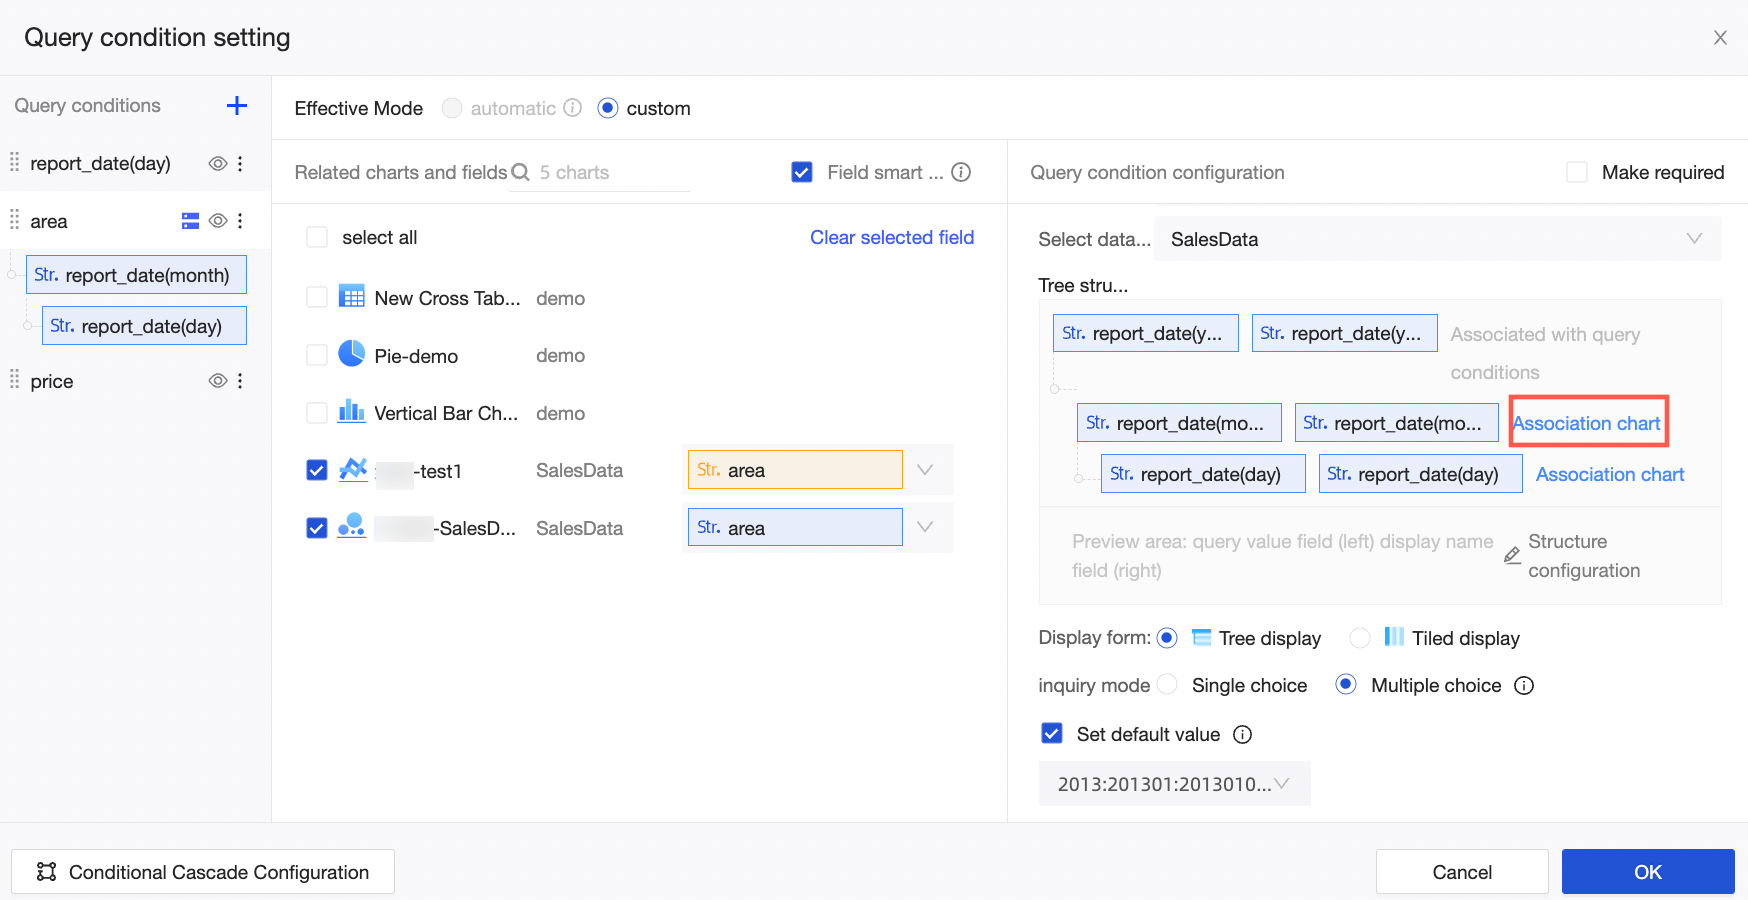
The quick association feature is enabled by default. This feature automatically selects associated charts and fields from the same dataset for the child levels in the tree structure. To associate charts and fields from other datasets with a child level, you can click Associate Chart in the tree structure or click the name of a child level in the query items on the left.
 For example, as shown in the following figure, when you configure the association for the second level, Province, the foreign key fields for the Bar Chart and Pie Chart are automatically selected because they are from the same dataset. However, you must manually enter the foreign key field for the Metric card chart because it is from a different dataset.
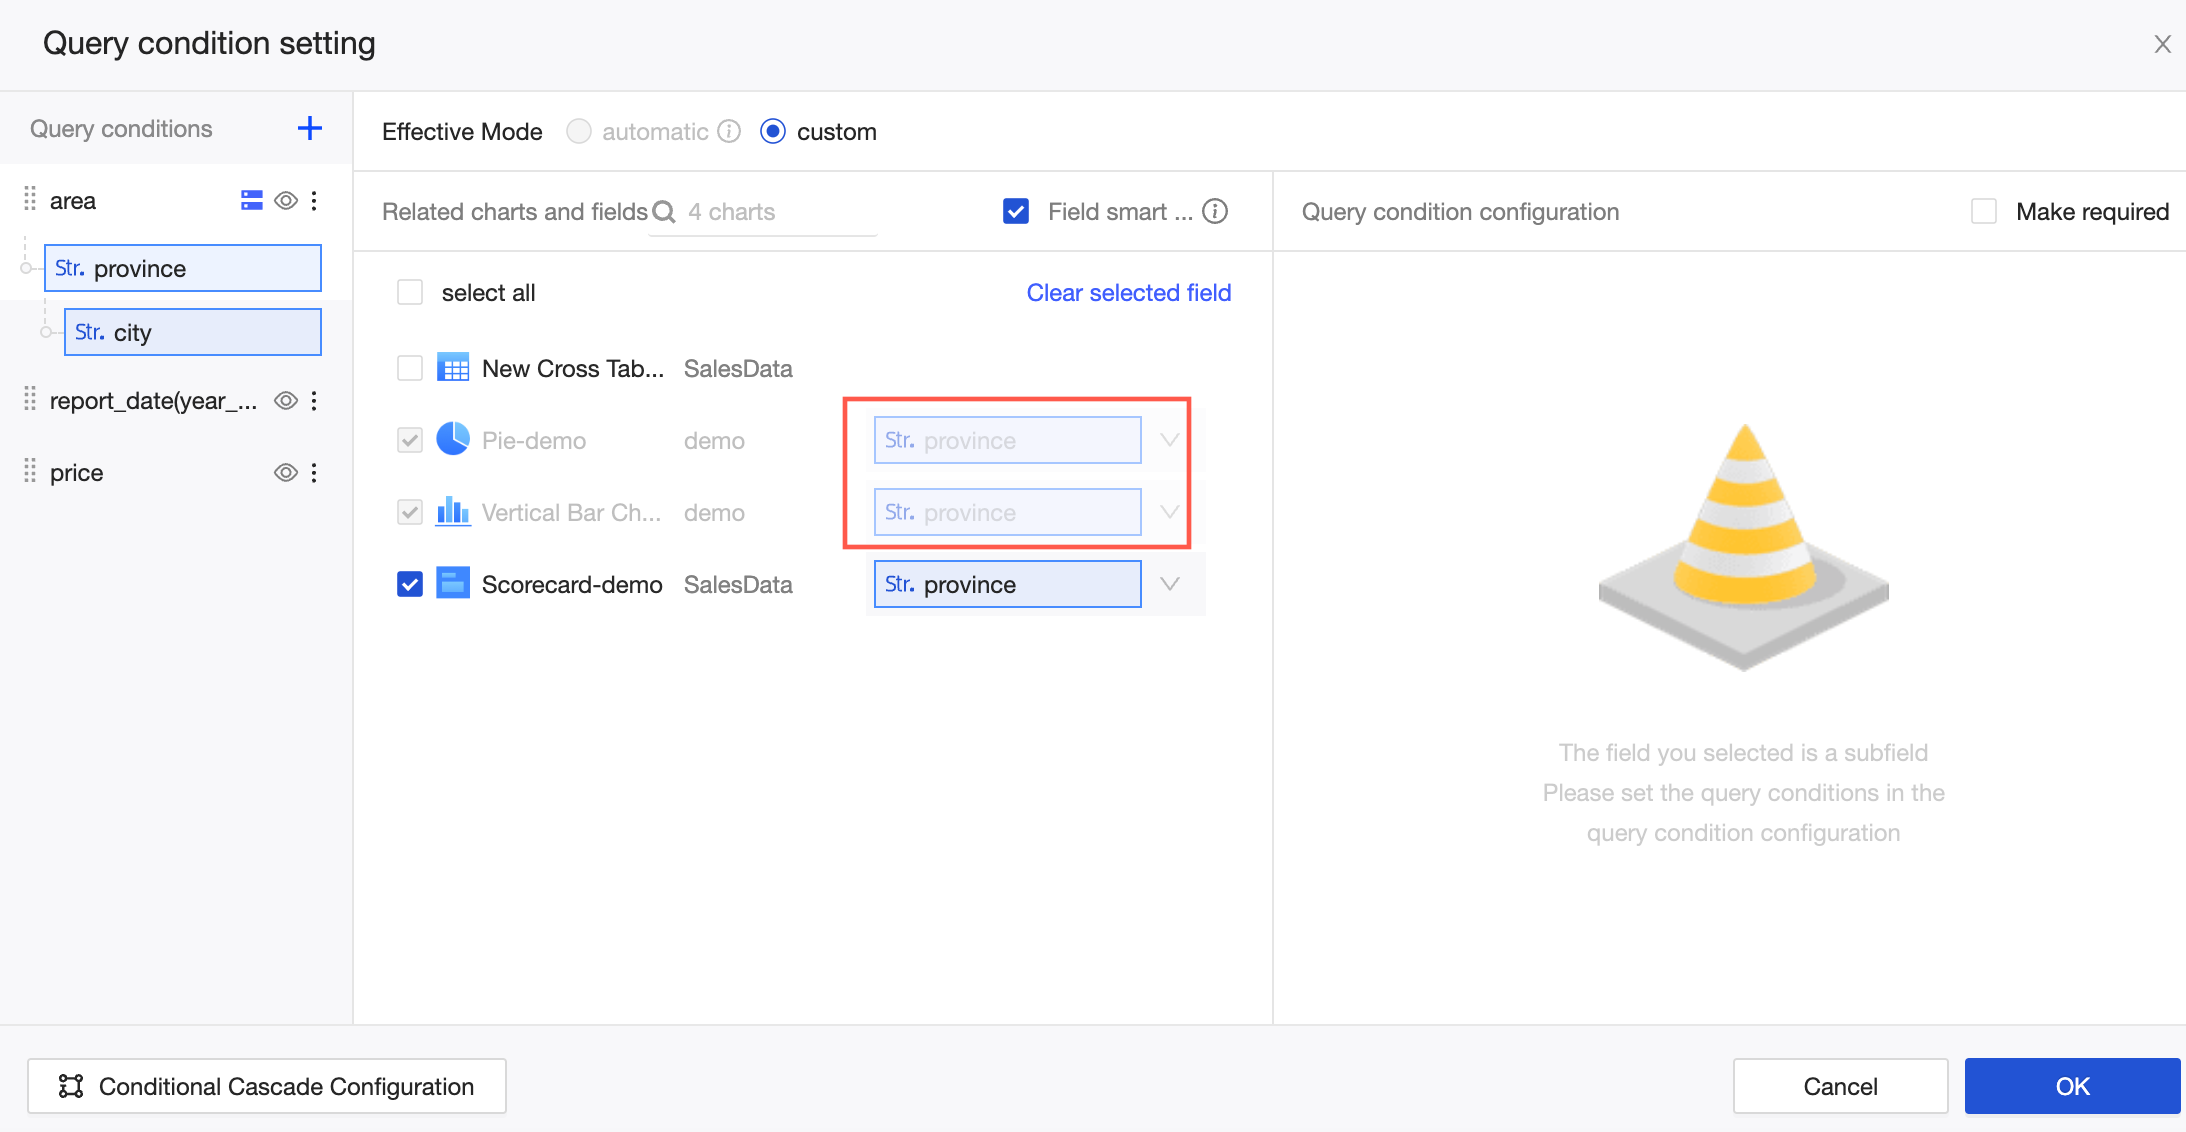
The tree drop-down list on a mobile client lets you clear conditions. You can click the clear button at each level on your mobile device to clear the filter conditions.
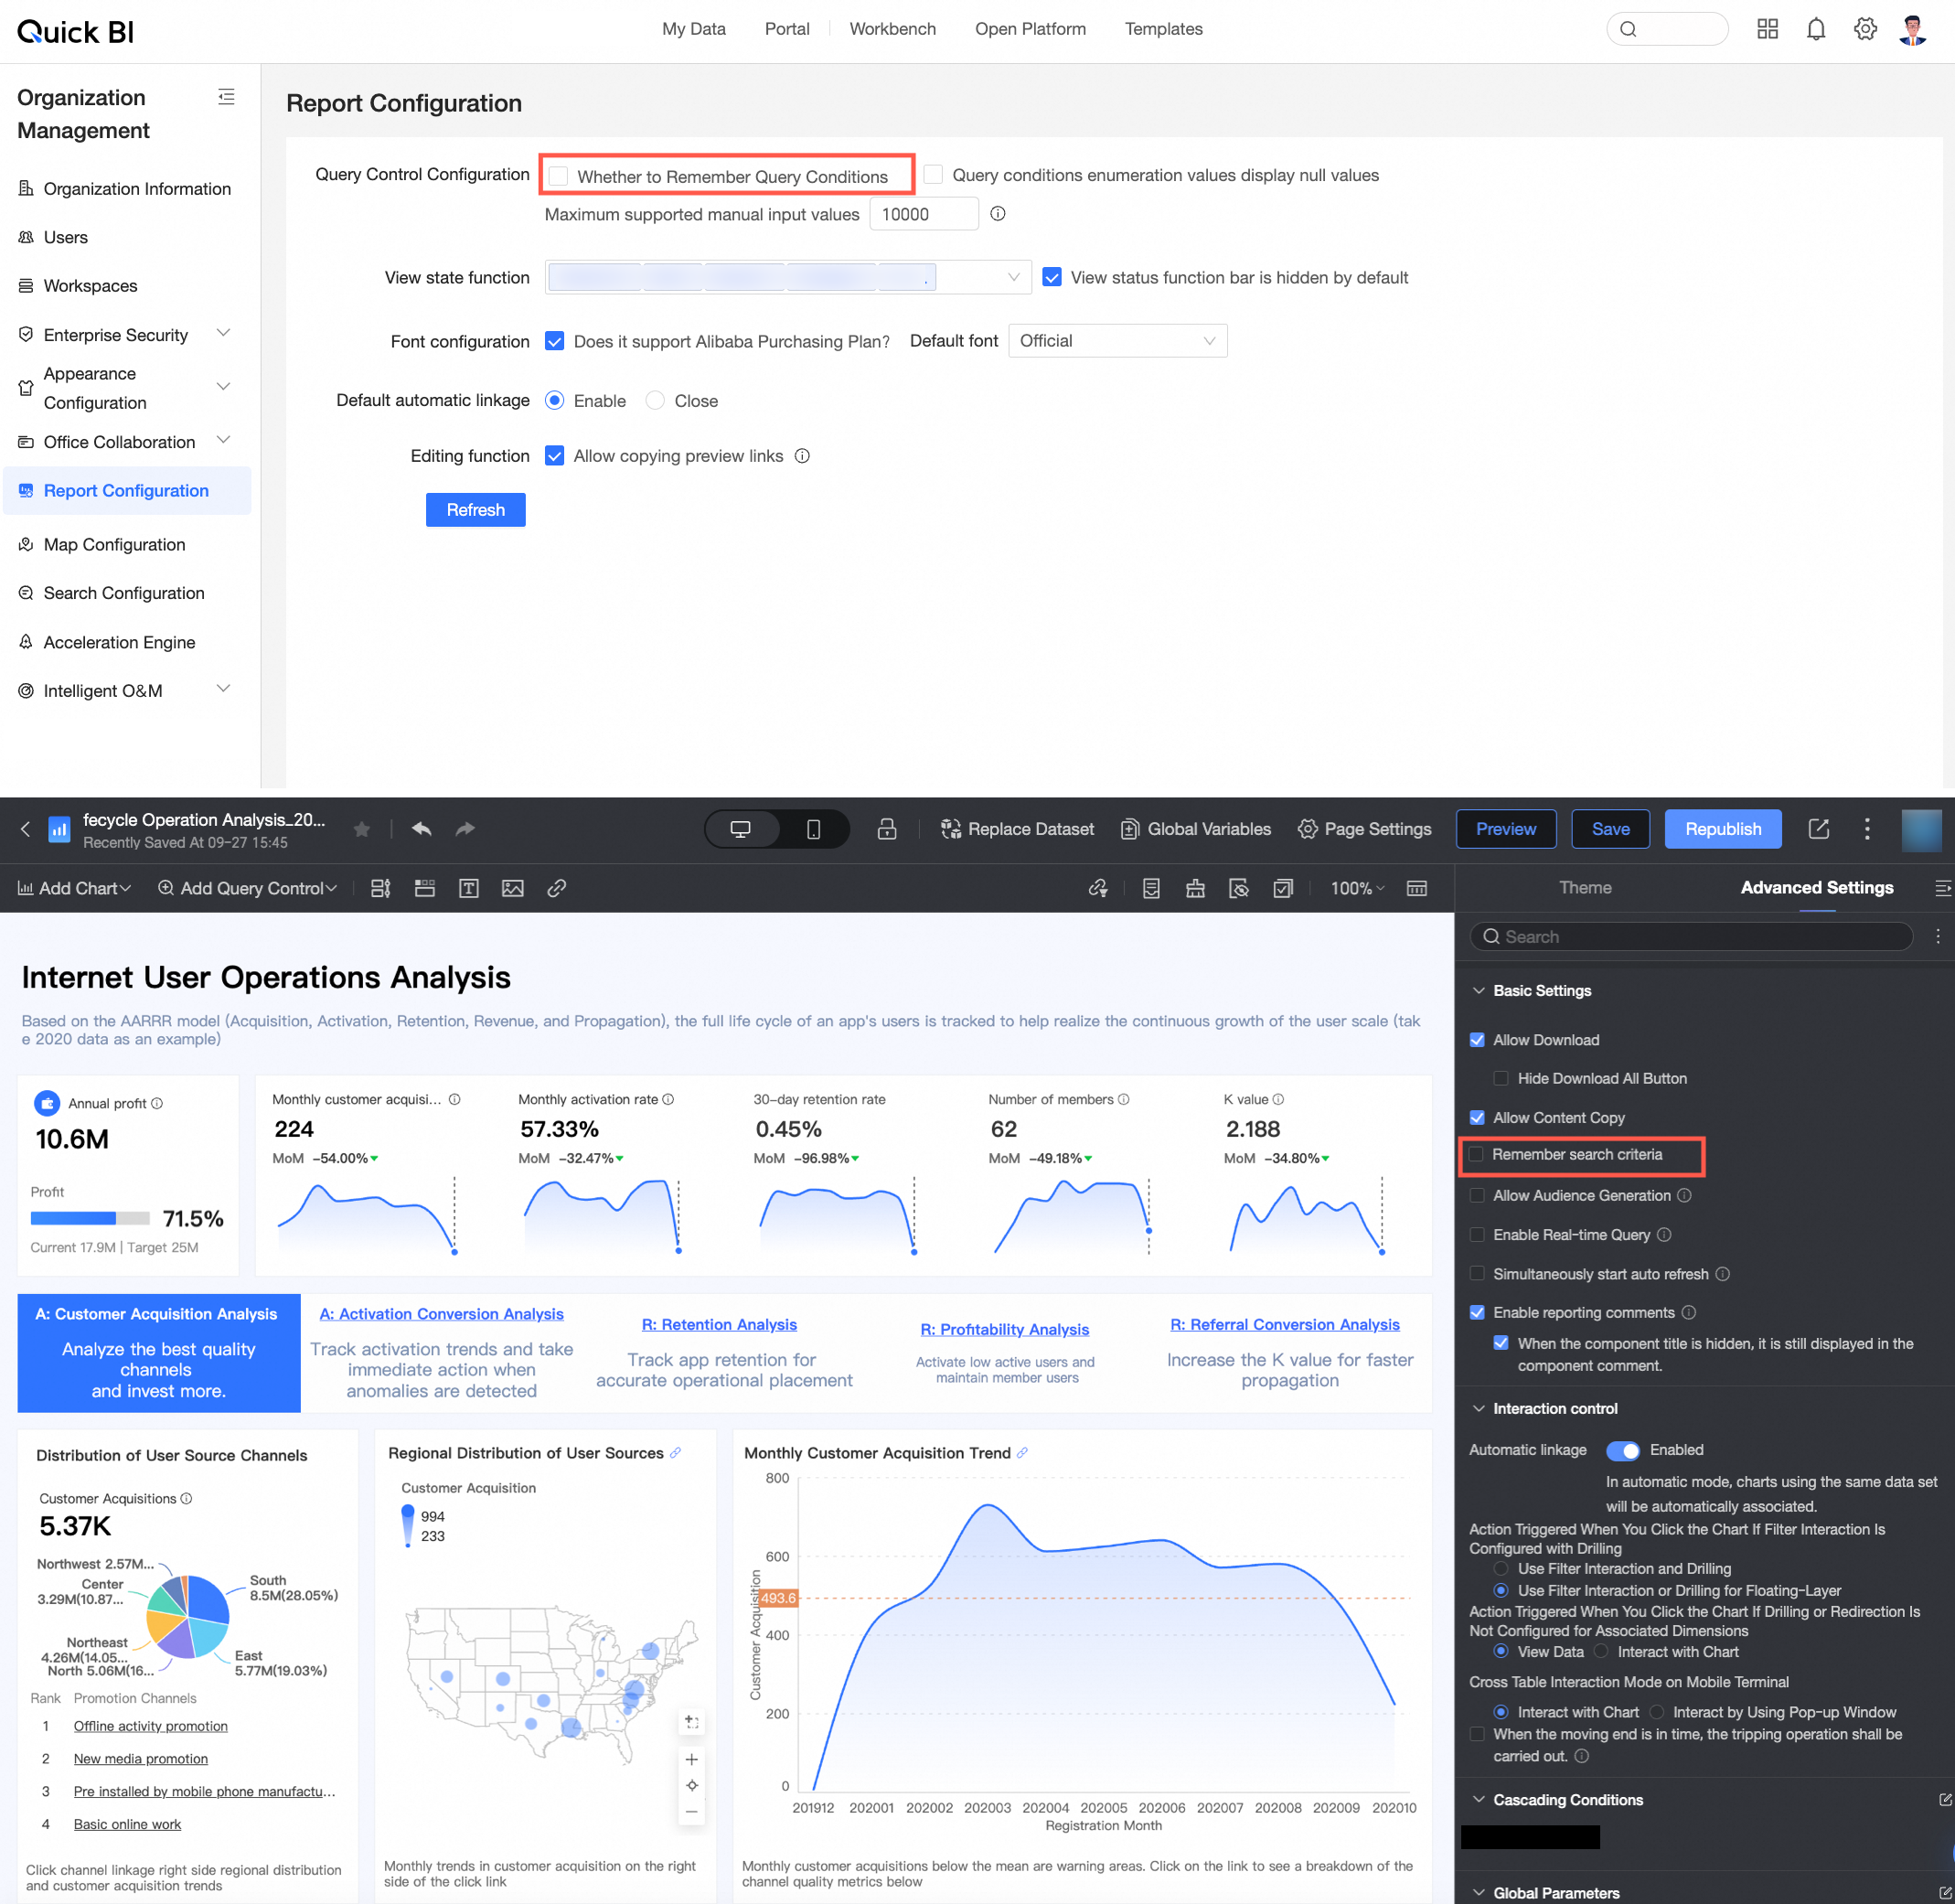
Remember query conditions
You can choose to remember query conditions at the report level.
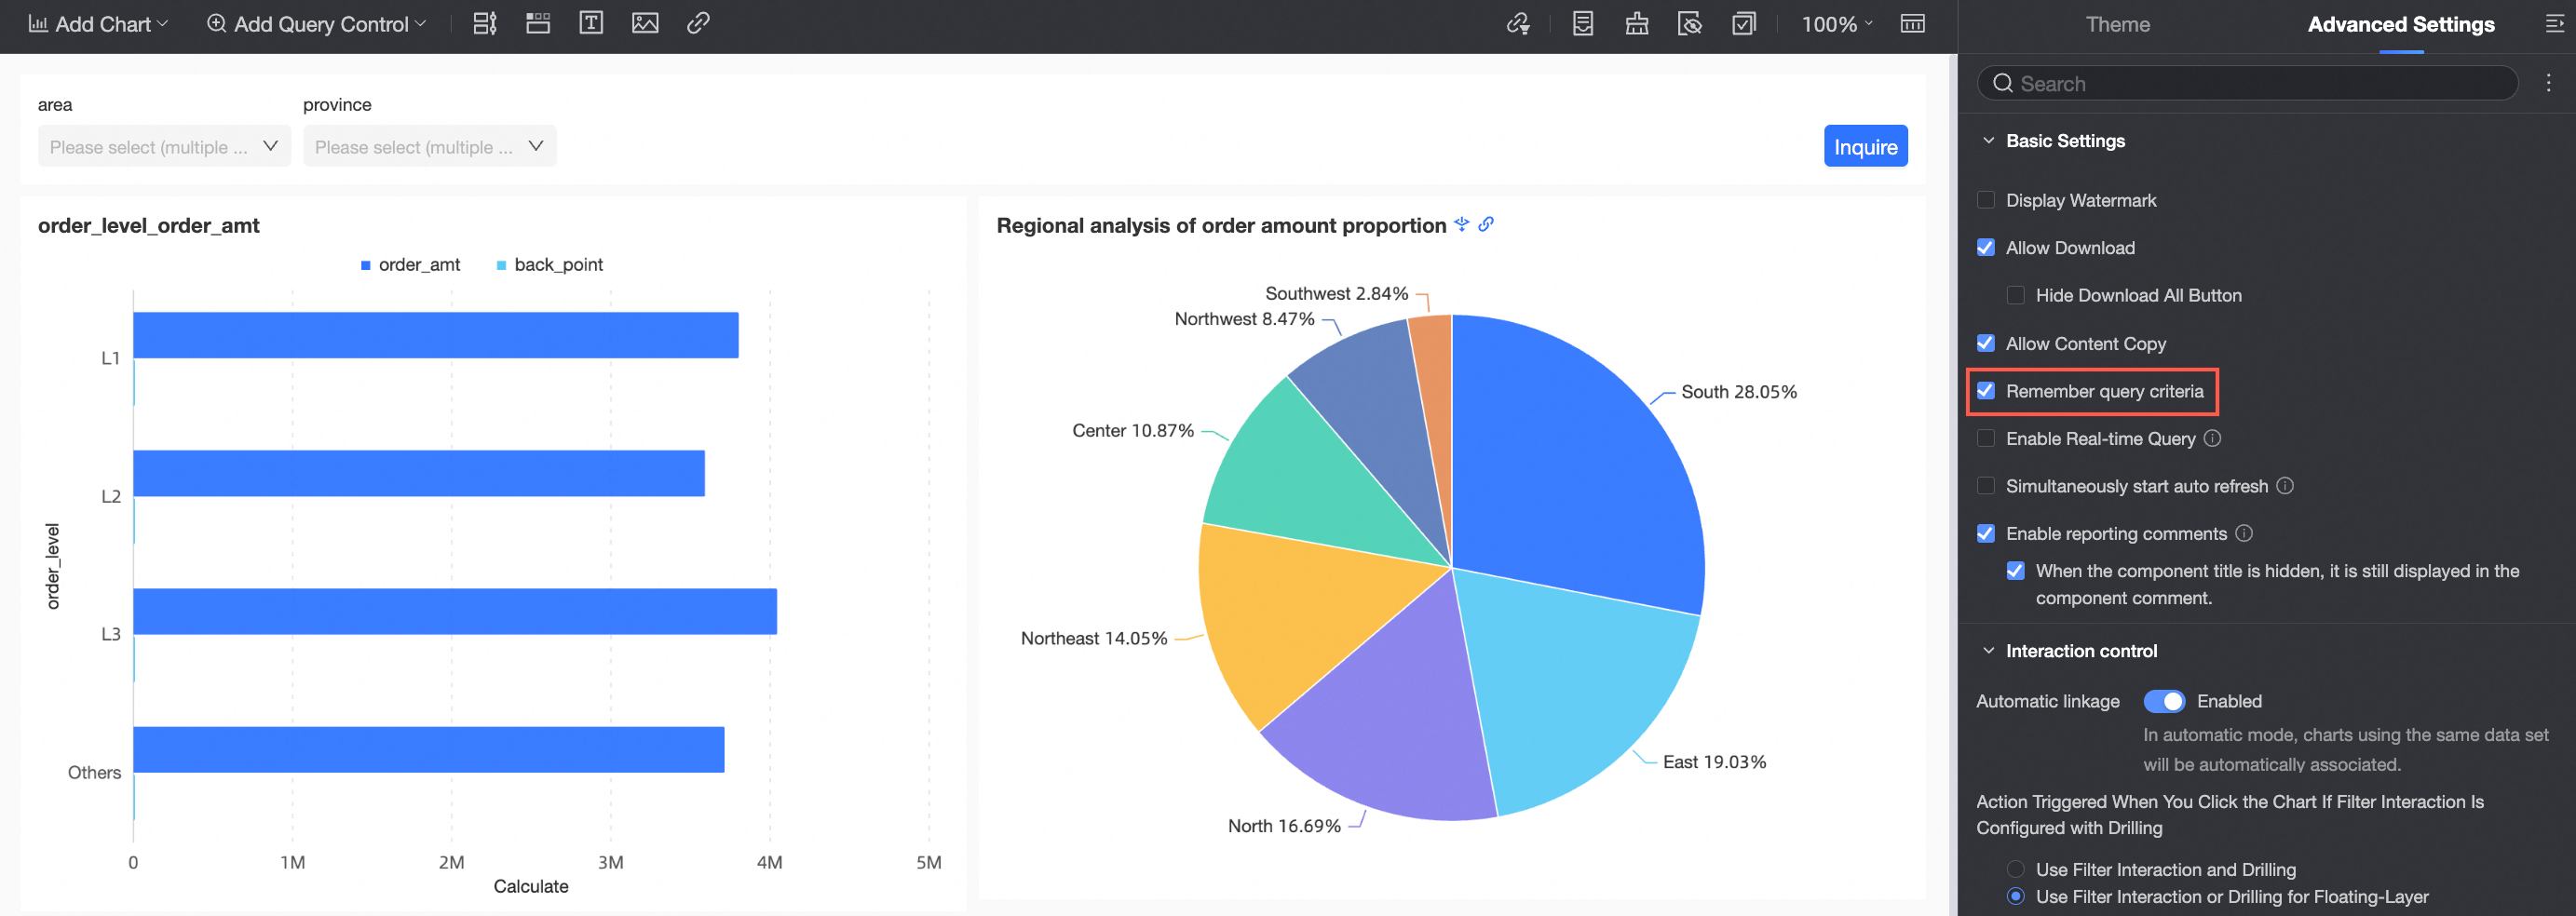 When this option is selected, the system remembers the last used query conditions by default.
This report-level setting is affected by the organization-level configuration.
If Remember query conditions is selected in the Report Configuration, the option to remember query conditions on the report page is disabled and cannot be deselected.
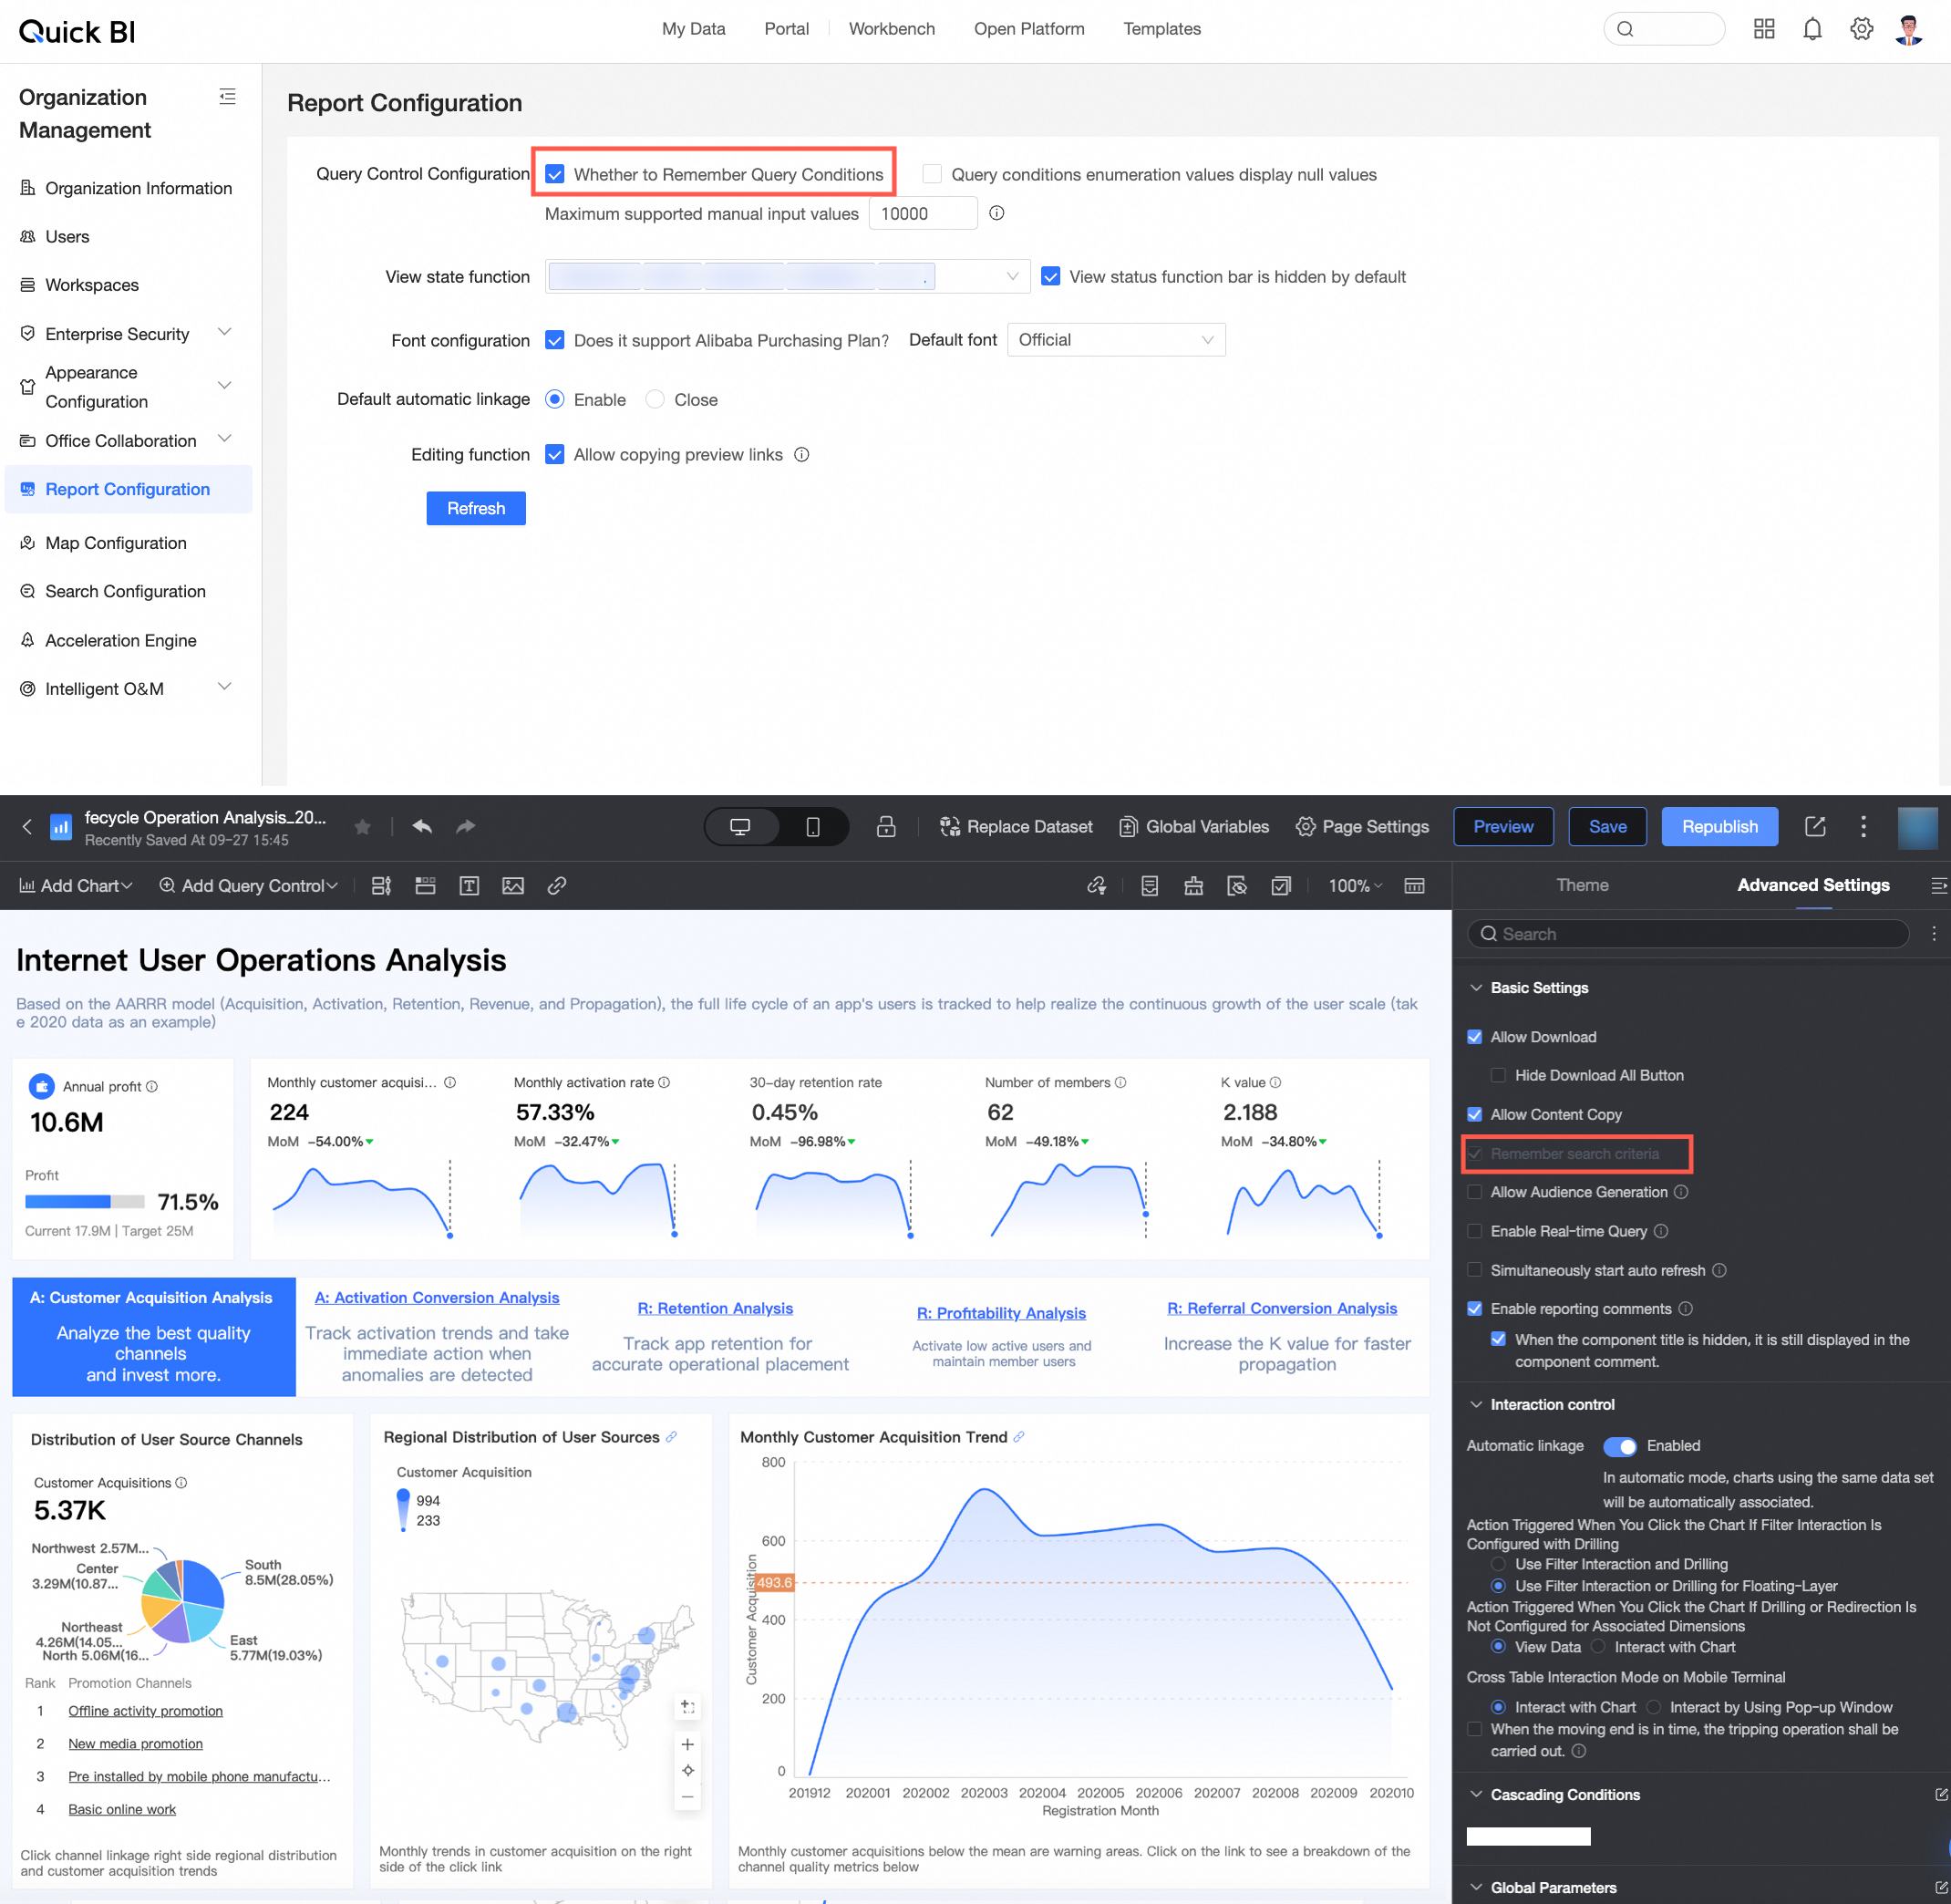
If Remember query conditions is not selected in the Report Configuration, you can enable or disable this option at the report level as needed.