Quick BI provides drill down, filter interaction, and navigation features to support multidimensional data analysis. This topic describes the use cases and procedures for the filter interaction feature.
Scenarios
Filter interaction lets you dynamically update one or more charts based on selections or interactions in another chart.
Scenario description: In a sales dashboard, you can select the East China area on a map chart to view sales performance, shipping costs, and other details for that region. Other linked charts automatically update to show the relevant data for East China.
Filter interaction effect: When a viewer clicks the East China region on the map, all other charts on the report instantly refresh to display sales performance, shipping costs, and related information for East China.
Limits
Filter interaction is supported by the following chart types.
Tables: cross table, detailed table, trend analysis table, multidimensional analysis table, heat map.
Metric charts: scorecard, metric trends, ticker board, progress bar chart, gauge, wave chart, metric decomposition tree, metric relationship graph.
Line/area charts: line chart, area chart, stacked chart, 100% stacked chart, combo chart.
Column/bar charts: column chart, stacked column chart, 100% stacked column chart, circular bar, leaderboard, bar chart, stacked bar chart, 100% stacked bar chart, dynamic bar chart, waterfall chart, bullet chart, box plot.
Pie/doughnut charts: pie chart, rose chart, sunburst chart, radar chart, treemap chart.
Bubble/scatter charts: bubble chart, scatter chart, faceted scatter chart.
Funnel/conversion charts: funnel chart, comparative funnel chart, flow analysis chart, Sankey diagram.
Geospatial charts: colored map, bubble map, heat map, building heat map, arc map, symbol map.
Other: word cloud, timeline.
Application Example
For example, when you click the East China region in the Regional Order Sales Overview chart, the Regional Order Volume Overview and Product Sales Details charts update to show data for East China. Then, if you click the Mid-tier order level in the Regional Order Volume Overview chart, the Regional Order Sales Overview and Product Sales Details charts update to show data for Mid-tier orders within East China.
Configuration Entry Point
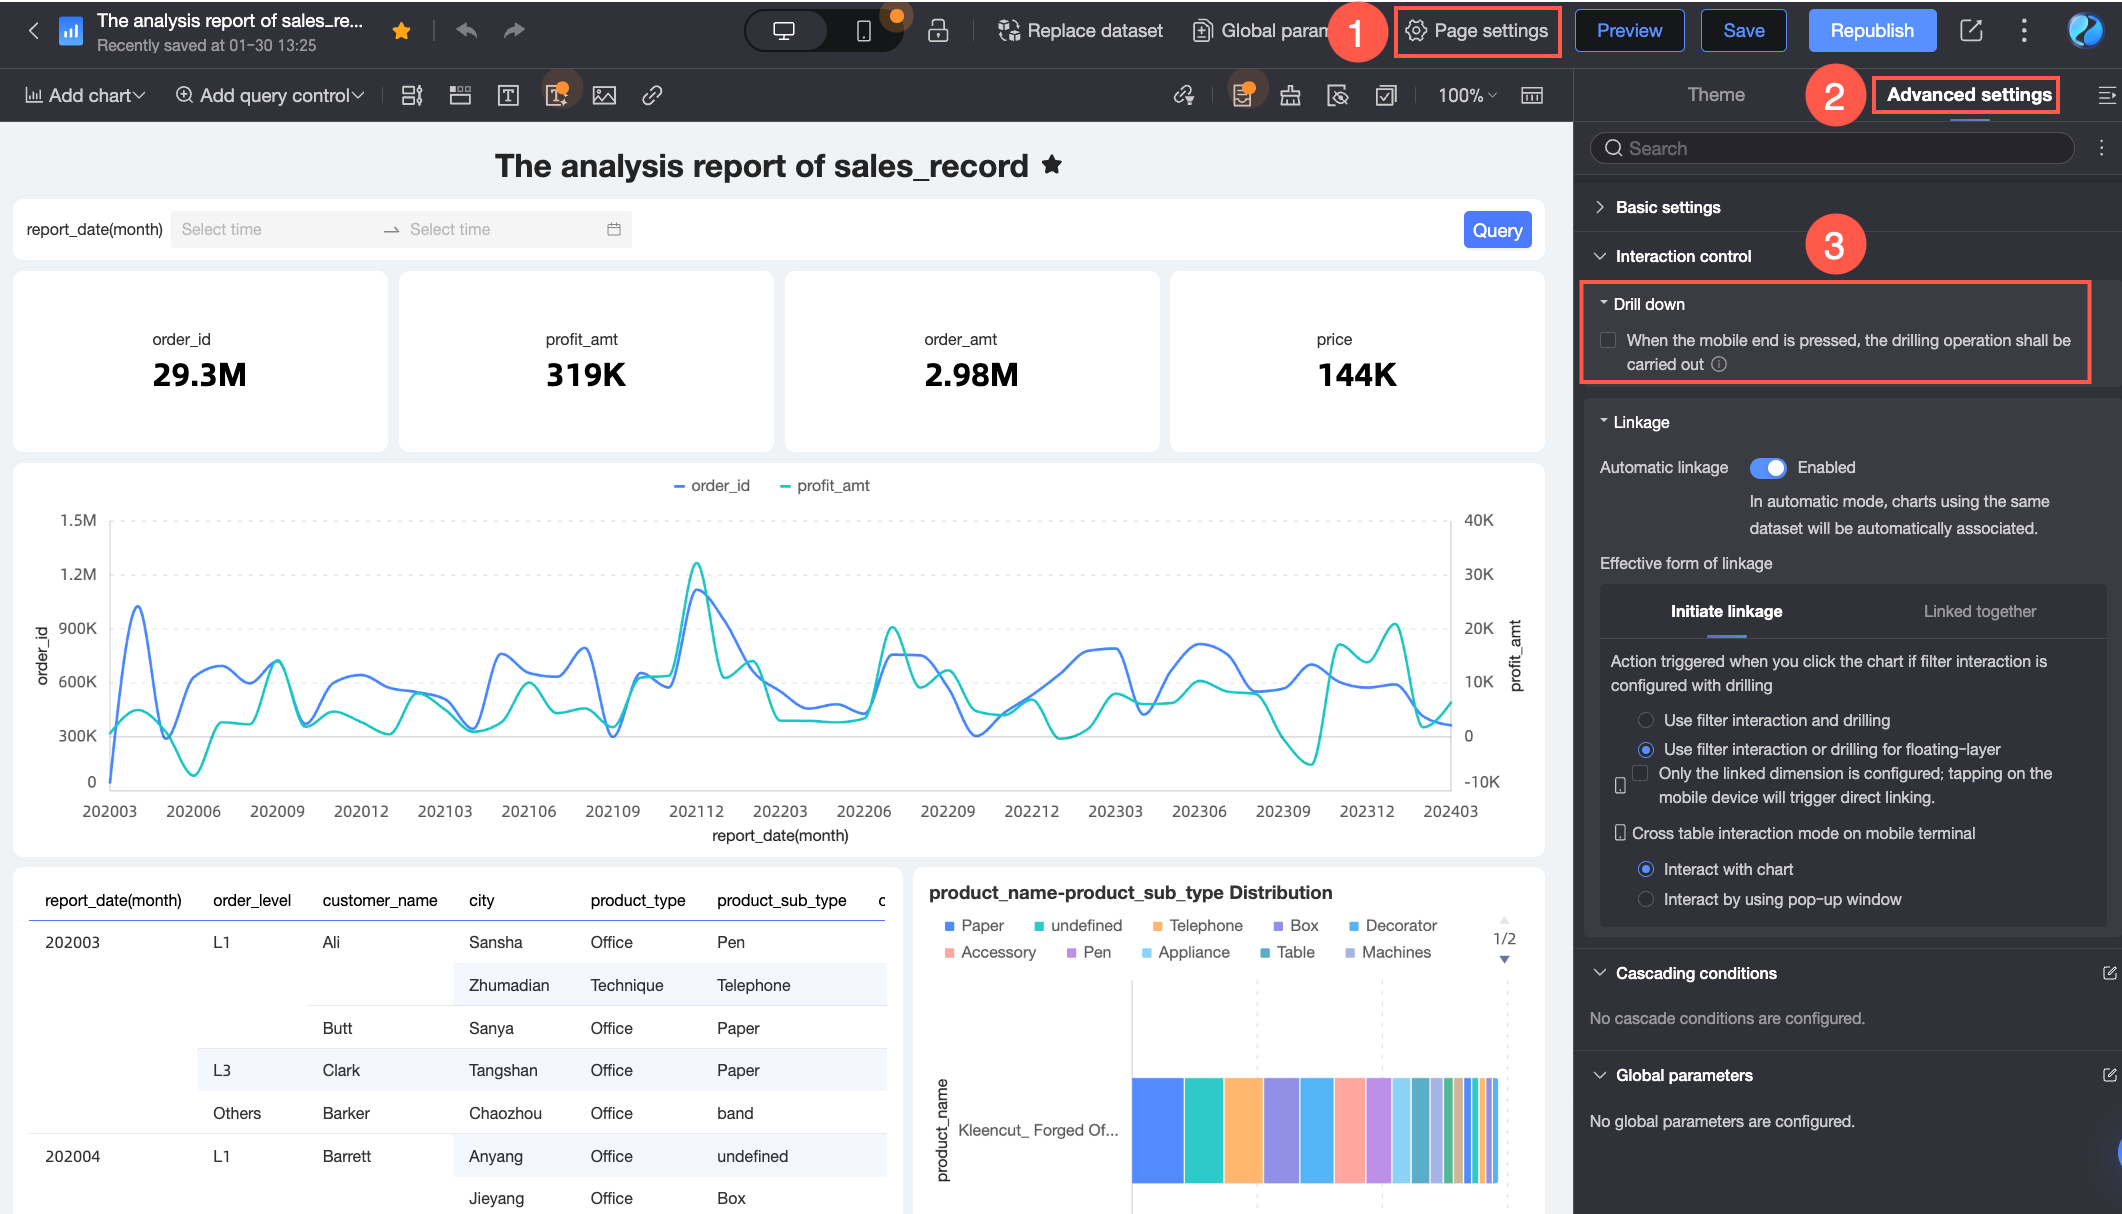
On the dashboard editing page, click the  icon in the upper-right corner. On the Advanced tab, navigate to Interaction Control > Filter Interaction to configure global filter interaction settings.
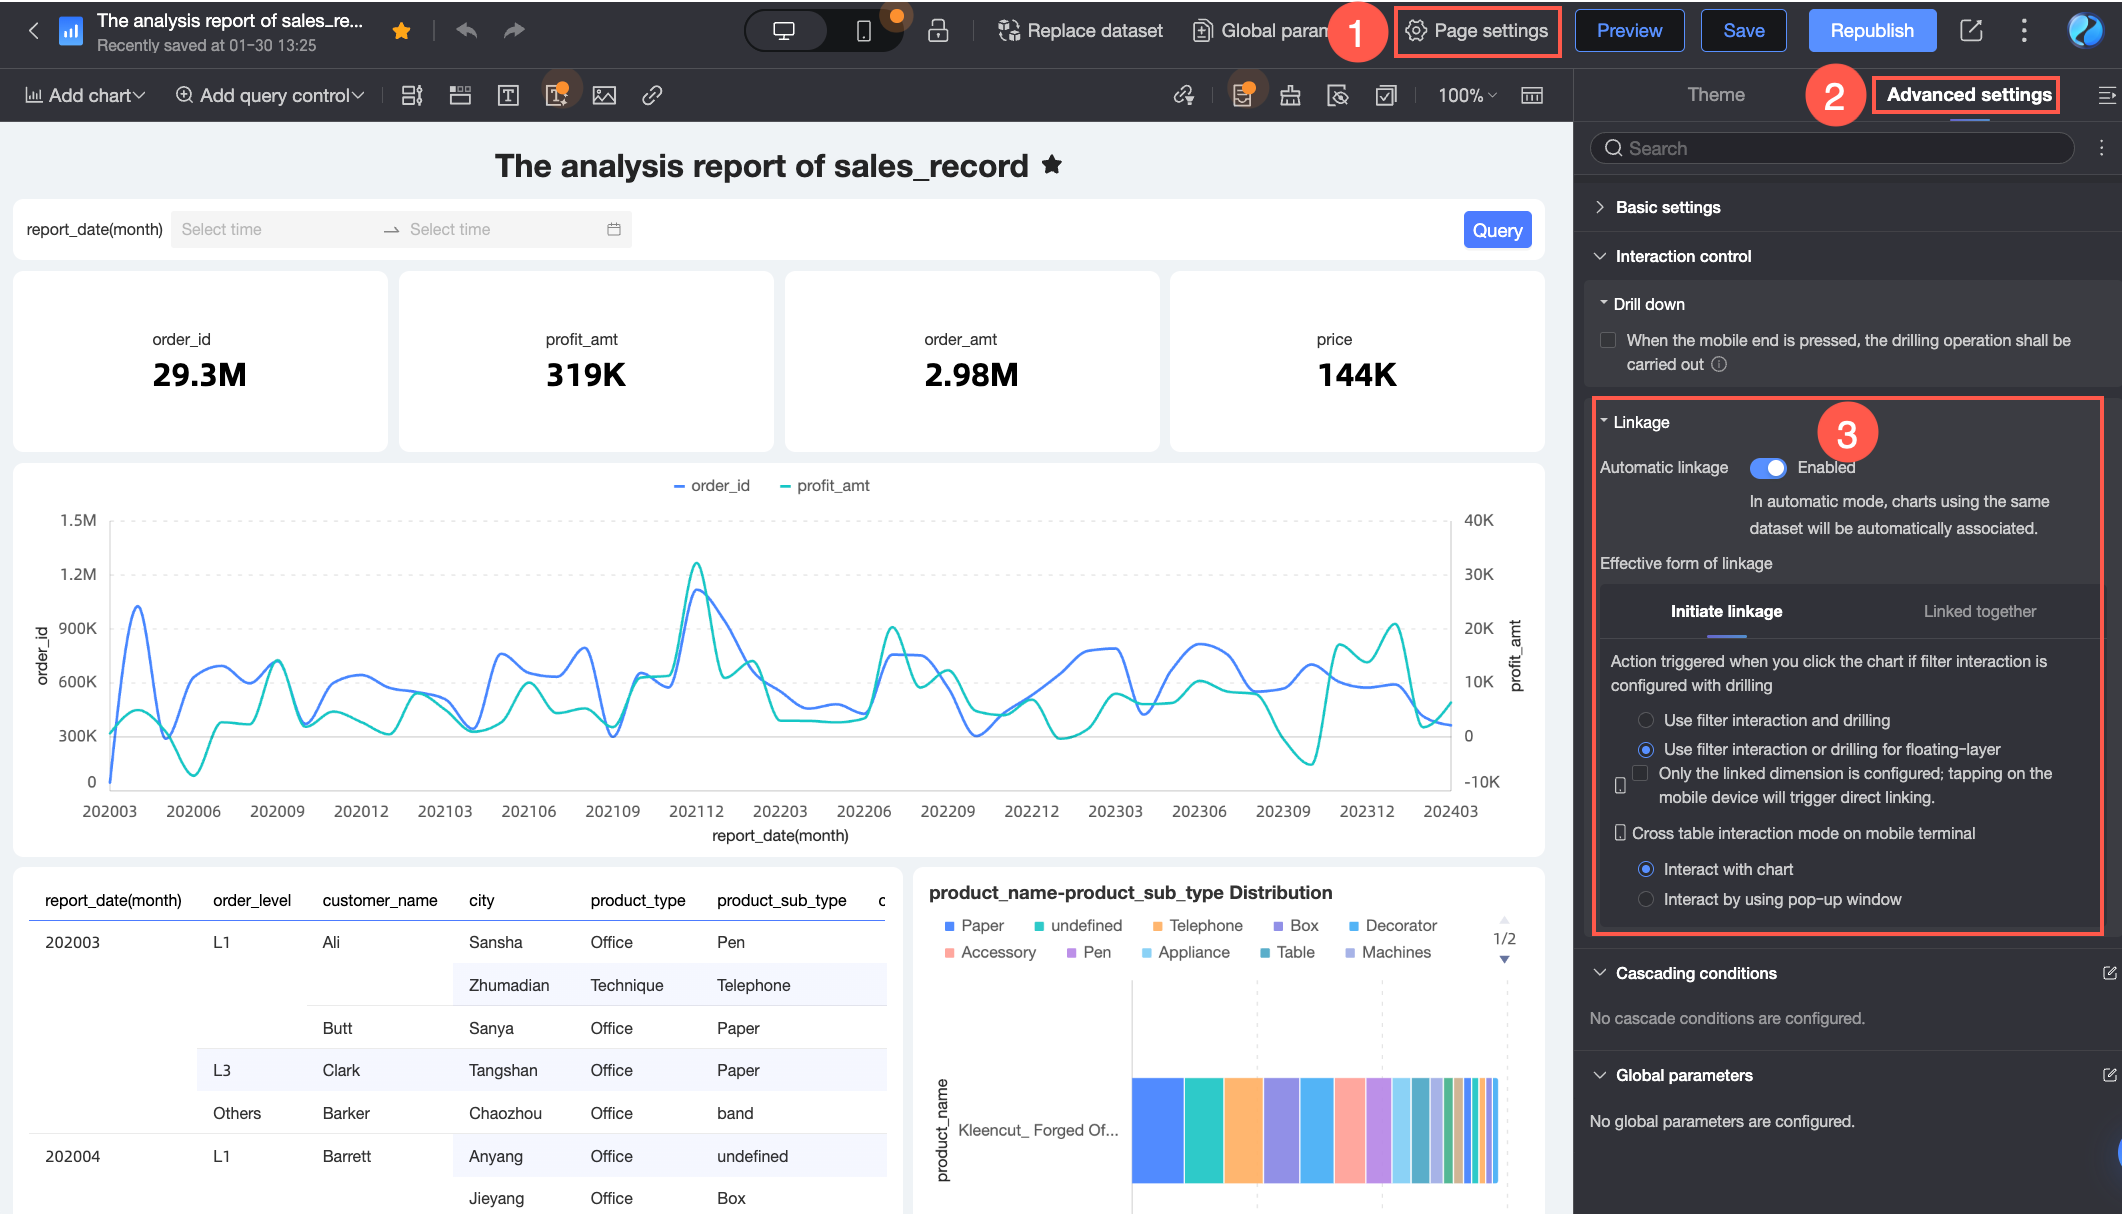
You can enable automatic filter interaction to link all charts that use the same dataset, manually configure filter interaction for individual charts, or set how charts trigger and respond to filter interactions.
Configuration | Description | |
Configuration type | Automatic filter interaction | Automatically links charts that use the same dataset in the dashboard. For details, see Configure Automatic Filter Interaction. |
Manual filter interaction | Manually configures filter interaction for a specific chart in the dashboard. For details, see Configure Manual Filter Interaction. | |
Trigger method | Apply simultaneously | If the dimension used to trigger filter interaction also has drill down configured, clicking a data value in the source chart immediately drills down in that chart and filters all linked charts to show data matching the selected value. |
Floating layer selection for drill down or filter interaction | If the dimension used to trigger filter interaction also has drill down configured, clicking a data value in the source chart displays a floating layer with options to either drill down or apply filter interaction. The viewer must choose which action to perform. If drill down is selected, only the source chart drills down. Other charts remain unchanged. If filter interaction is selected, the source chart highlights the selected value, and all linked charts filter to show data matching that value.
| |
Response method | Filter-based interaction | After selecting specific data in one chart, all linked charts automatically update to show only data that matches the selection. This method helps focus analysis on specific datasets or segments by excluding irrelevant data. |
Highlight-based interaction | After selecting specific data in one chart, matching data points in linked charts are highlighted while all other data remains visible. This method preserves the full context while emphasizing specific values, making it ideal when comparing overall trends with selected details. Note Only the following chart types support highlight-based interaction:
| |

Procedure
You can configure charts for automatic or manual filter interaction and set the behavior of the interaction.
Configure Automatic Filter Interaction
In automatic filter interaction mode, all charts in the dashboard that use the same dataset are automatically linked.
Enable Automatic Filter Interaction
In the Sales Analysis dashboard, click Page Settings. On the Advanced tab, navigate to the Interaction Control section and enable Automatic Filter Interaction.
After you enable this feature, all charts that use the same dataset are automatically linked. For example, if you click East China in the Regional Order Sales Overview chart, other charts update to show data for East China.

You can view the current filter interaction status or switch values in the Floating Filter Interaction Panel on the right. For more information, see Filter Interaction Panel in this topic.
Bidirectional Filter Interaction
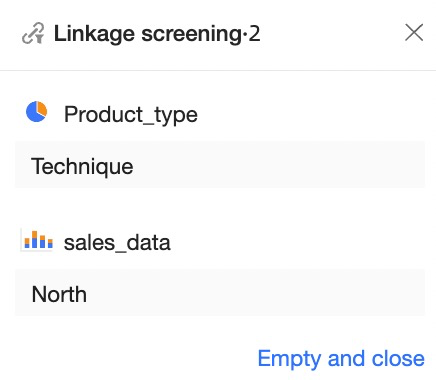
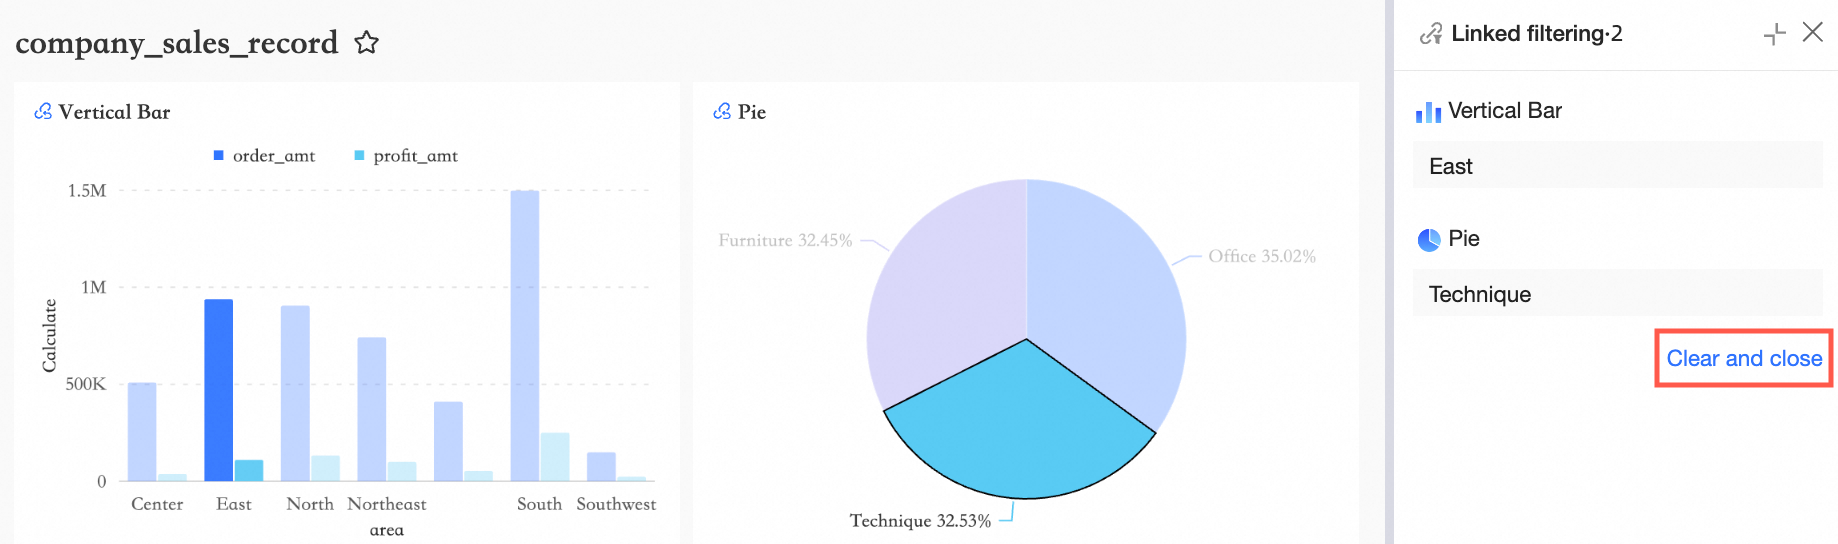
Assume that the Regional Order Sales Overview chart is already filtered to show data for the East China region. To further filter the view to show only Technology Products, click the Technology Products category in the linked Product Type Distribution chart. This enables bidirectional filter interaction.
You can then view the filter interaction status for both charts in the Filter Interaction Panel. For more information, see Filter Interaction Panel in this topic.
Custom Configuration for Automatic Filter Interaction
If you have enabled automatic filter interaction and linked the Region field, but need to link other fields for only the Regional Order Sales Overview chart, you can configure this in the chart's Filter Interaction Configuration dialog box.
Select the Order Sales Overview chart. On the Analysis tab, in the Data Interaction section, click the
 icon next to Filter Interaction.
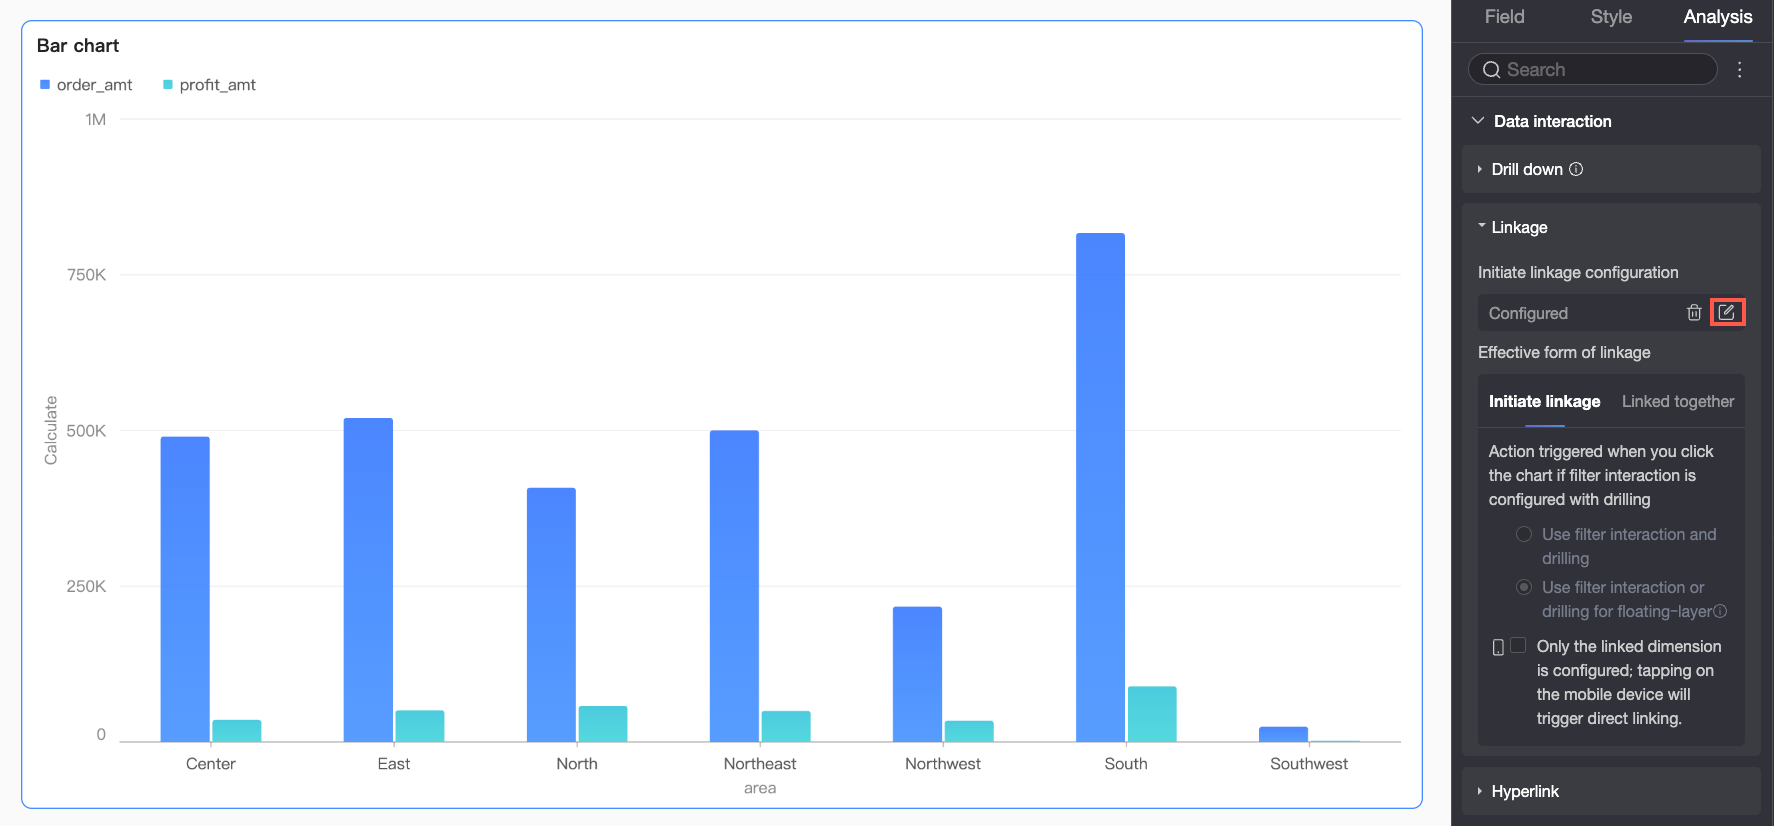
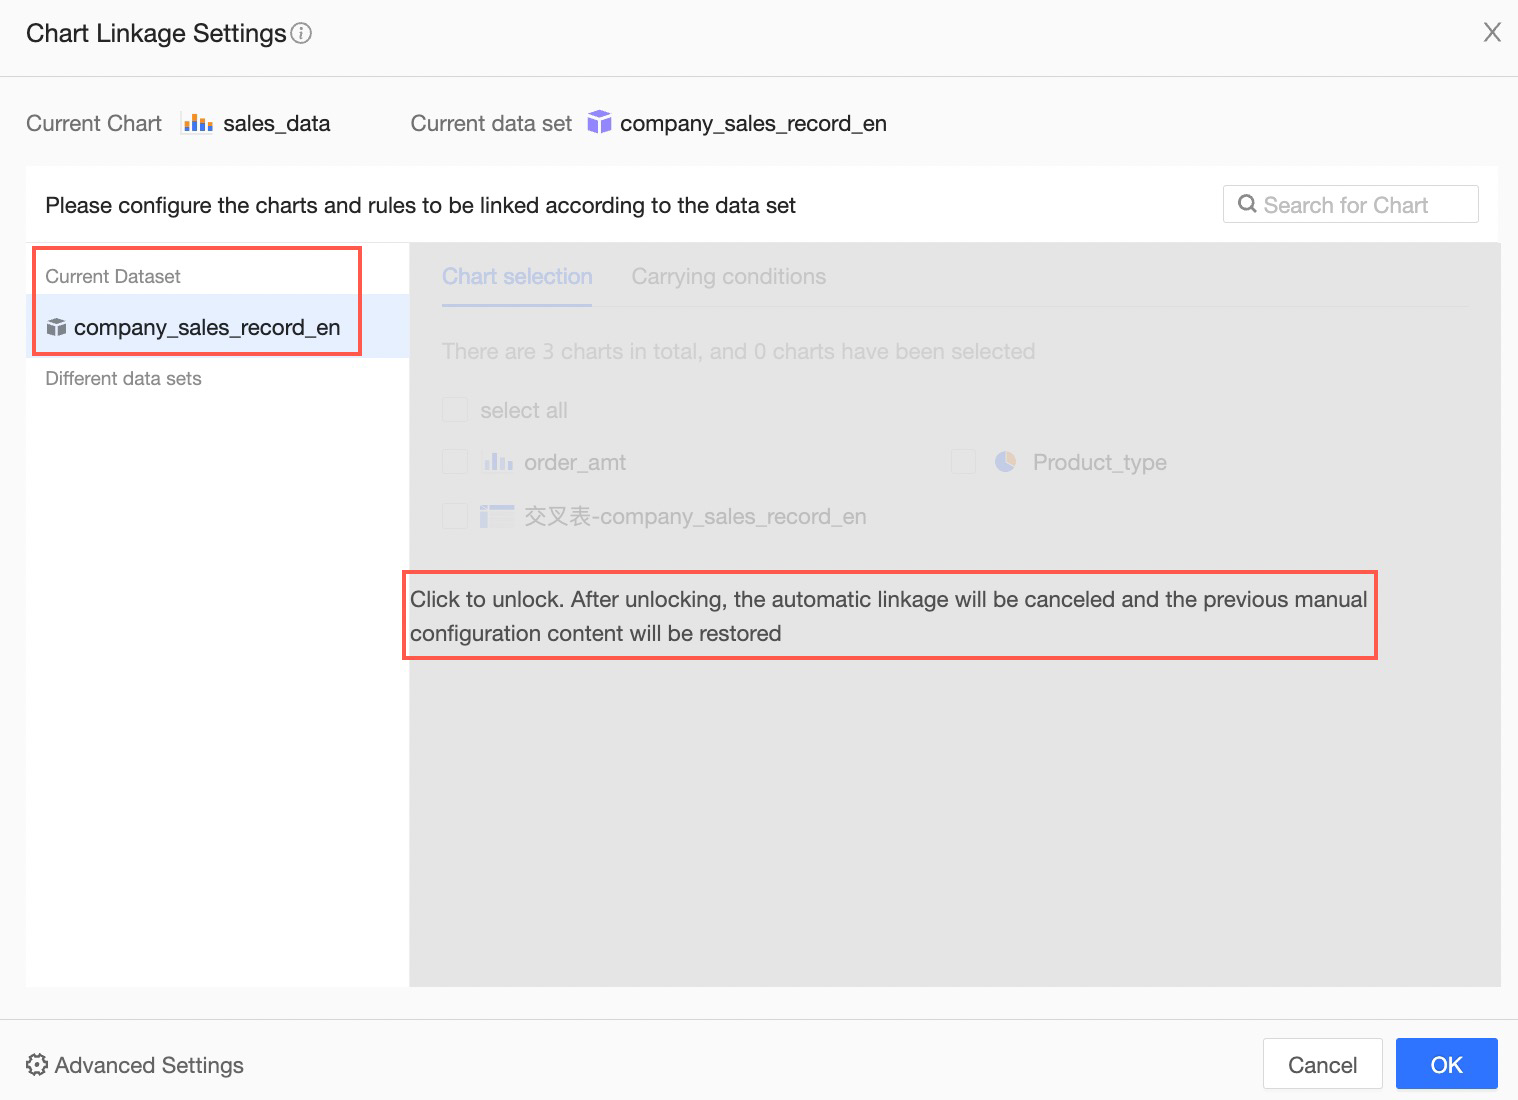
Under Automatic Filter Interaction, charts that use the same dataset are pre-configured for interaction. Click Unlock in the dialog box to modify the settings.
ImportantUnlocking disables automatic filter interaction. If you previously configured manual filter interaction, the settings revert to your last manual configuration.
After you unlock the settings, select the target charts. Click the
 icon next to each chart to customize the fields to link. After you finish, click Confirm.
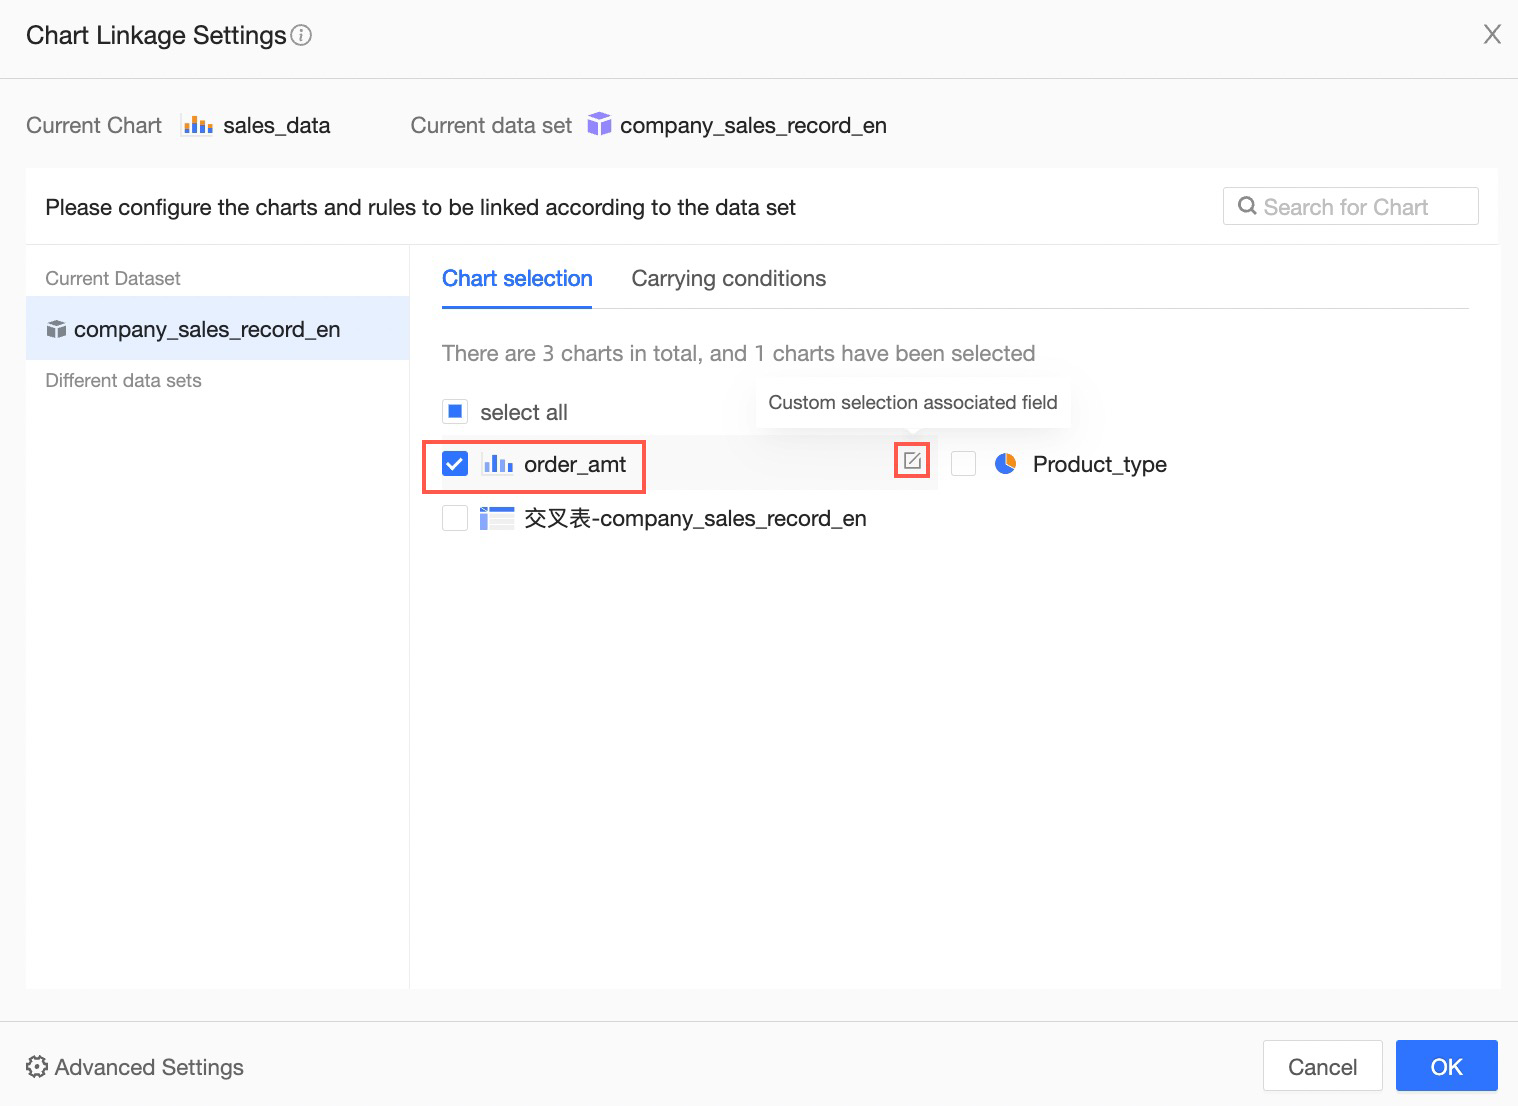
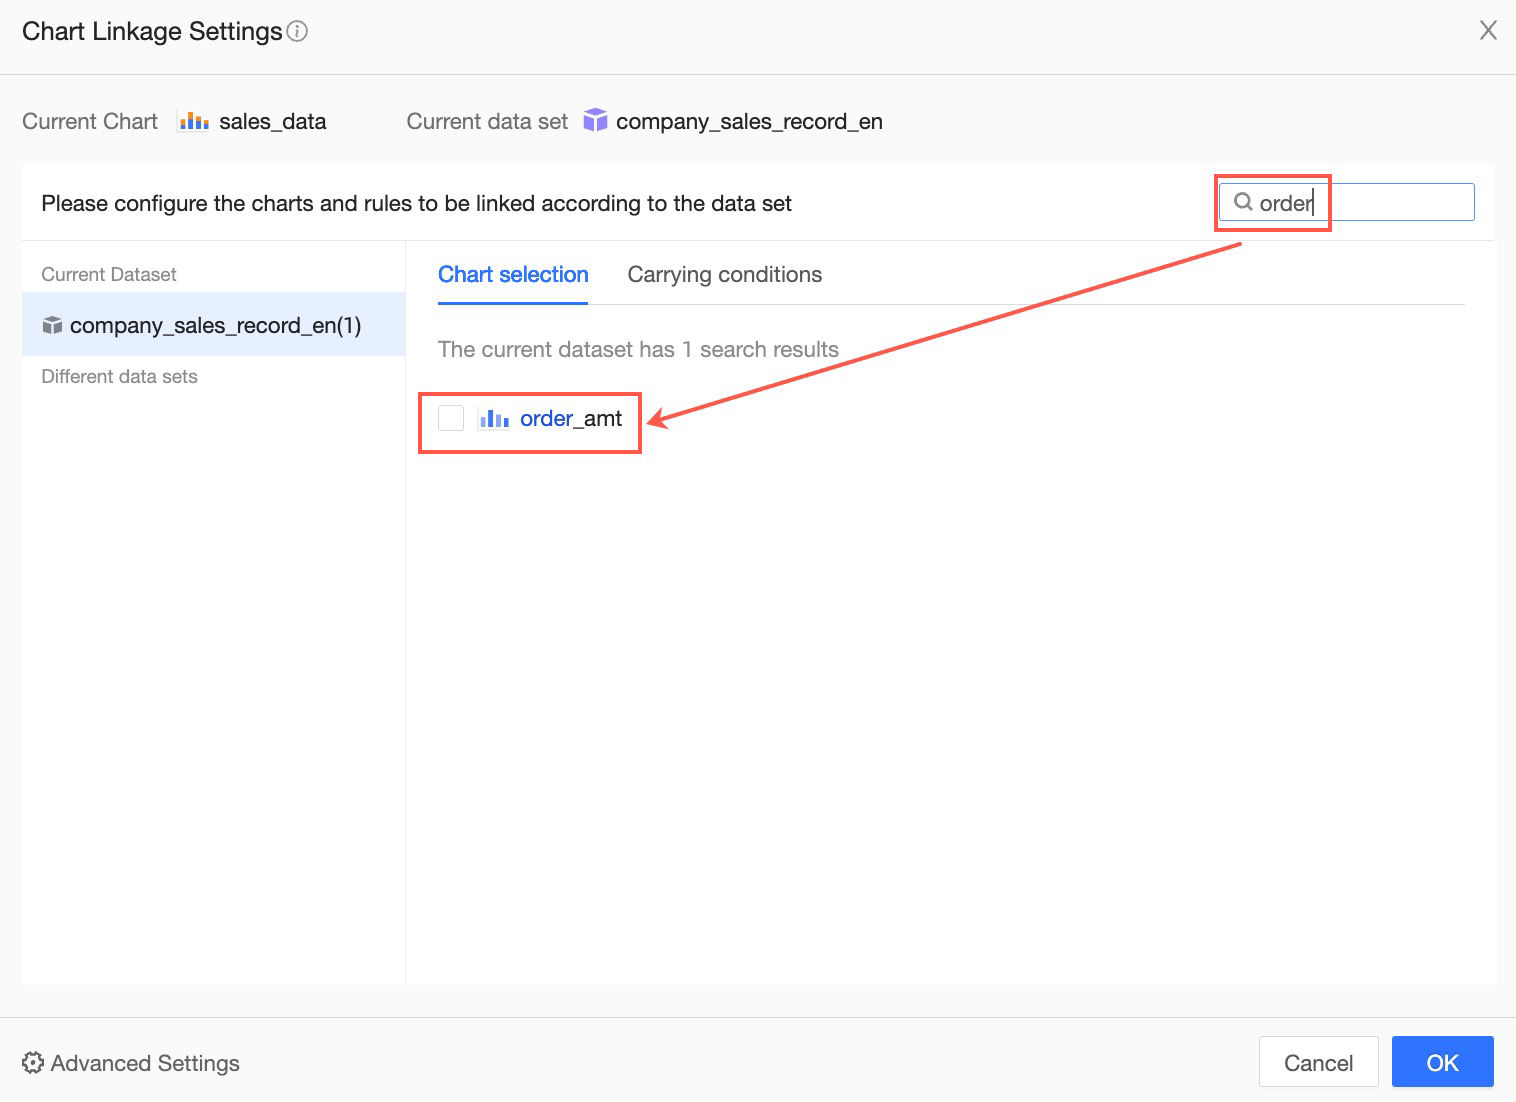
If your dashboard contains many charts, you can use the Search Box in the upper-right corner to find charts by name.
Configure Manual Filter Interaction
If automatic filter interaction is not enabled, you can configure filter interaction for individual charts in their Filter Interaction Configuration dialog box.
On the Analysis tab for the Regional Order Sales chart, click the
icon next to Linkage to configure the settings.
In the Chart Filter Interaction Settings page, select charts from the same or different datasets to link.
Same Dataset
If all the charts that you want to link use the same dataset, configure them on the Same Dataset tab. For example, select Regional Order Volume Overview and click Confirm.
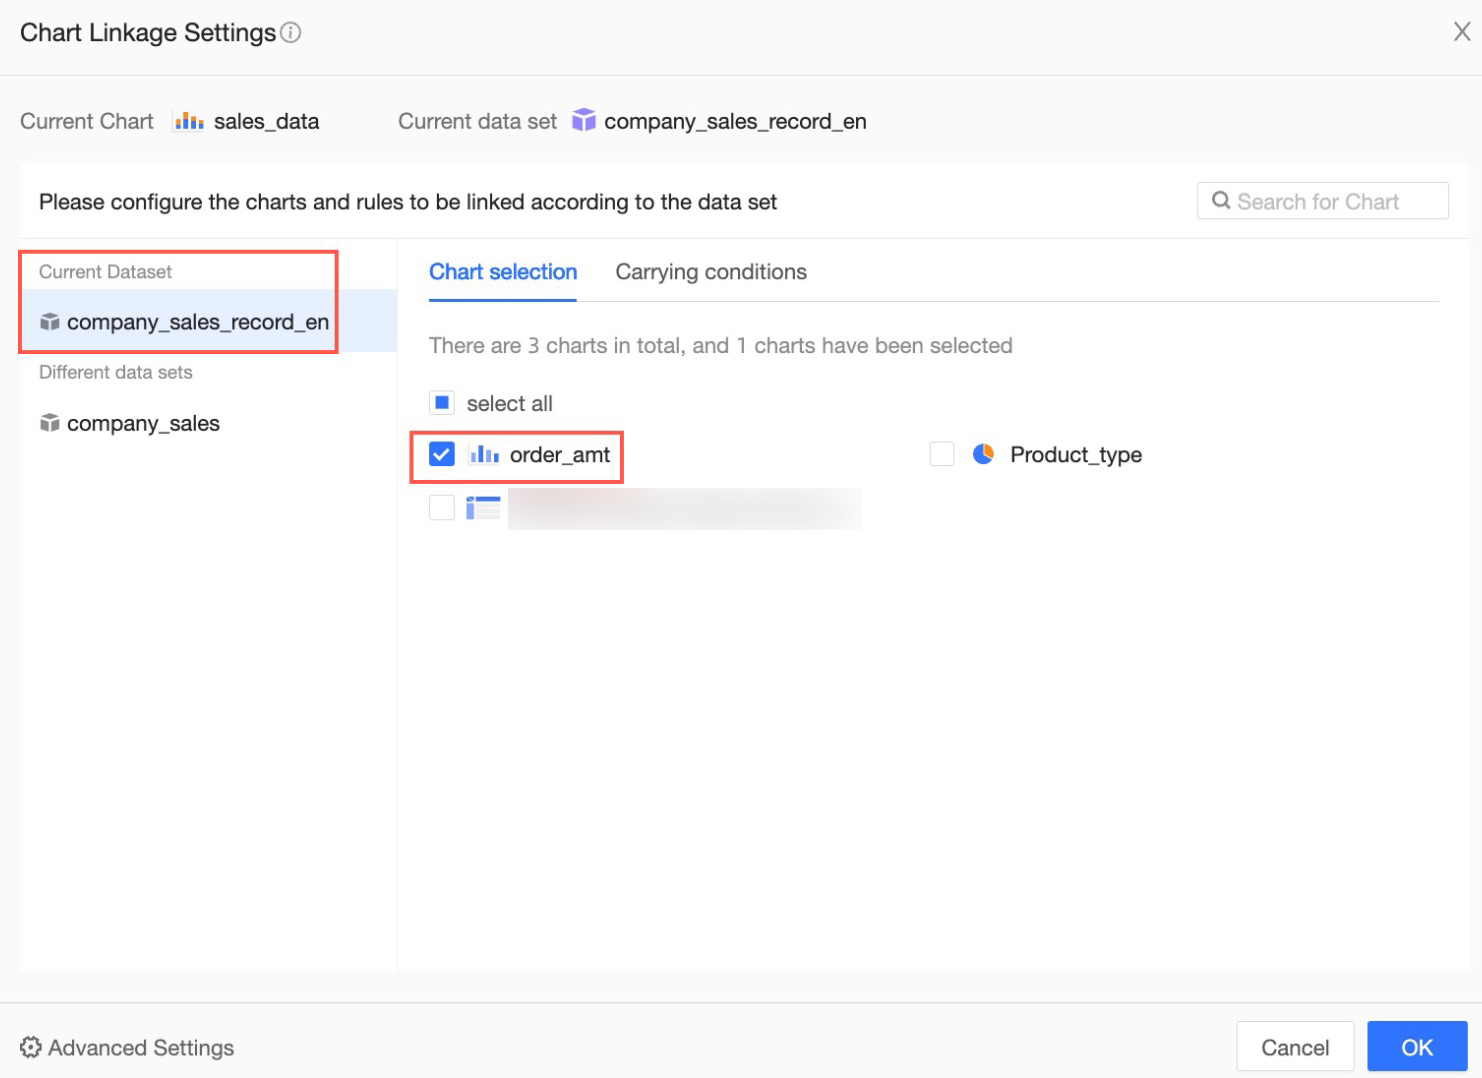
Different Datasets
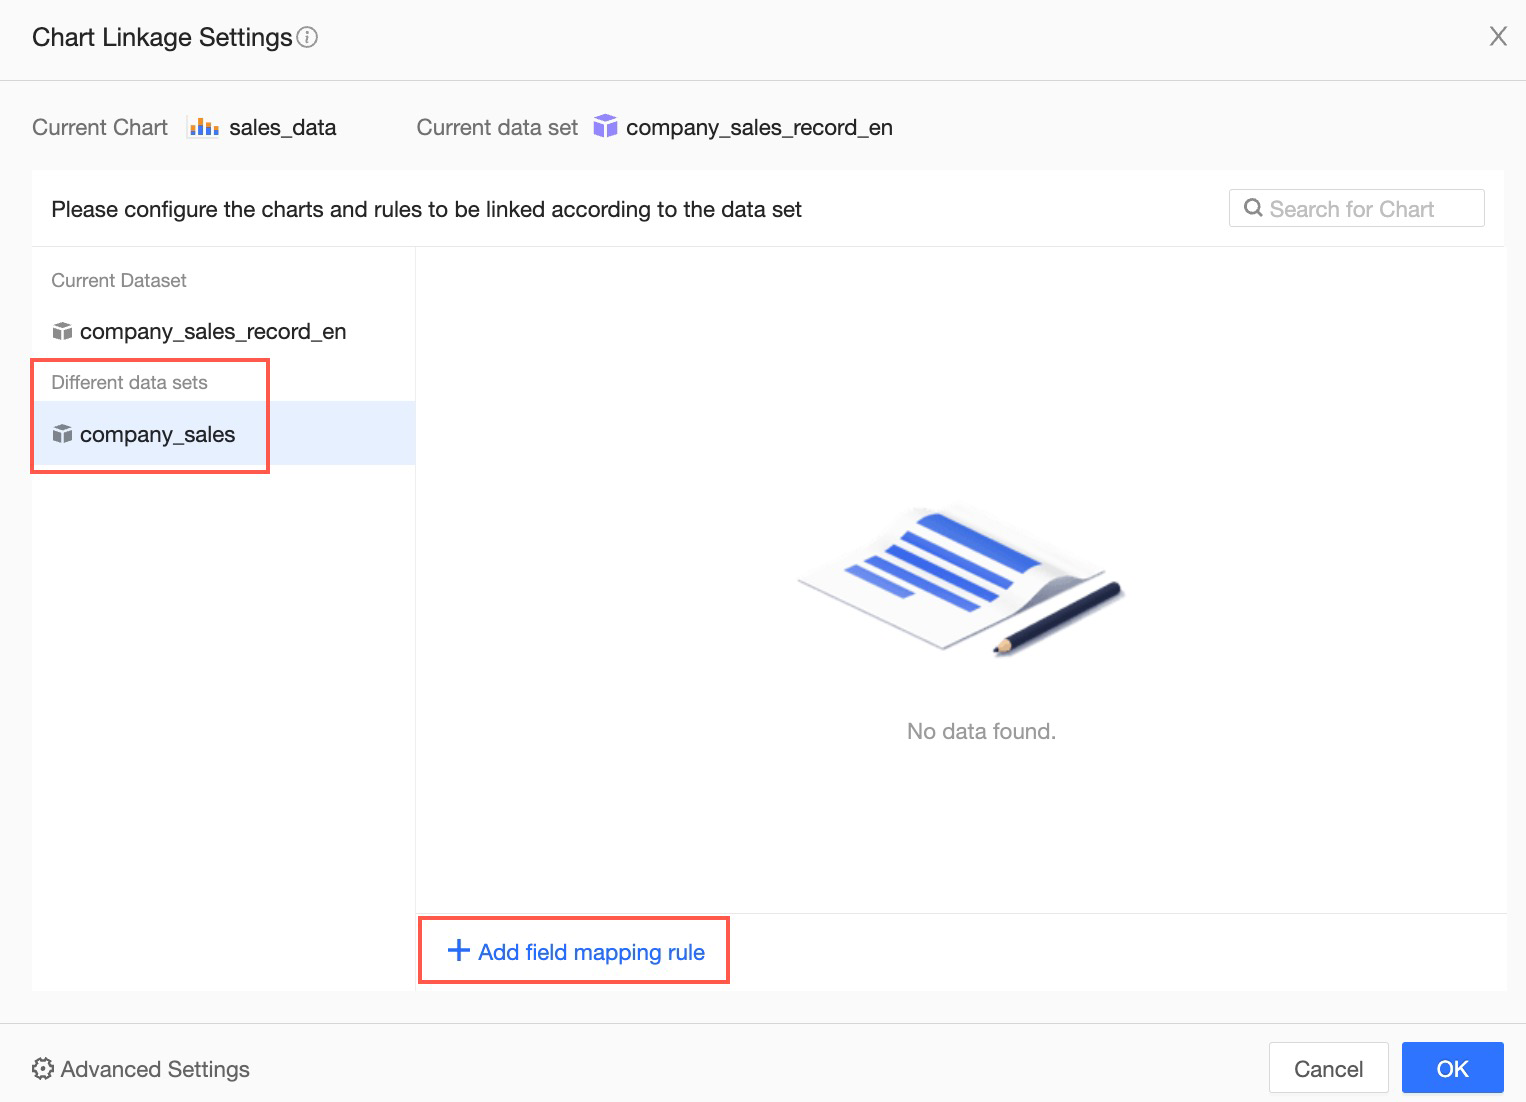
If the charts that you want to link use different datasets, you must configure field mapping rules on the Different Datasets tab.
Select the target dataset and click Add Field Mapping Rule, as shown below.
Customize the Mapping Field Name (①) and then click Save (②). After you save the rule, define the field mapping between the datasets (③) by selecting a field from the Current Chart Dataset and a corresponding field from the Linked Chart Dataset. Finally, select the charts to which you want to apply this mapping (④). Click Confirm in the lower-right corner (⑤). The result is shown in the following figure.
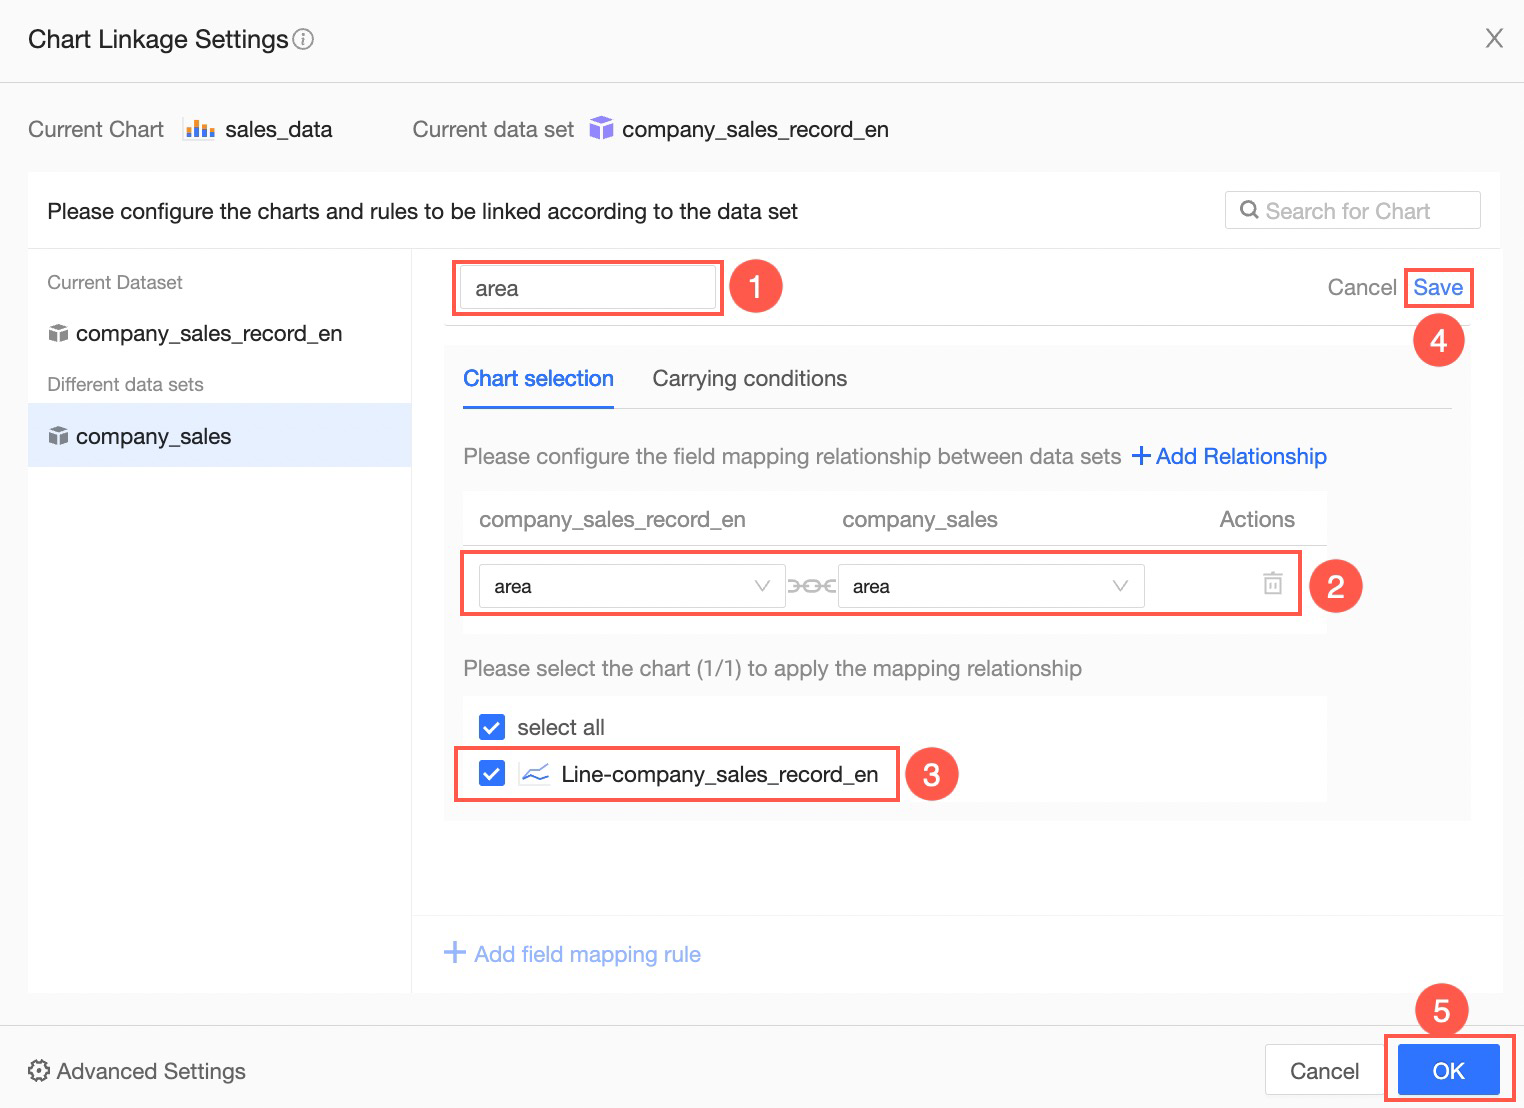
Chart Selection
You can select one, multiple, or all charts for filter interaction. If there are many charts, you can enter a chart name in the search box to find specific charts and select them from the results. You can also select all charts in the search results. For example, if you search for "Annual", four charts are returned. If you select all of them, filter interaction is applied to all four charts.
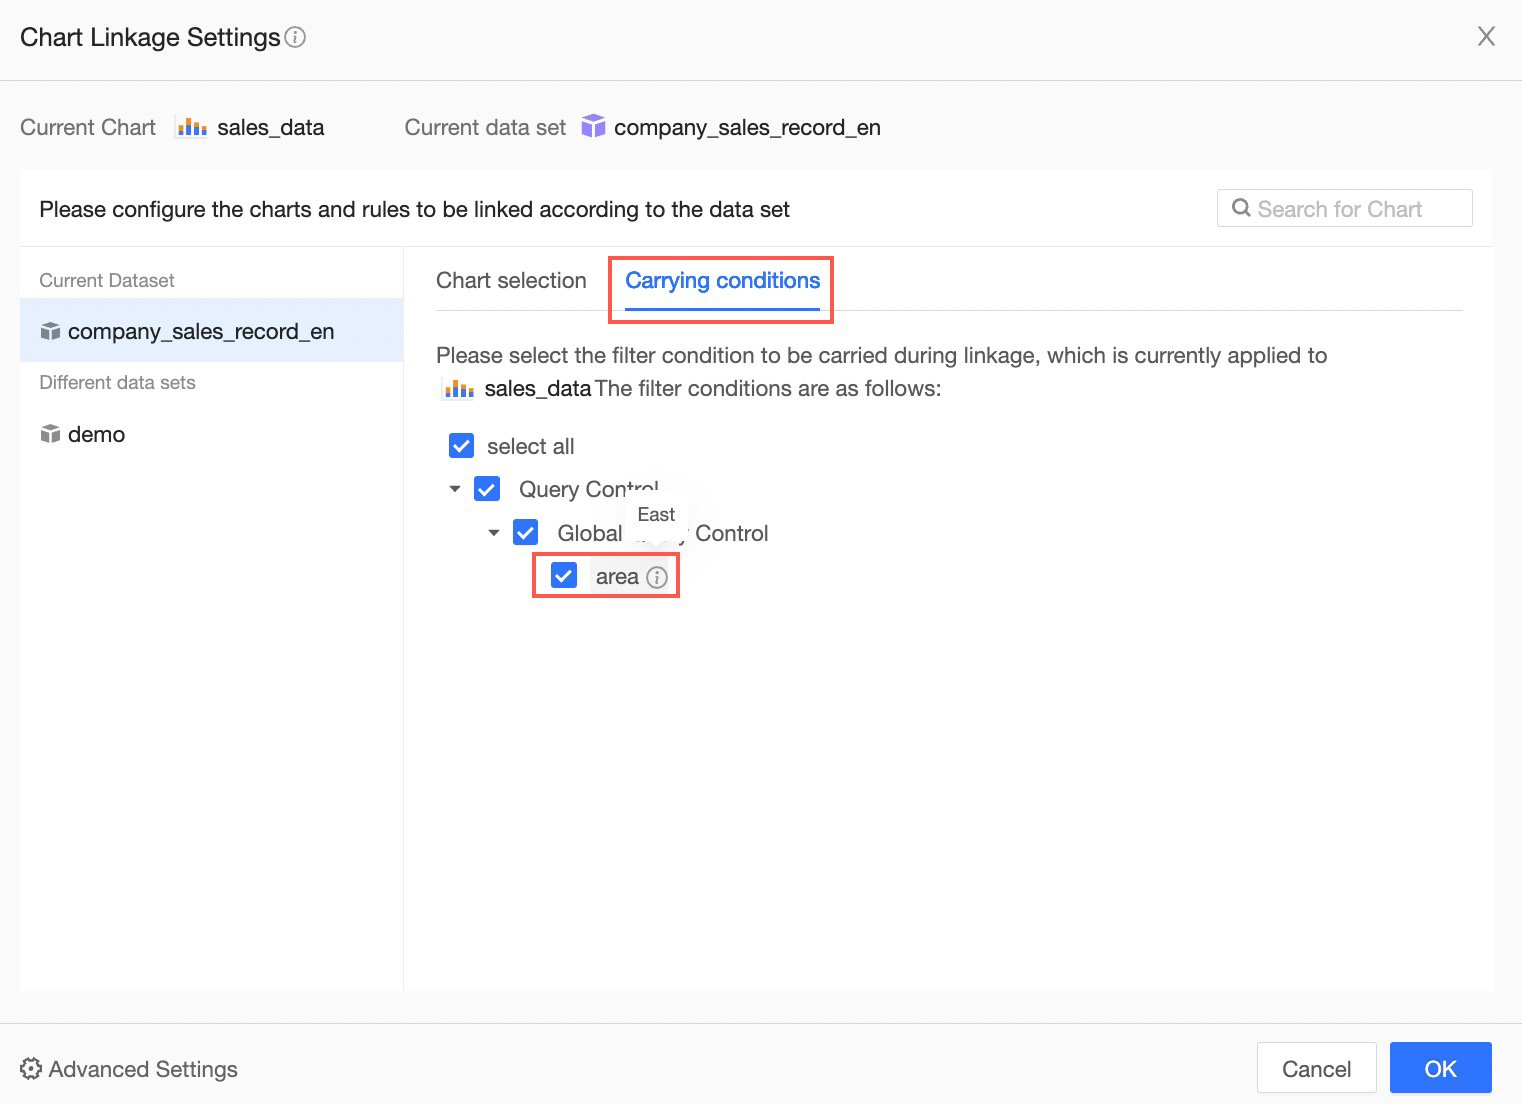
Carrying Conditions
If your dashboard includes query controls, you can select which query conditions to carry over during filter interaction in the Carry Conditions section. For example, to carry the condition where Region is East China, select the corresponding check box.
Configuration Result
When you click the East China region in the Regional Order Sales Overview chart, filter interaction is triggered. The Regional Order Data Overview chart, which uses the same dataset, updates to show data for East China. The cross table, which uses a different dataset, also updates to show data where the area field is East China.
Configure Filter Interaction Behavior
You can set how charts globally trigger and respond to filter interaction.
On the dashboard editing page, click Page Settings in the upper-right corner. On the Advanced tab, navigate to Interaction Control > Filter Interaction > Filter Interaction Behavior to configure the global rules.
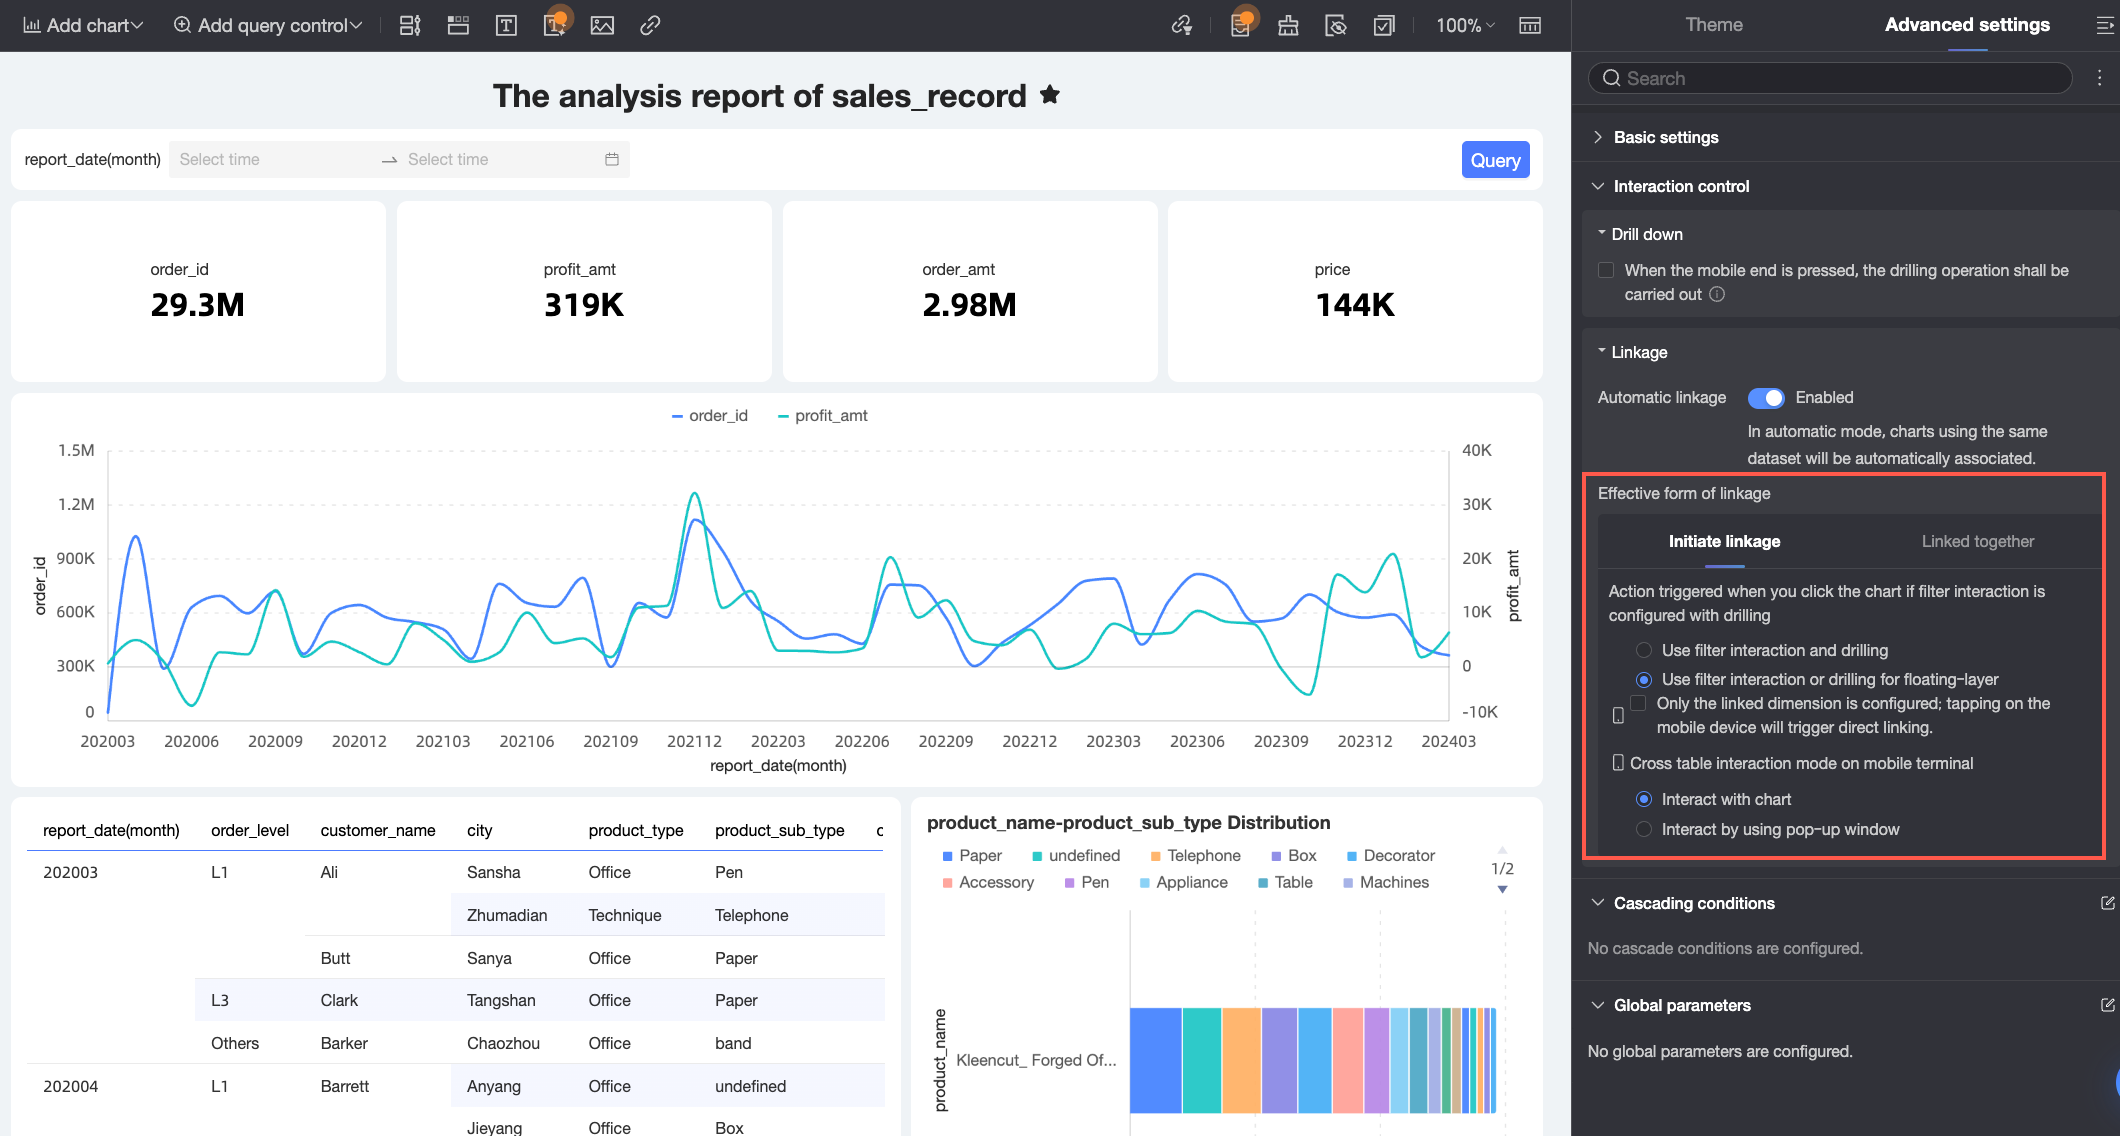
On the Trigger tab, you can set how source charts initiate filter interaction. The supported options are as follows:
Configuration
Description
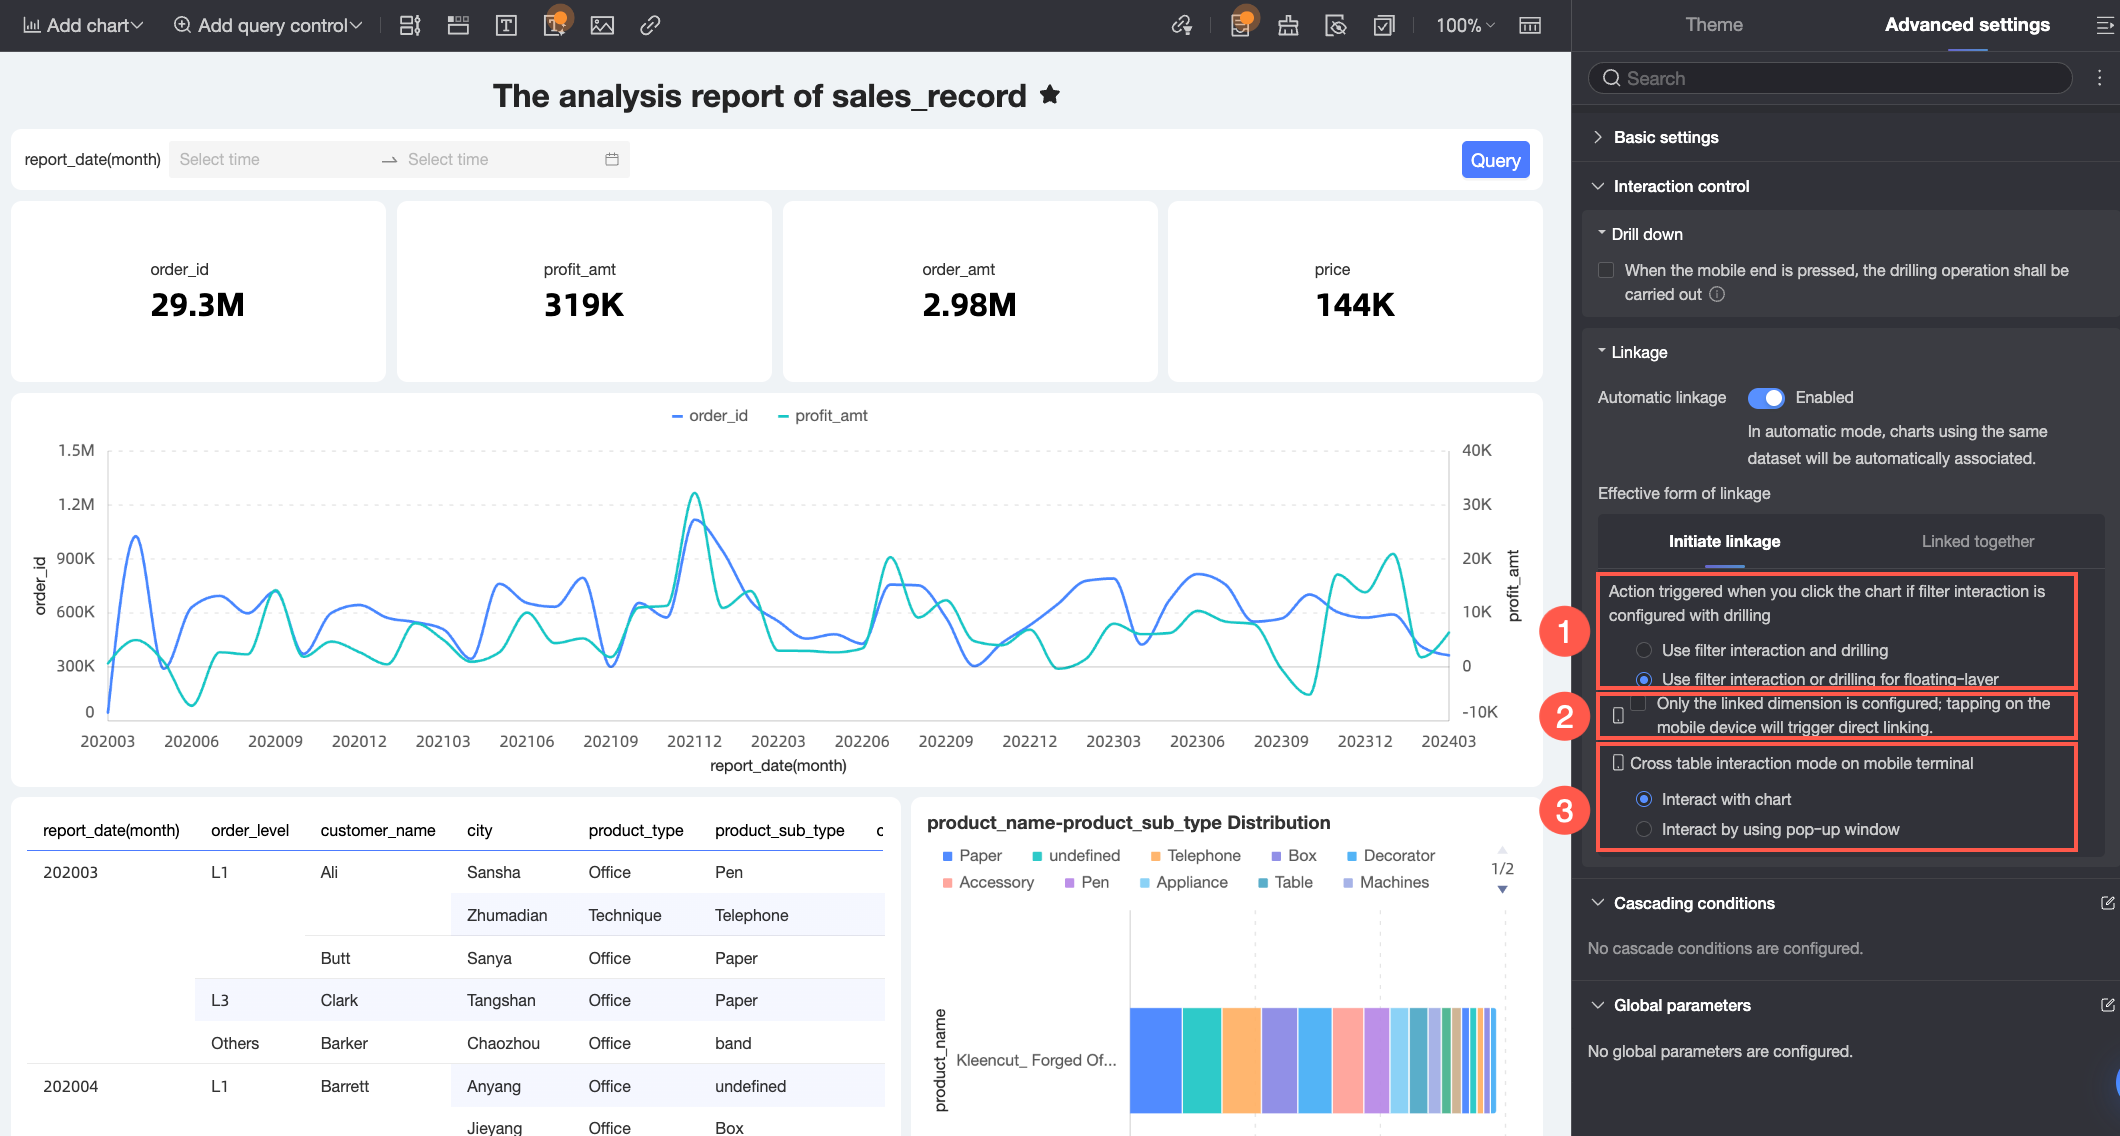
① Trigger method
Set how filter interaction is triggered when the dimension also has drill down configured.
Apply simultaneously: Clicking a data point triggers both drill down and filter interaction at once.
Floating layer selection for drill down or filter interaction: Clicking a data point shows a floating layer where the viewer chooses between drill down or filter interaction.
② Mobile trigger method
Set how filter interaction is triggered on mobile when a chart dimension has only filter interaction (no drill down or navigation).
When selected, it uses direct filter interaction: clicking a data point immediately filters all linked charts based on that value.
When not selected, it uses manual trigger: clicking a data point highlights it and shows filter interaction options in a floating layer or tooltip; you must confirm to apply.
NoteFor detailed tables and scorecards with only filter interaction configured, the default trigger method is direct filter interaction.
③ Mobile cross table trigger method
Set how cross tables trigger filter interaction on mobile.
Direct filter interaction: Applies filter interaction directly in the dashboard based on the viewer's selection.
Popup filter interaction: Shows a popup where filter interaction is applied based on the viewer's selection.
On the Response tab, you can set how linked charts display data after a filter interaction is received. The supported options are as follows:

Configuration
Description
① Response method
Set the global response method for filter interaction: filter-based or highlight-based.
Filter-based interaction: Charts filter data to show only values matching the interaction condition.
Highlight-based interaction: Charts highlight matching data points while keeping all other data visible.
② Interaction and drill down handling
Set how charts handle filter interaction when they are already drilled down.
Clear: Clears the current drill down state and reapplies filtering or highlighting based on the interaction condition.
Preserve: Keeps the current drill down state and applies filtering or highlighting on top of it.
To configure the filter interaction behavior for an individual chart, navigate to its Analysis tab and adjust the settings in the Data Interaction section.
For example, if the global response method is set to filter-based interaction but you want certain column/bar or pie/doughnut charts to display all data while highlighting specific data points, you can set those charts to use highlight-based interaction on their Analysis tab.
 Note
NoteIf the Response Method in Page Settings differs from the setting in a chart's Data Interaction configuration, the chart uses its own Data Interaction setting.
You must first configure drill down for a chart before you can set its trigger method for dimensions that have drill down configured. If drill down is not configured, this option is unavailable.
Cancel Filter Interaction
You can cancel filter interaction in the following ways.
Cancel Filter Interaction in the Filter Interaction Panel (Batch Operations)
Desktop
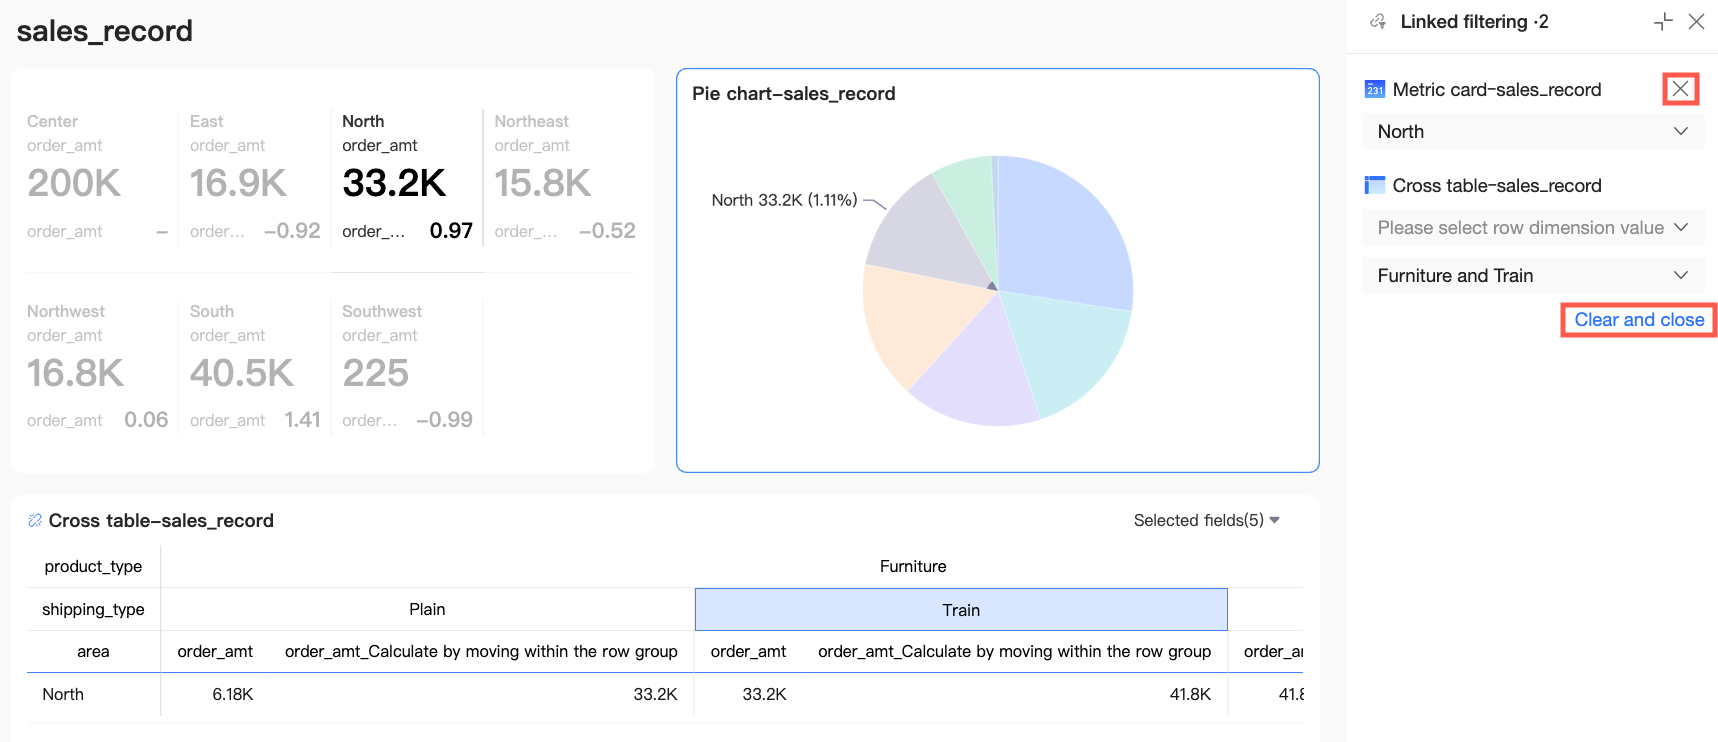
Open the filter interaction panel on the dashboard. You can delete individual filter interaction items or clear all items at once.
Clear a single item: To cancel a filter interaction, click the
 icon in the upper-right corner of its panel.
Clear all items: To remove all filter interaction settings, click Clear and Close. For more information, see Filter Interaction Panel in this topic.
Mobile
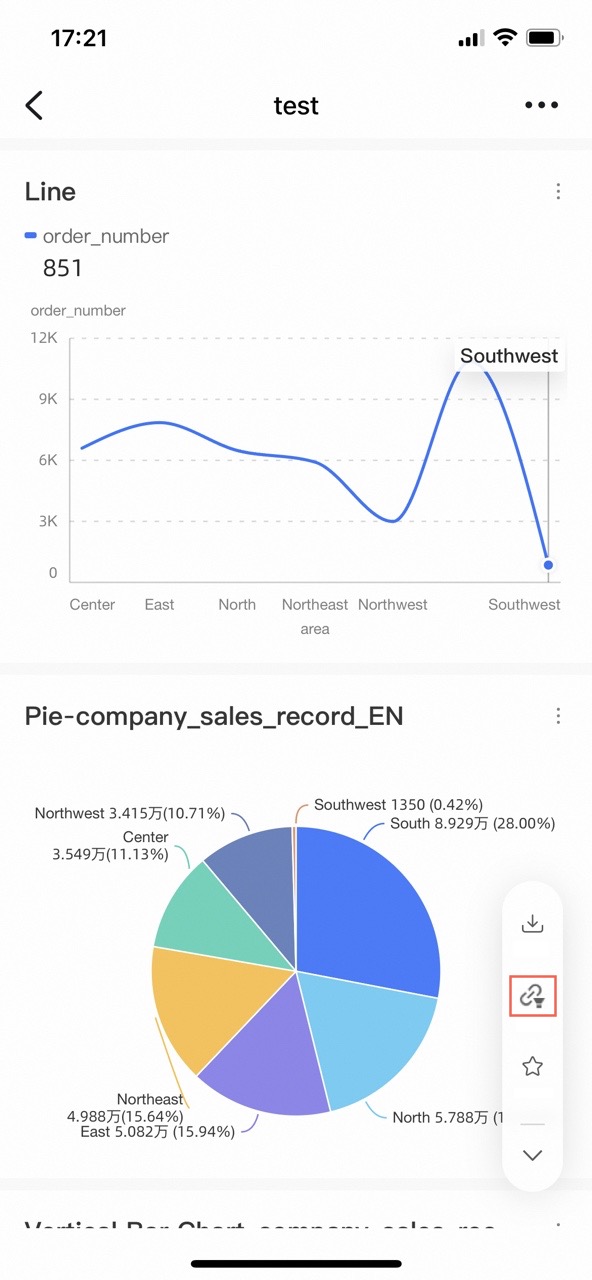
In the mobile preview interface, tap the Filter Interaction icon in the feature menu on the right to clear all filter interaction records.
Cancel Filter Interaction in a Chart
Click the
 icon in the upper-left corner of the chart that you want to unlink to cancel the filter interaction.
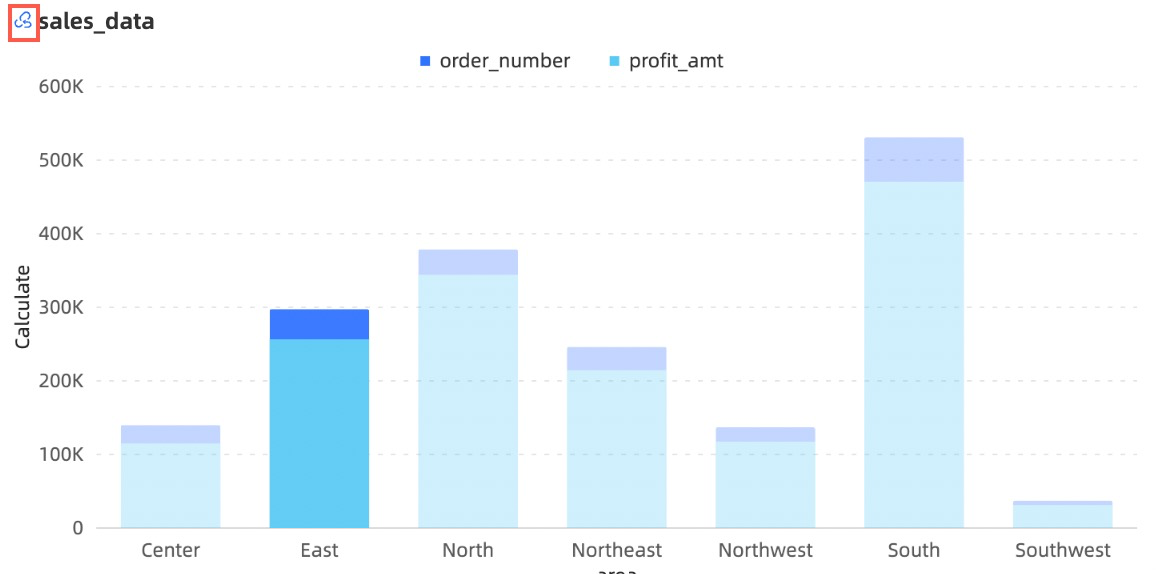
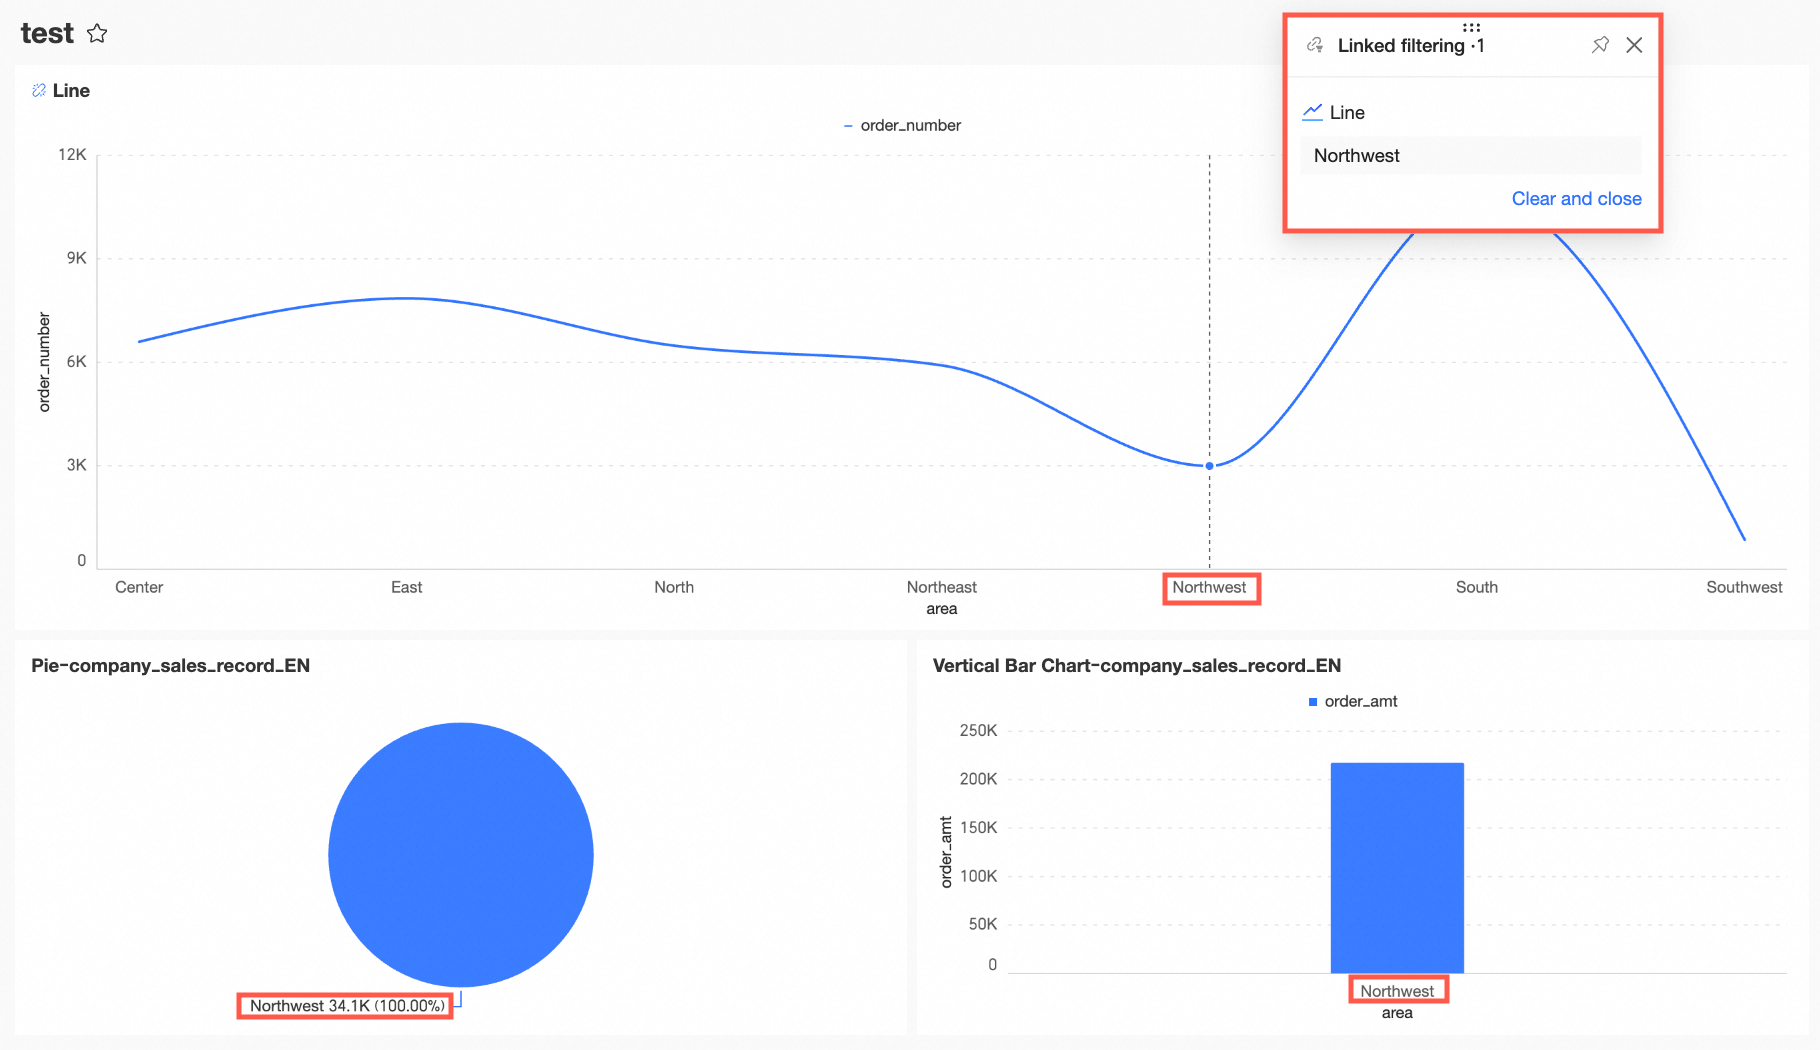
Alternatively, you can click any blank area of the chart to cancel the filter interaction, as shown in the following figure:
Filter Interaction Panel
The filter interaction panel shows the source chart and its current filter values. This helps users understand the active filter relationships during analysis. The panel also acts as a dynamic controller. If you switch values in the panel, all linked charts are instantly updated. You can also clear unwanted filter values directly from the panel.
How to open
You can open the filter interaction panel from either the dashboard editing or preview page.
Dashboard editing page
Click the
 icon in the toolbar to open the filter interaction panel.
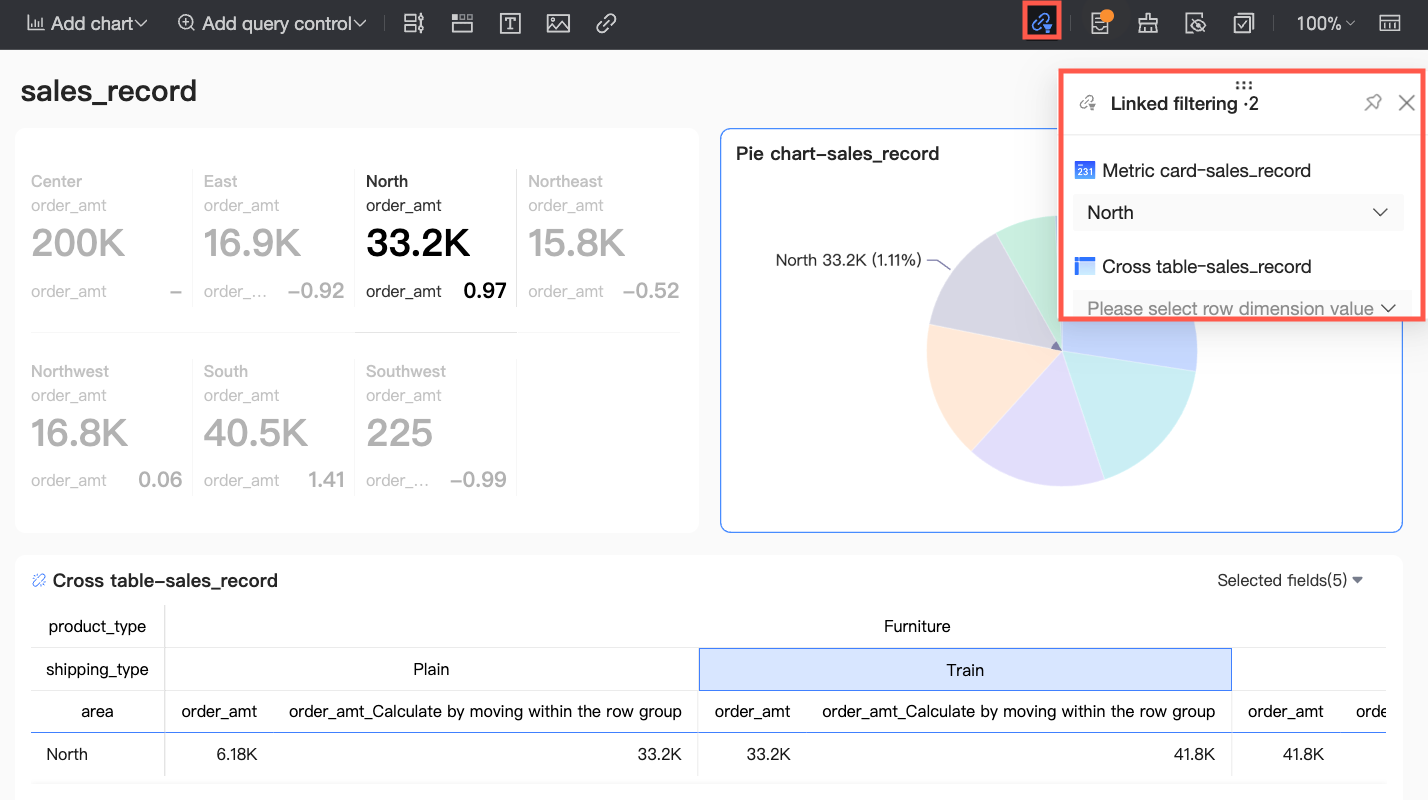
Dashboard preview page
Click the
 icon in the lower-right toolbar to open the filter interaction panel.
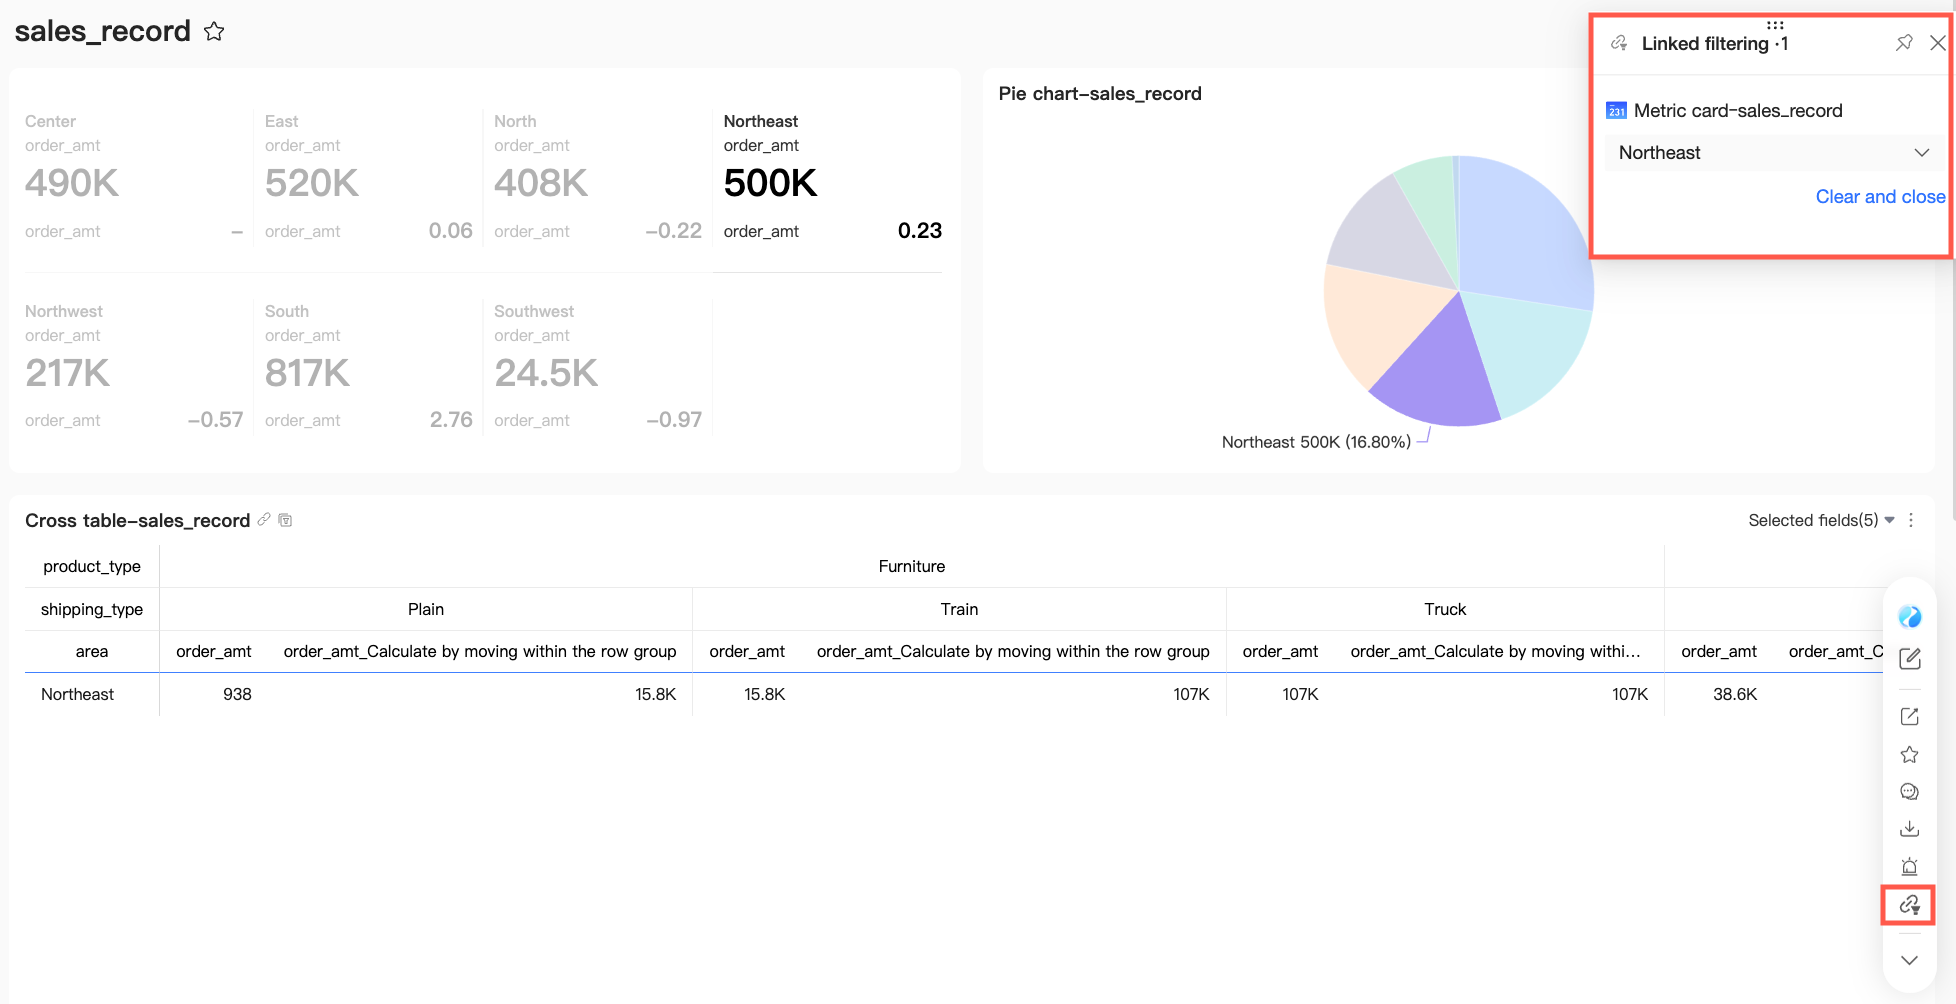
Operations
The filter interaction panel supports the following actions.
Procedure | Description |
Move and resize panel | To reposition the floating filter interaction panel, hover over the
|
Resize panel | To change the panel size, drag its edges. |
Pinned panel | Click the
|
Switch filter values | Switch the source chart's filter value in the panel to dynamically shift your analysis perspective. For example, when analyzing regional sales, switch the Region dimension value to quickly compare performance across regions. |
Clear Interactive Filter Value | Clear individual or all filter interaction items from the panel.
|
Configure Synchronized Drill Down
When a dimension field used for filter interaction also has drill down configured, setting the trigger method to Apply Simultaneously executes both drill down and filter interaction at once. However, linked charts remain at their original analysis level and do not drill down to match the source chart’s new level.
In practical analysis scenarios, you may need linked charts to follow the source chart’s drill down path. This allows a single action to synchronize multiple charts to the same level of detail. You can use synchronized drill down to achieve this. When you drill down in one chart, all linked charts that use the same dimension field automatically drill down to the corresponding level. The following table provides a comparison.
Apply Simultaneously only | Apply Simultaneously + Synchronized Drill Down |
Linked charts remain at their original analysis level. After you click Northeast in the source chart, the chart drills down to the province level. However, the linked charts remain at the region level and cannot show shipping costs by province within the Northeast region.
| Linked charts follow the source chart’s drill down level. After you click Northeast in the source chart, the chart drills down to the province level. The linked charts also drill down to show shipping costs by province within the Northeast region.
|

Prerequisites
Make sure that your charts meet the following conditions. Otherwise, linked charts apply only the filter interaction and do not drill down.
Dataset configuration: Linked charts must use the same dataset as the source chart.
Field configuration: The linked charts must have the same initial drill down field configured as the source chart. For example, both charts use Region as the initial level. The dimension field must also support drill down. Drill down is not supported in the following cases:
Group dimensions and dimension groups do not support drill down.
Hidden drill down fields in cross tables do not support drill down.
Chart limitations
The linked charts must support drill down. For example, metric trend charts do not support drill down. For a list of supported charts, see Drill Down > Limits.
The linked charts must accept the dimension field type that is passed by the source chart. For example, map charts require geographic dimension fields.
If a cross table has auxiliary fields configured, synchronized drill down charts carry only the base drill down field, not the auxiliary fields.
Trigger method configuration: Synchronized drill down works only when the trigger method is set to Apply Simultaneously. It is not supported if the trigger method is set to Floating Layer Selection for Drill Down or Filter Interaction.
Procedure
Assume that you want to configure synchronized drill down between the source chart Regional Order Sales Overview and the linked chart Regional Shipping Cost Overview. When you click Northeast in the source chart and drill down to the province level, the linked chart also drills down to show shipping costs by province within the Northeast region. To do so, perform the following steps.
In the dashboard editing page, add two blank column charts and configure their fields.
Because linked charts must use the same dataset and the same initial drill down field as the source chart, use the Sales Dataset and configure the Region field for both charts.

Configure drill down for the Region field in both charts.
Click the
 icon next to the Region field, select Apply Simultaneously in the dialog box that appears, and then click Confirm.
 Note
NoteSynchronized drill down requires the Apply Simultaneously option. If you do not select this option, linked charts apply only the filter interaction and do not drill down.
For more information about drill down configuration, see Drill Down.
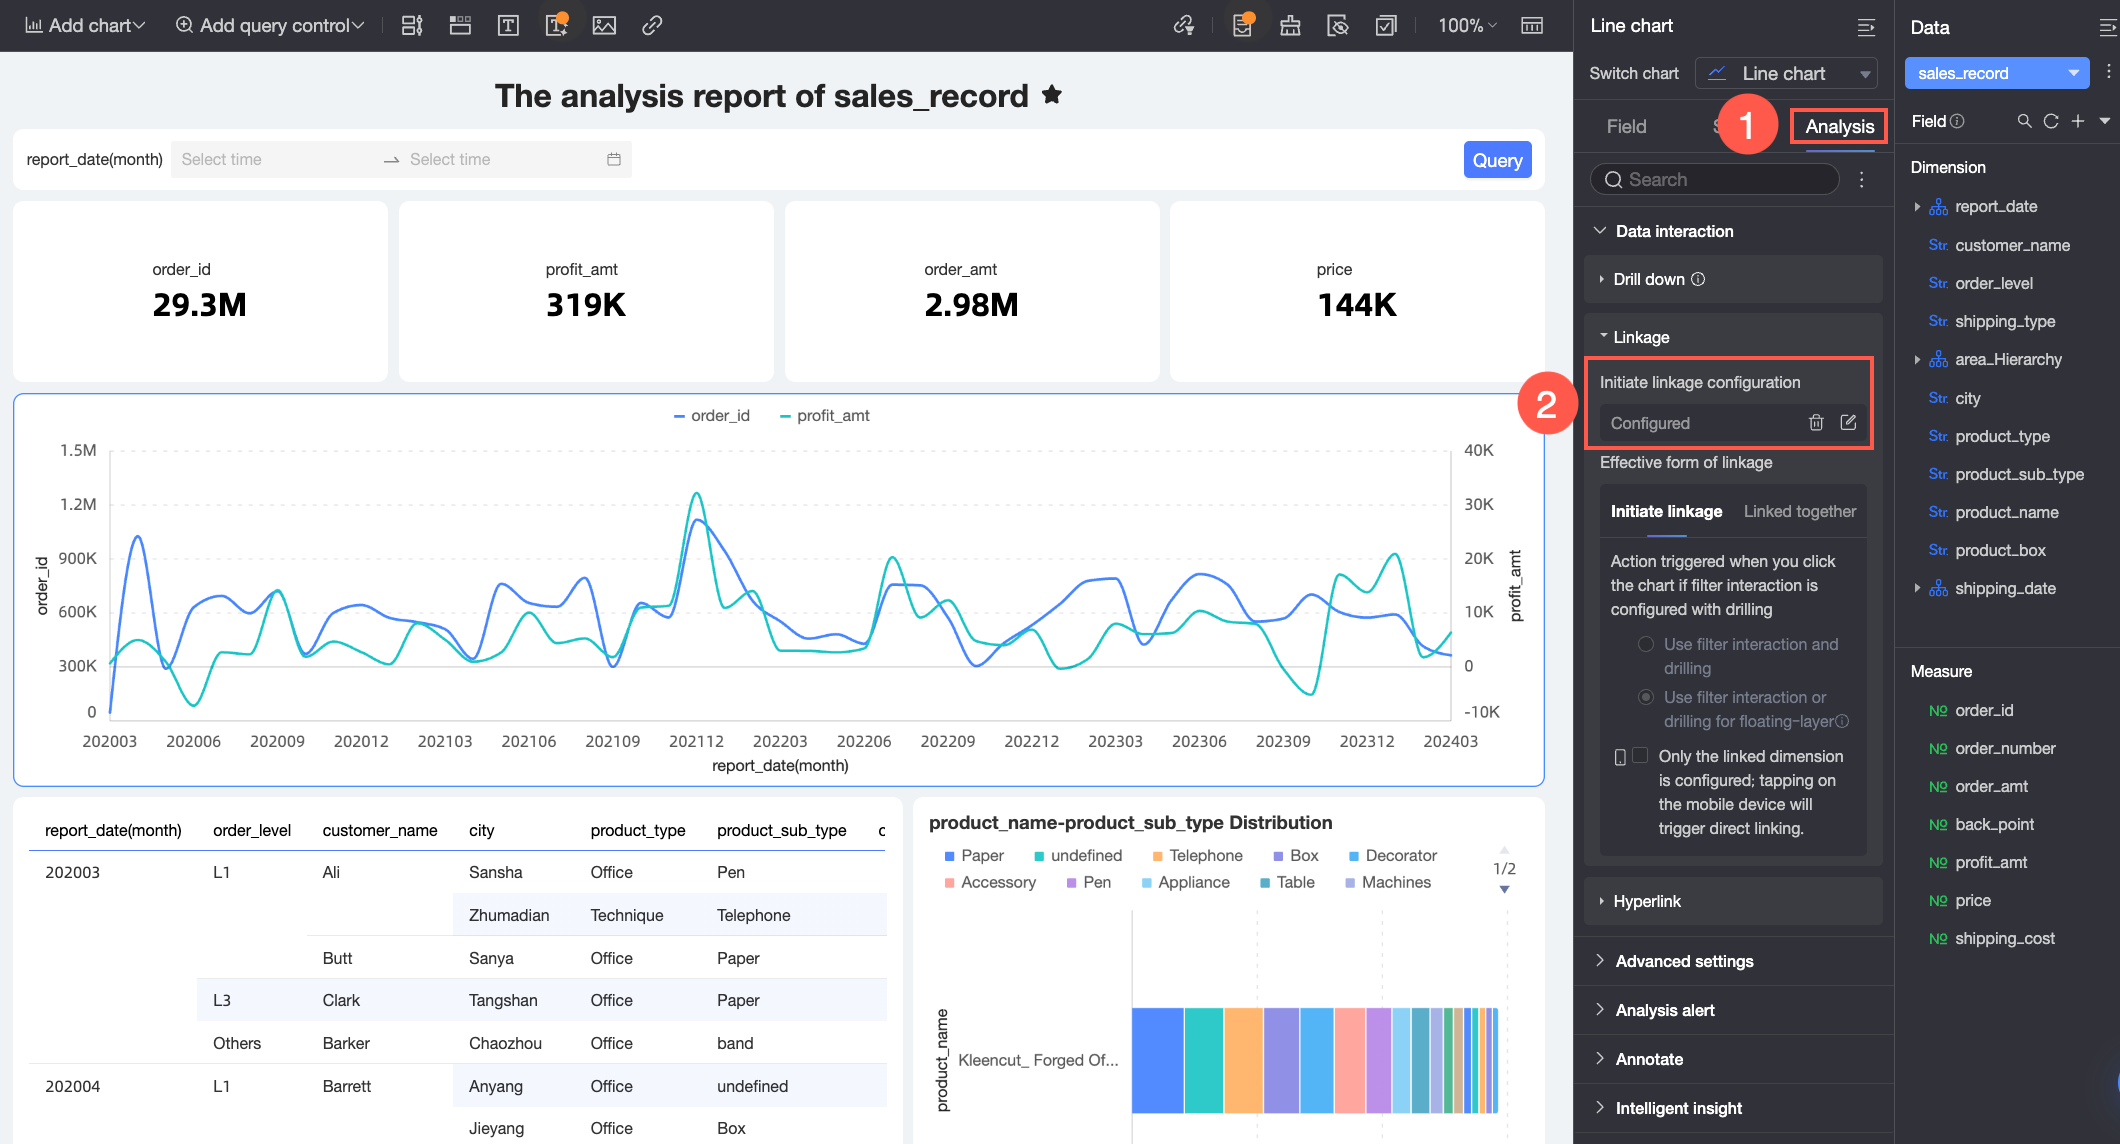
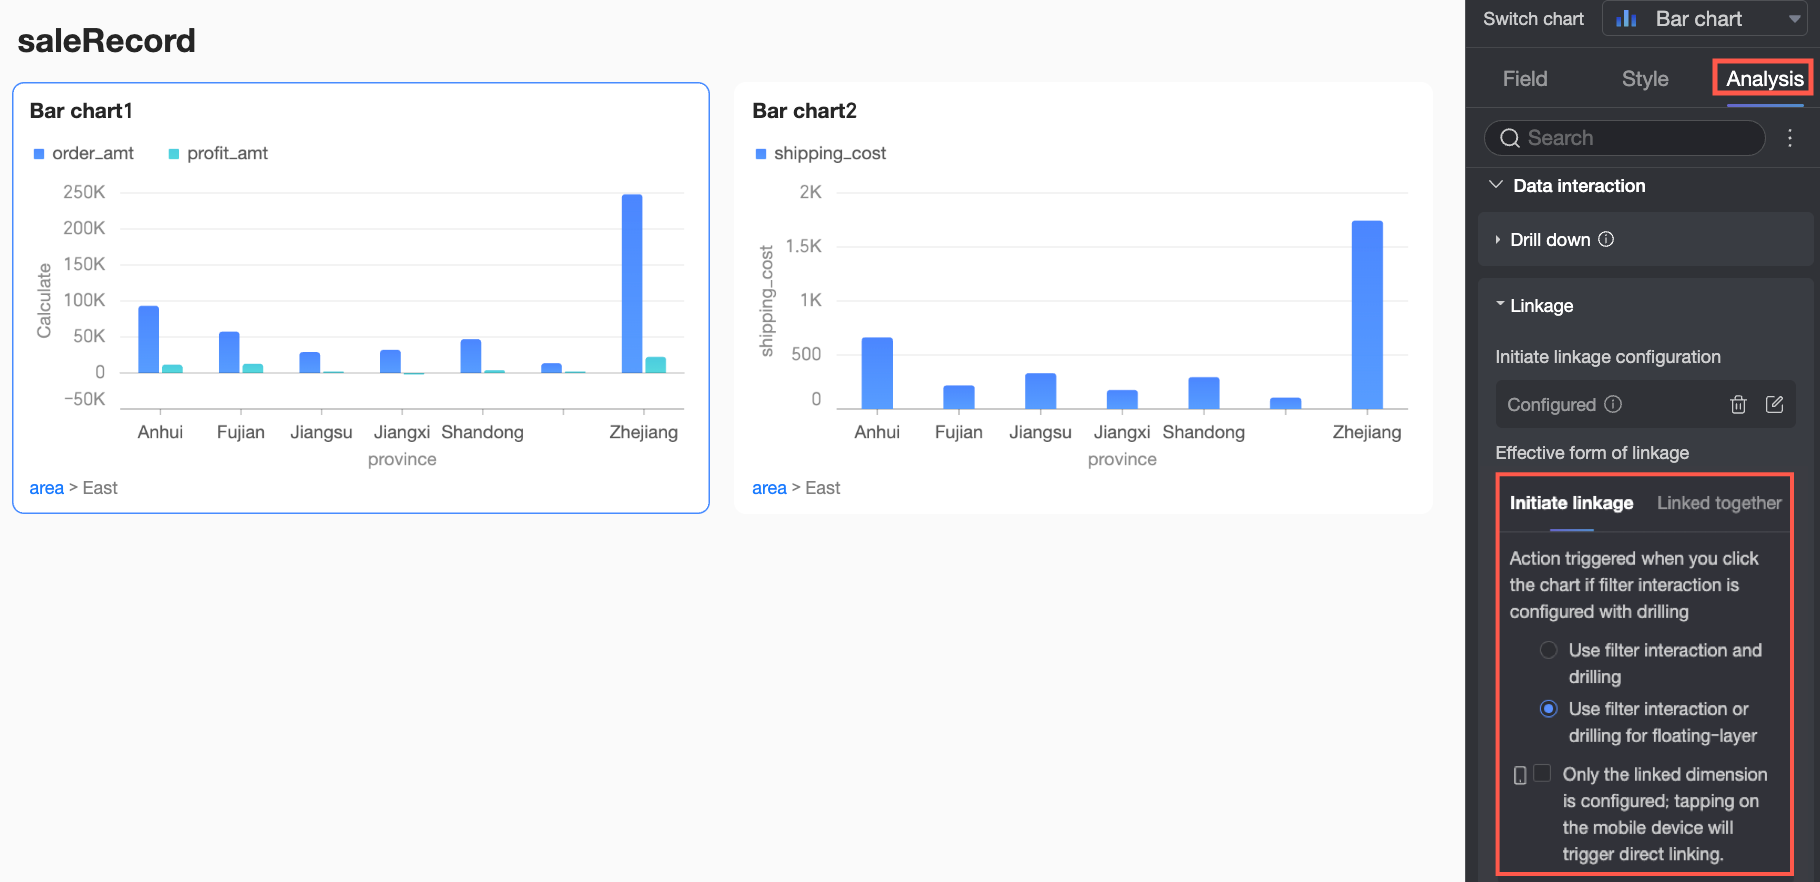
In the Analysis panel of the main linkage chart, under Data Interaction > Linkage, configure the method for activating linkages.
Set the trigger method to Apply Simultaneously and select Apply drill down to linked charts simultaneously to enable synchronized drill down.
 Note
NoteWhen synchronized drill down is active, the Clear option under When chart is already drilled down during filter interaction is unavailable. Synchronized charts default to the Preserve option.

After you complete the configuration, the final result is: When you select the Northeast region in the main chart, the main chart drills down, and the linked chart automatically drills down to the provincial dimension for the Northeast region.