After entering the data visualization screen, use Quick BI’s screen configuration and widget configuration tools to manage your screen and its widgets. This topic describes the screen’s UI layout and feature configuration to help you quickly understand and use widgets for data analytics.
UI regions
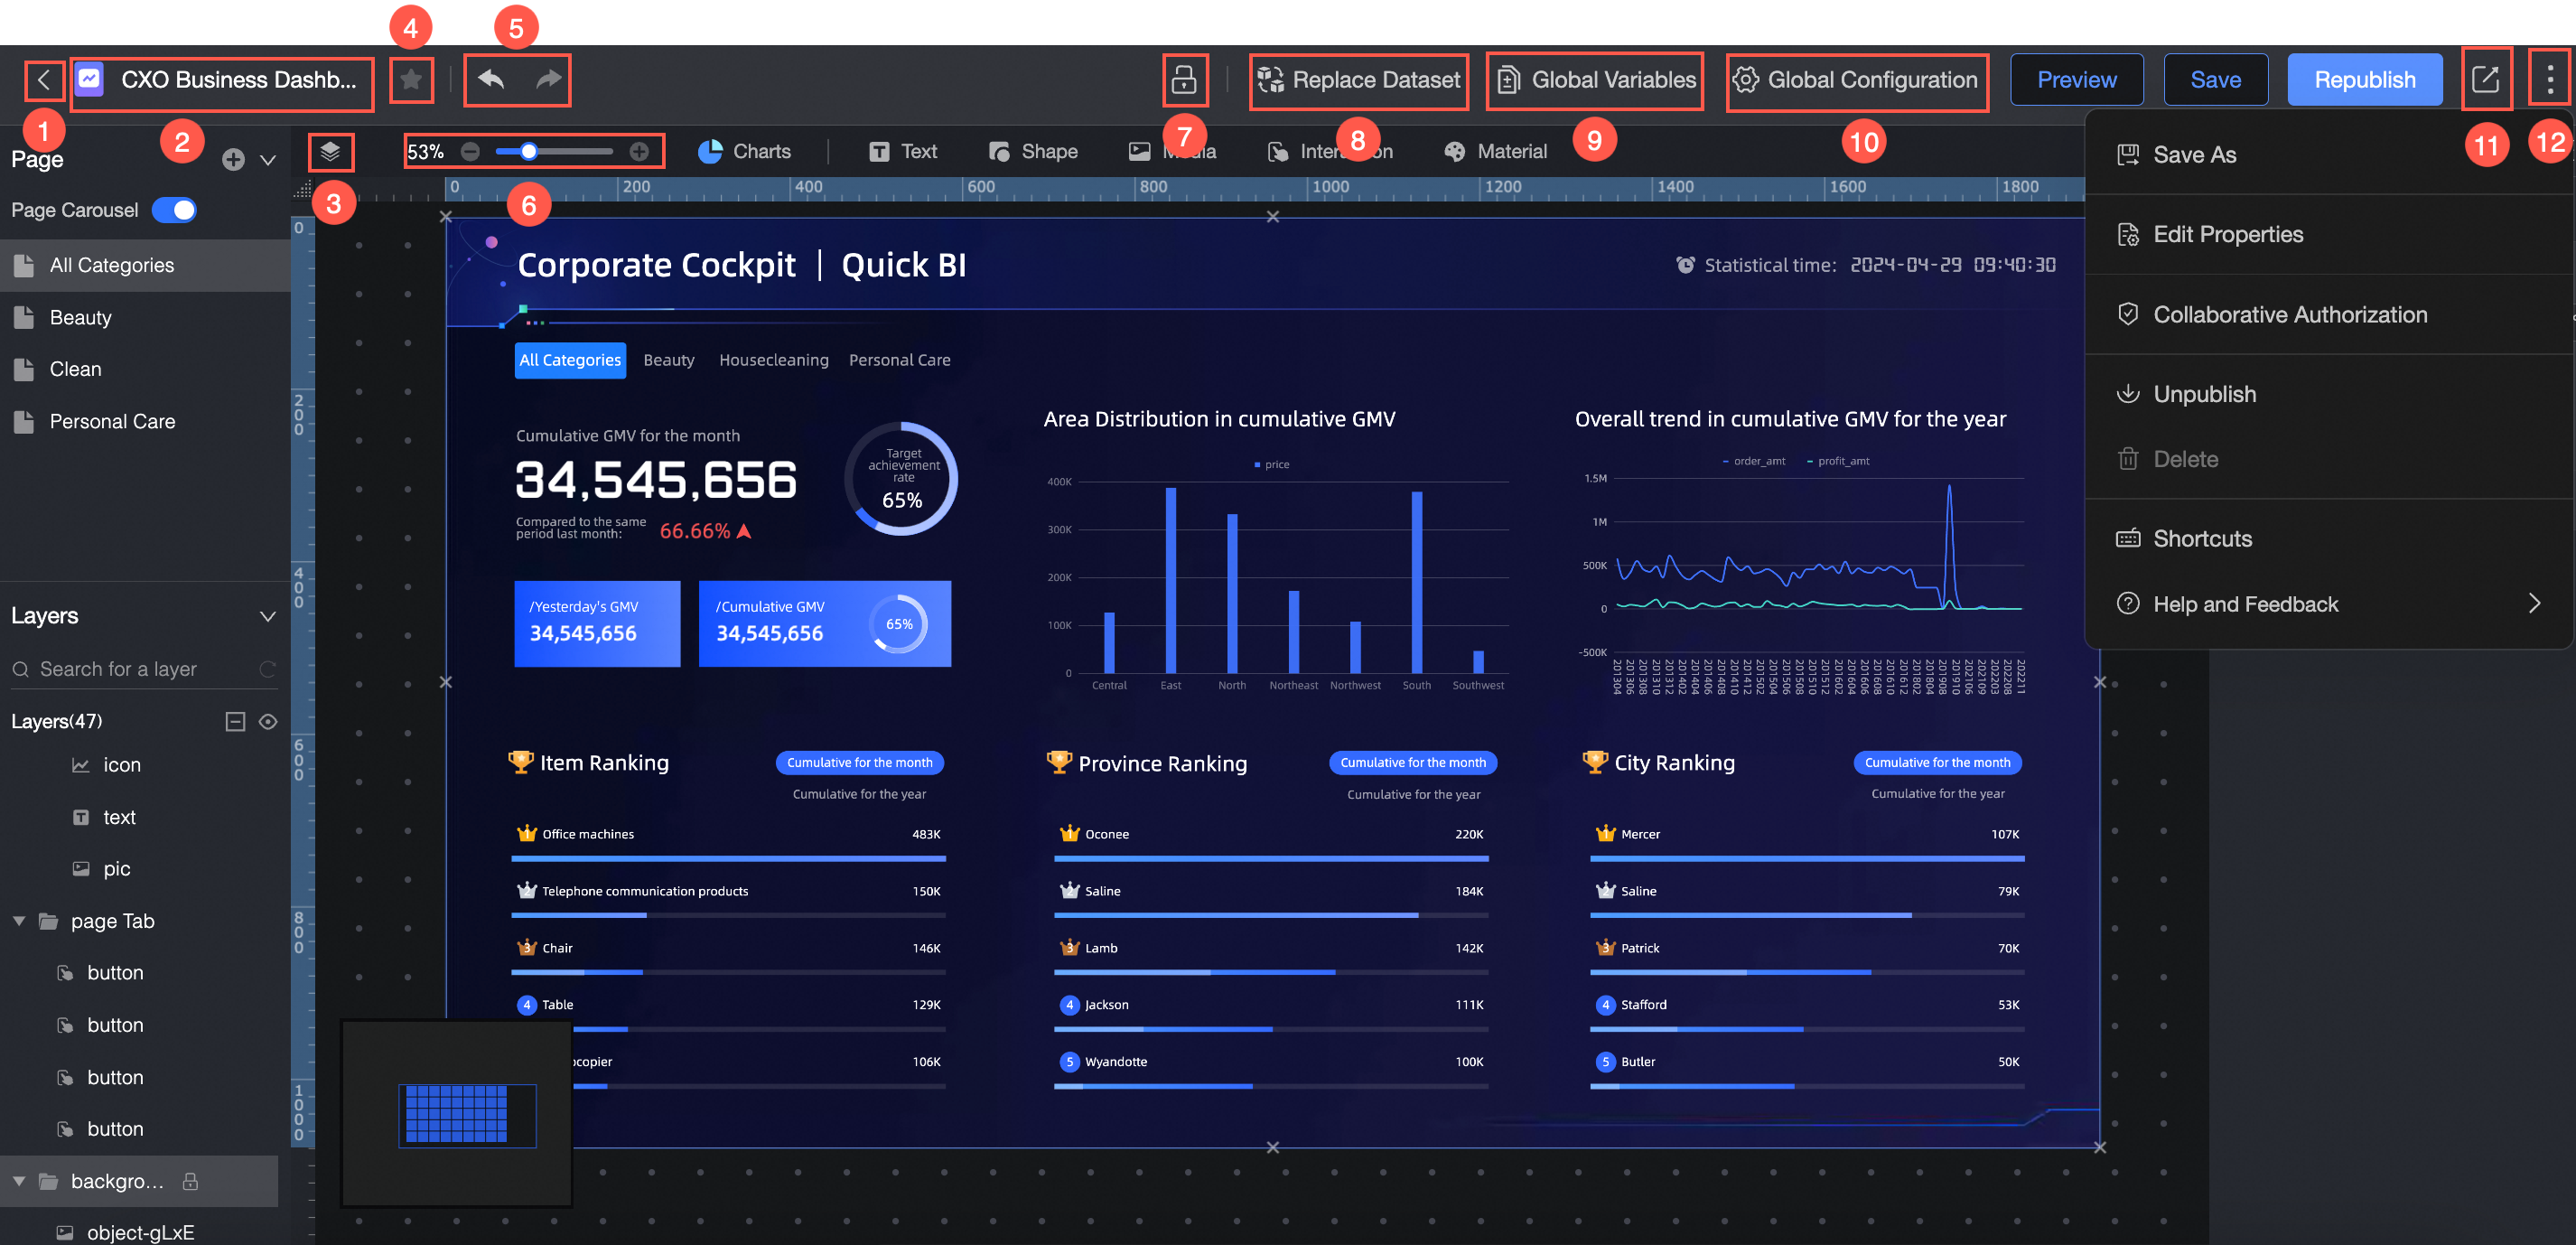
In the toolbar, customize the screen name, adjust the scale, add to favorites, undo or redo changes, lock the screen, replace the dataset, configure global parameters and global settings, or share the screen.
Choose from eight chart types plus rich text, shapes, media, interactive controls, and assets to meet diverse screen-building needs.
Add pages, set page carousels, or delete pages.
Support multiple layers. Group layers, set layer carousels, lock layers, or hide layers.
Adjust canvas layout. Cut, copy, lock, hide, or group widgets on the canvas.
Add data to a widget and configure its style.
Select datasets, add data, modify data formats, or transform data.
Toolbar
In the toolbar, do the following:
Go back.
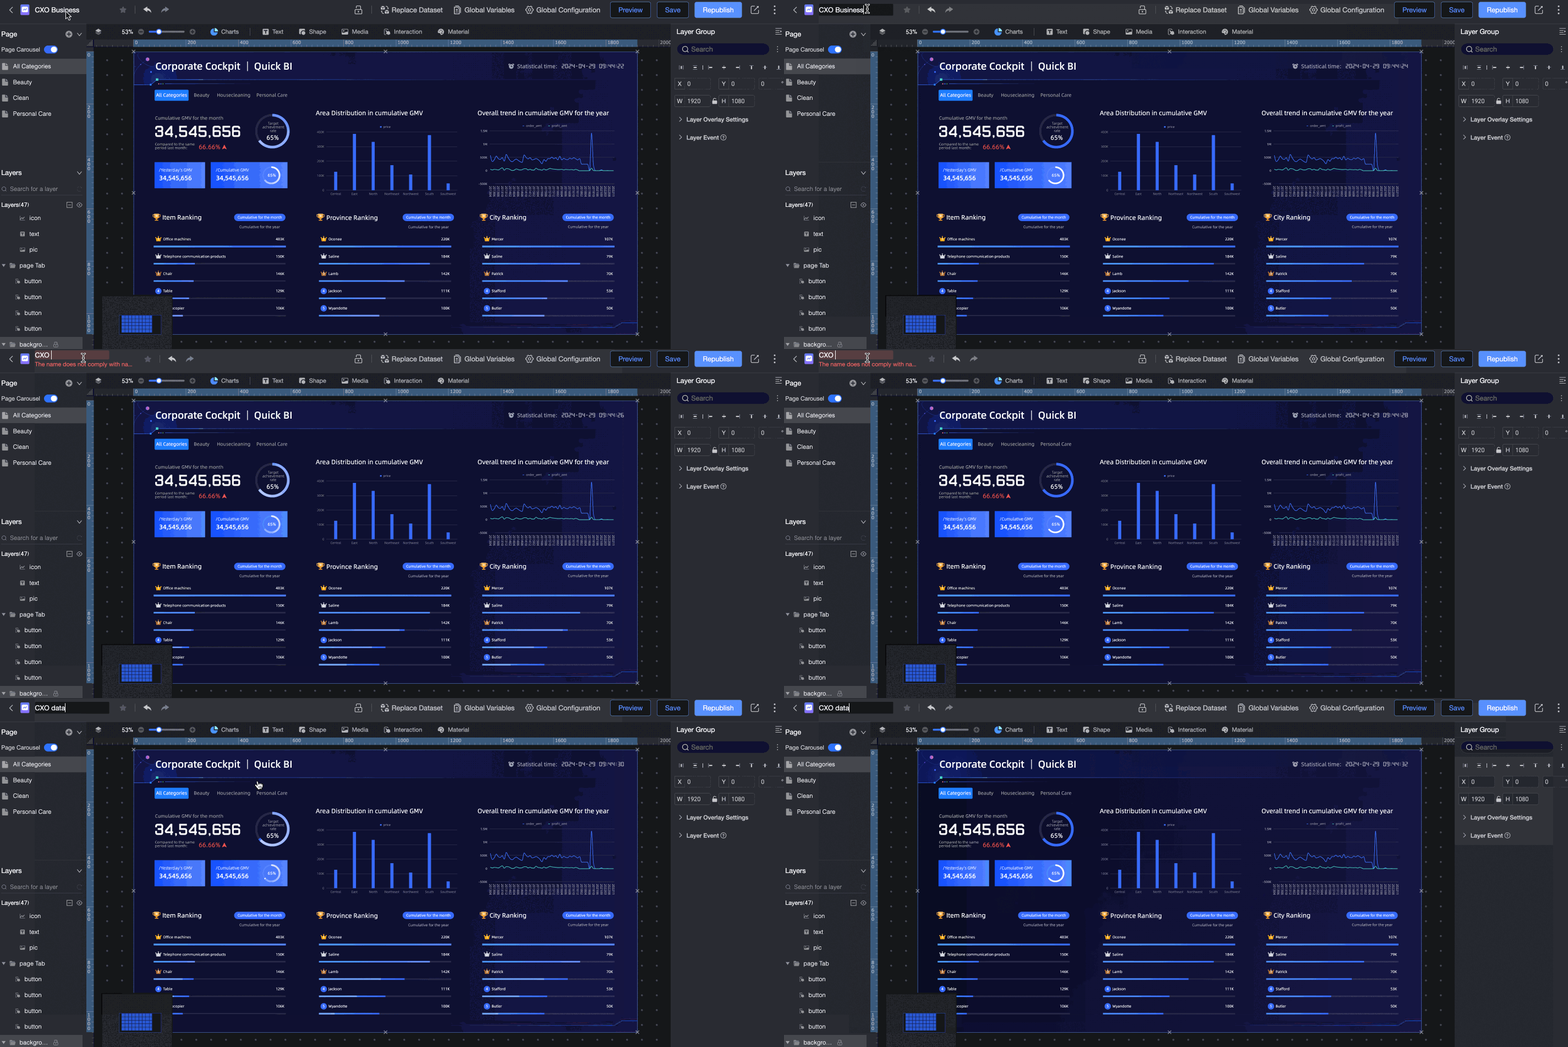
Edit the title.
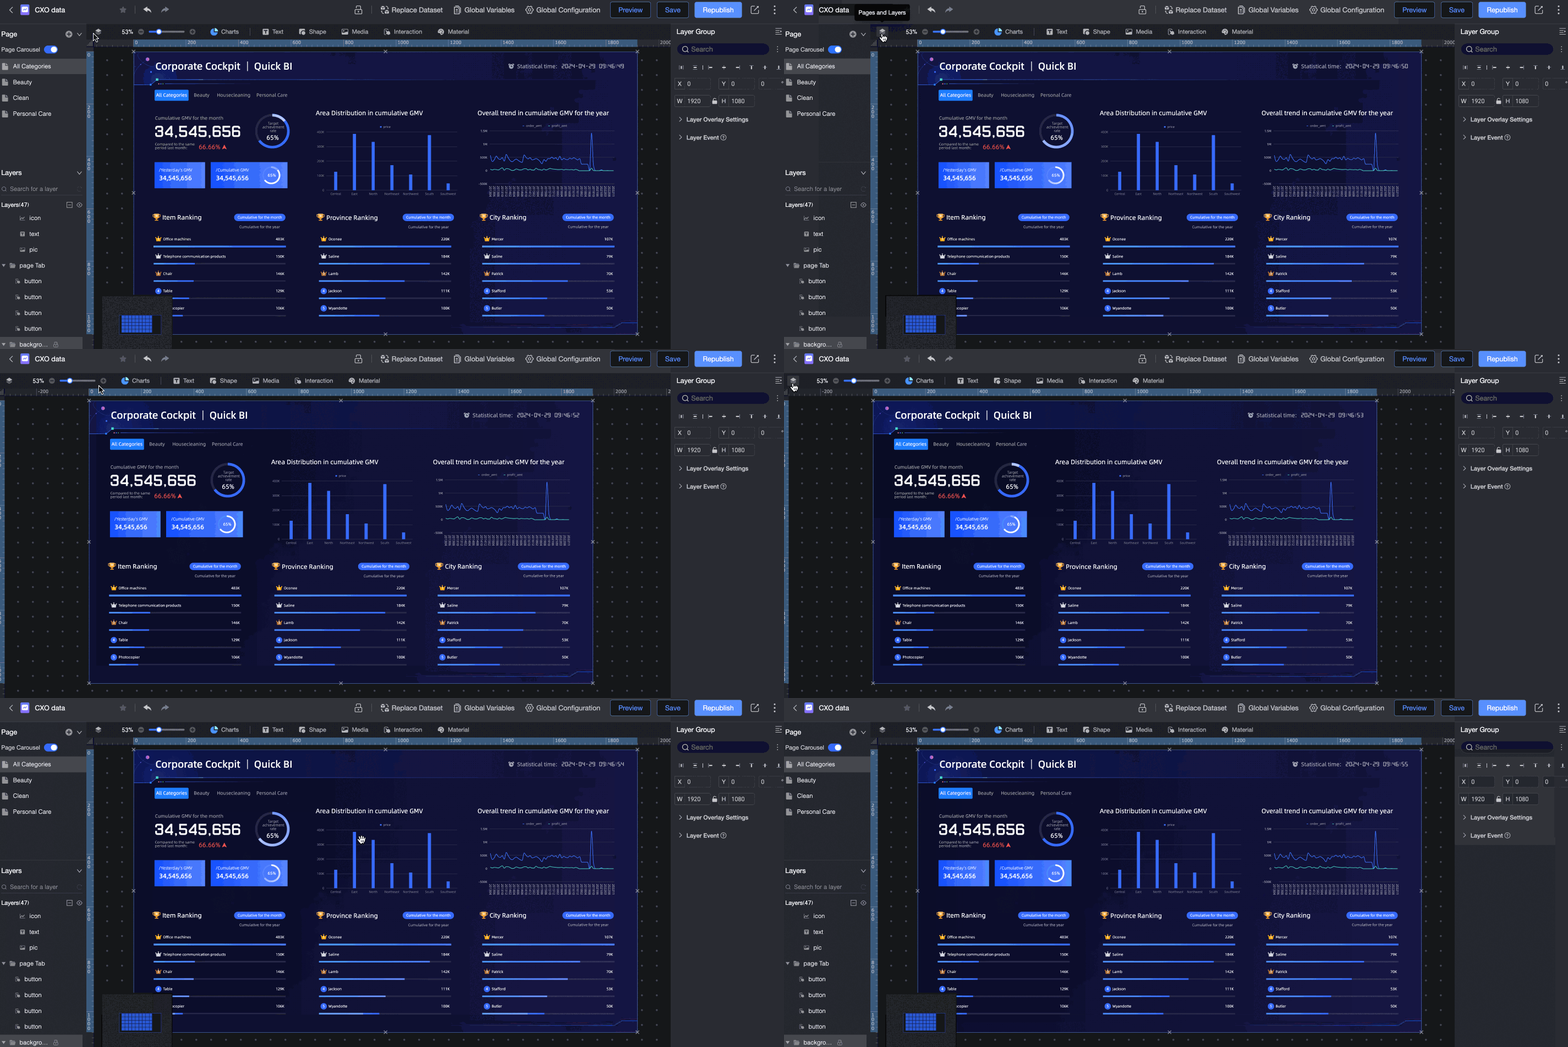
Expand pages and layers.
Add to favorites.
Adjust the canvas scale.
Undo or redo changes.
Lock the screen.
Replace the dataset.
Global parameters.
Configure global settings.
Share with a link.
Access more editing actions.
Edit the title
Expand pages and layers
Adjust the canvas scale
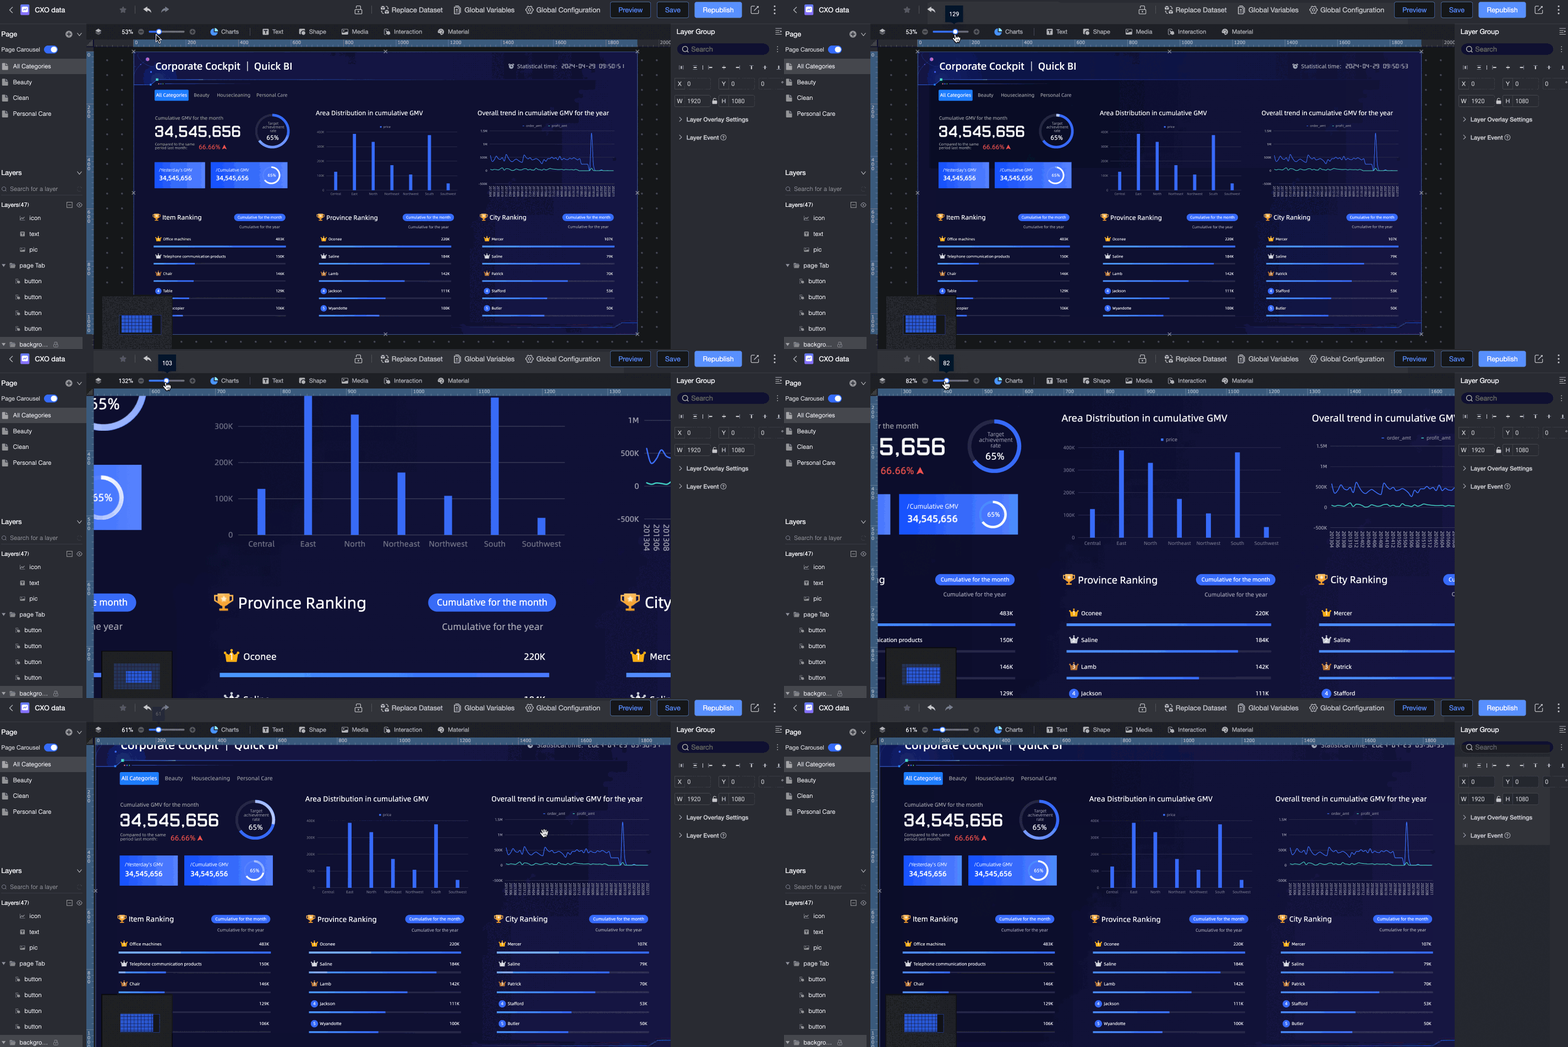
Global settings
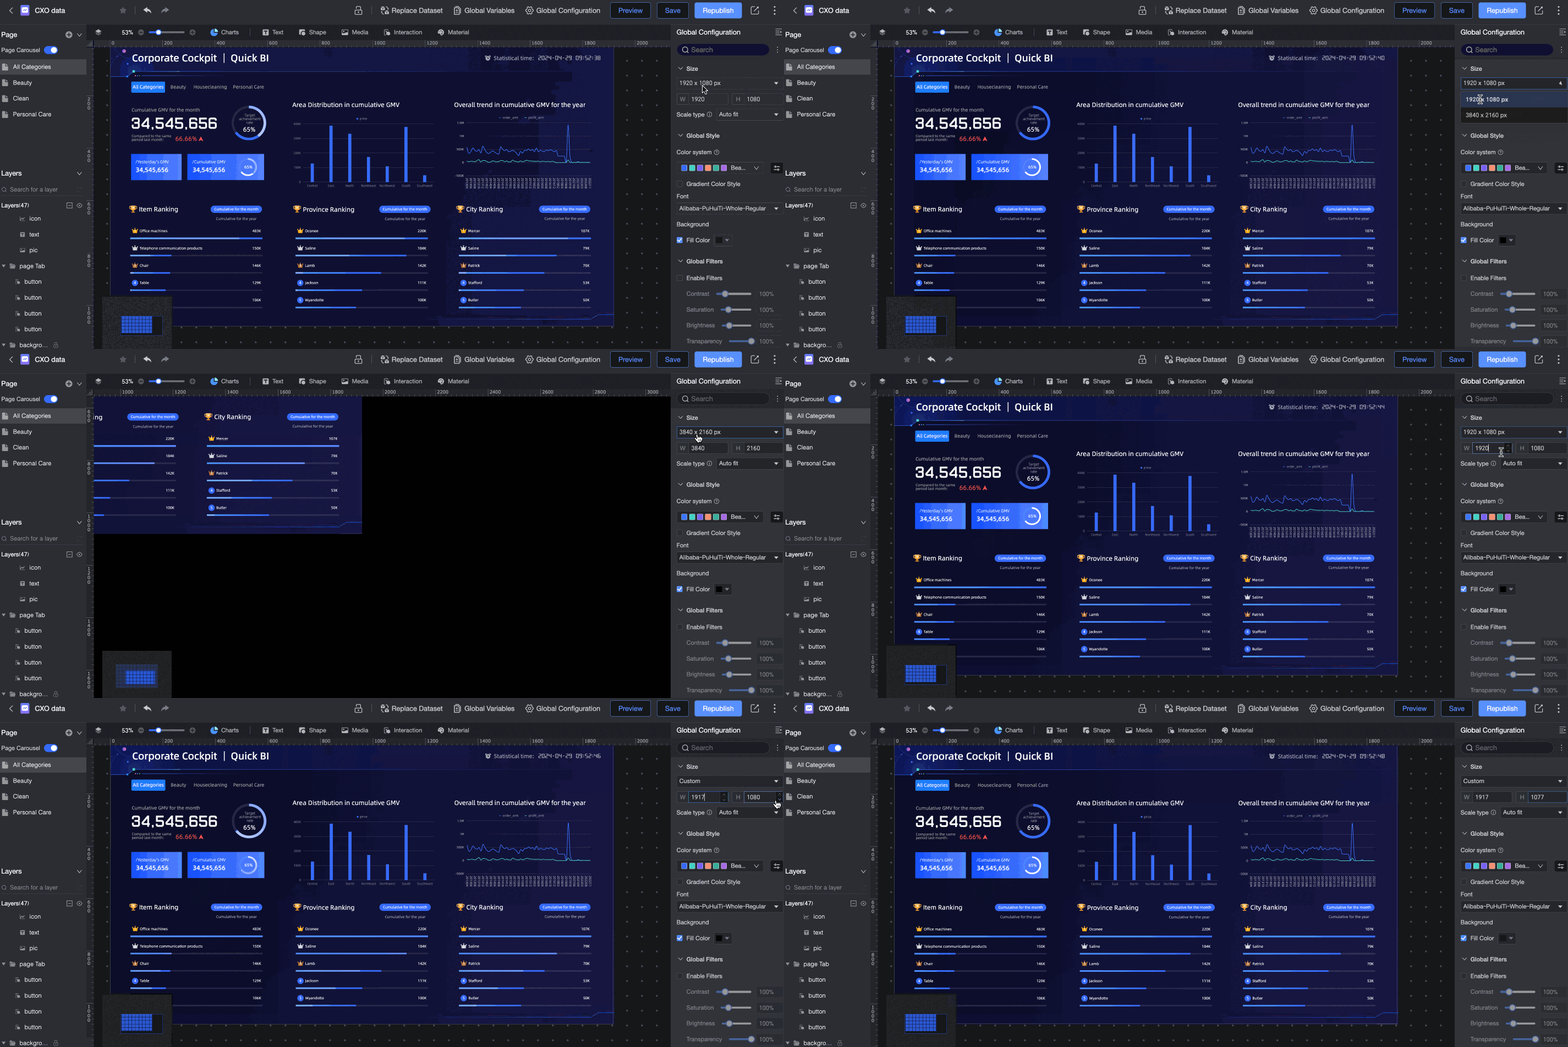
Adjust the screen size
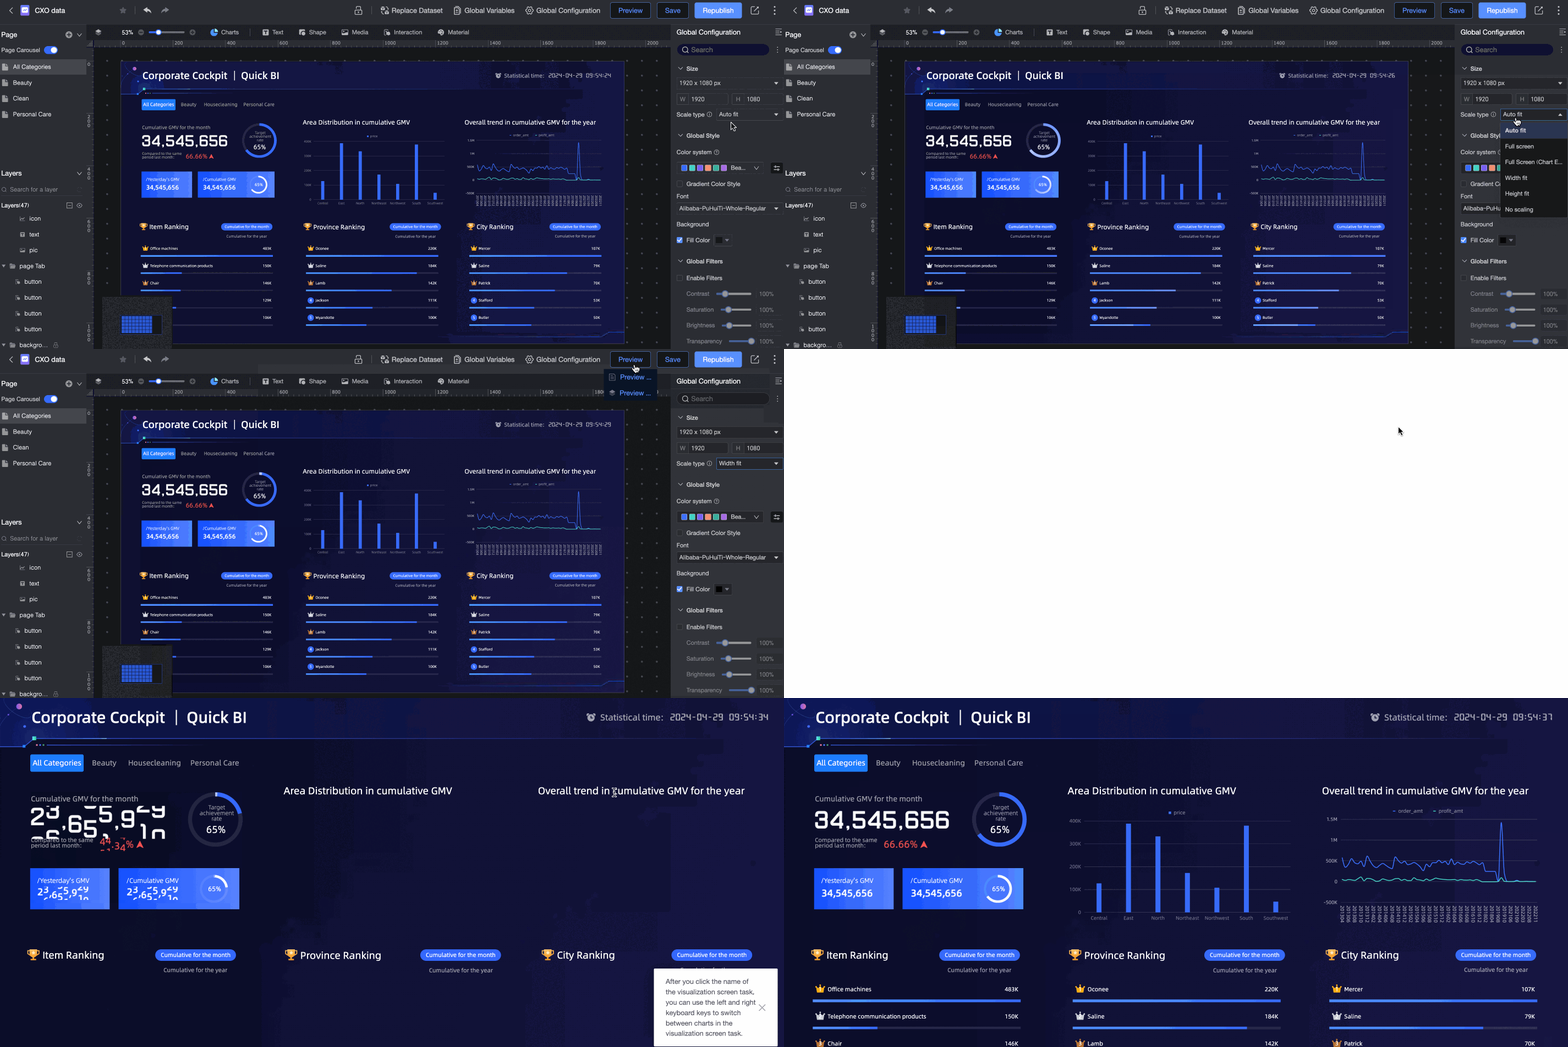
Set the scaling method
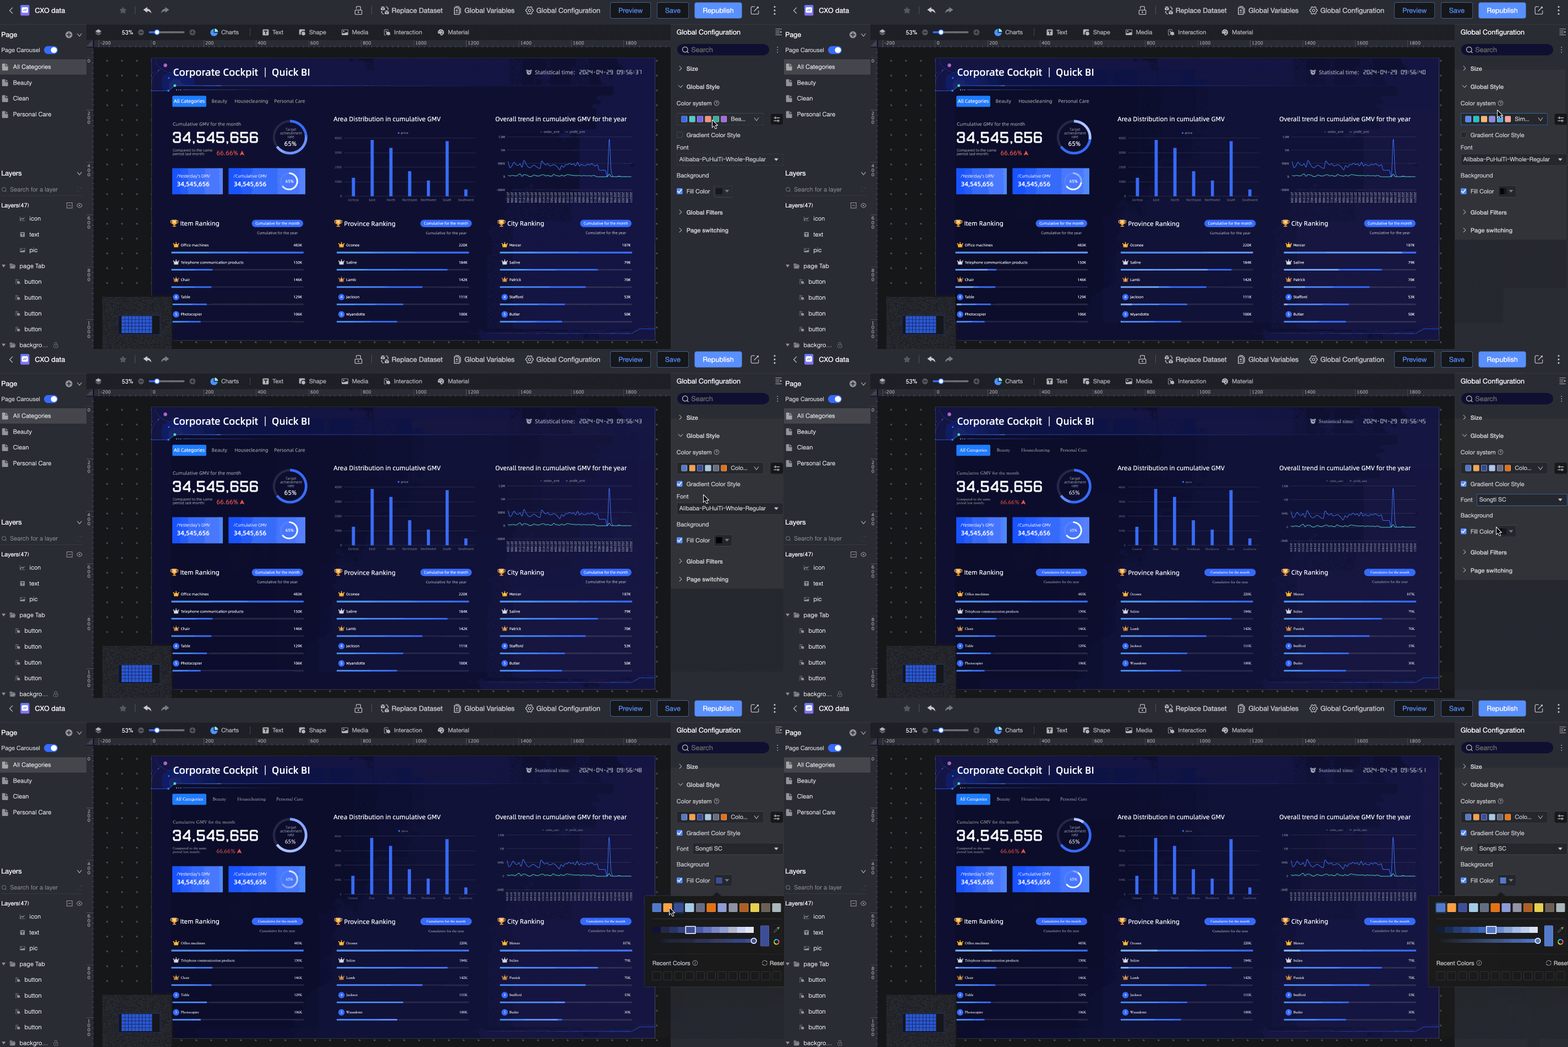
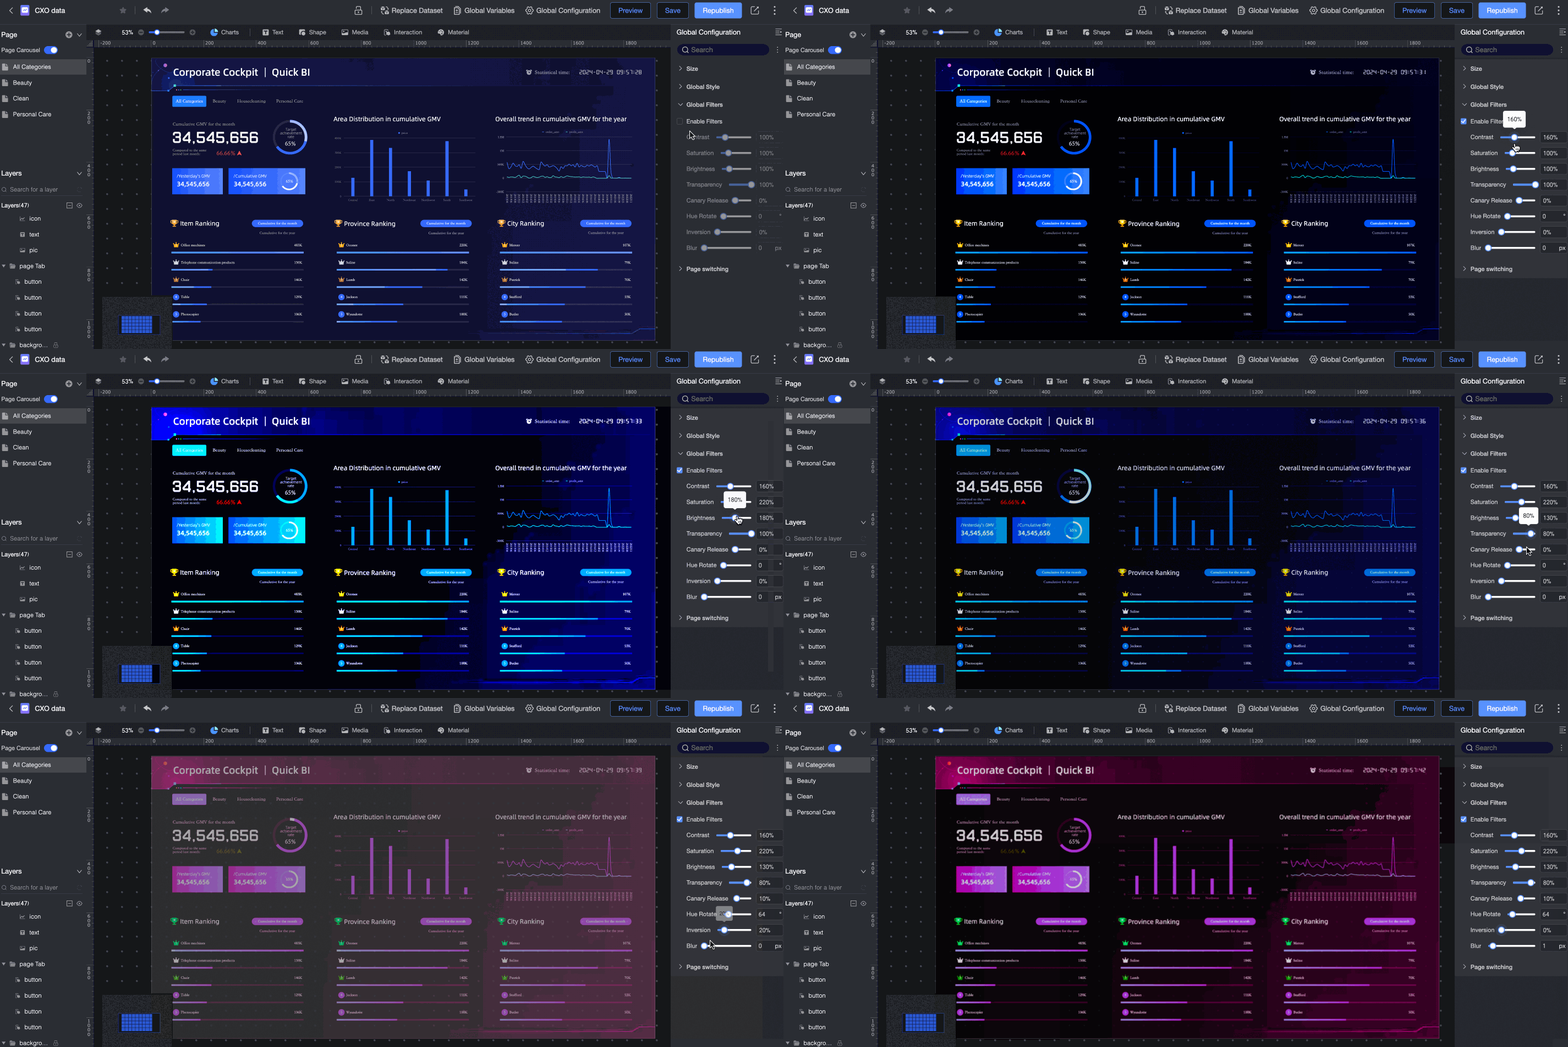
Set global styles
Set global filters
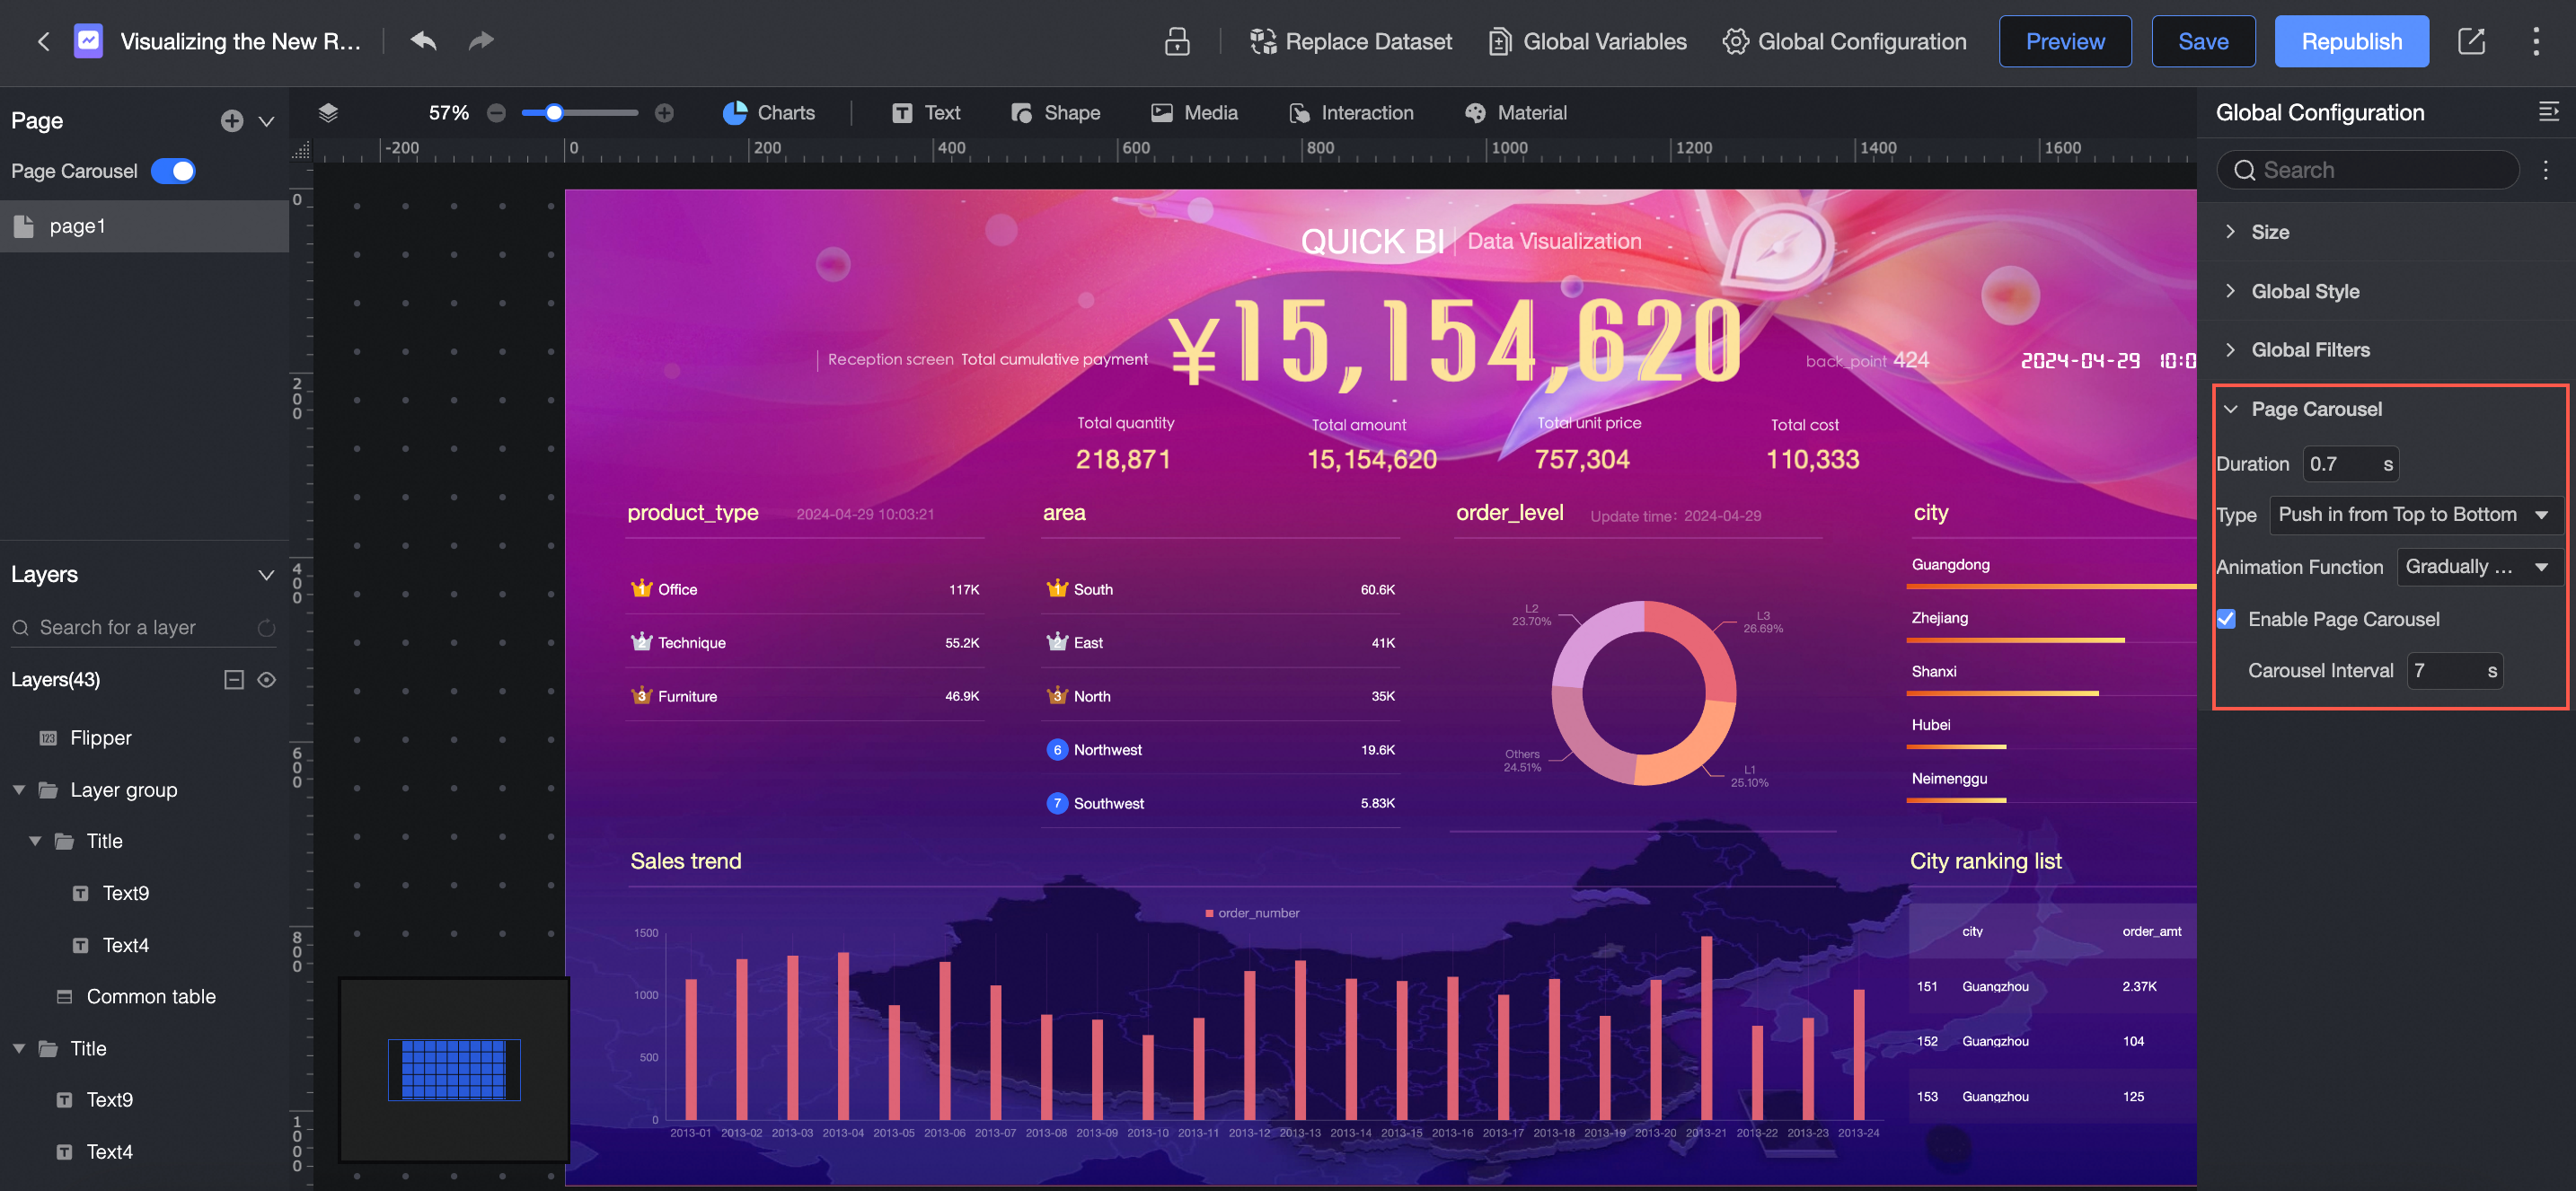
Set the page carousel.
Replace the dataset
In the data visualization screen editor, click ![]() in the top menu bar to show all datasets in the current screen. You can perform a global dataset replacement.
in the top menu bar to show all datasets in the current screen. You can perform a global dataset replacement.
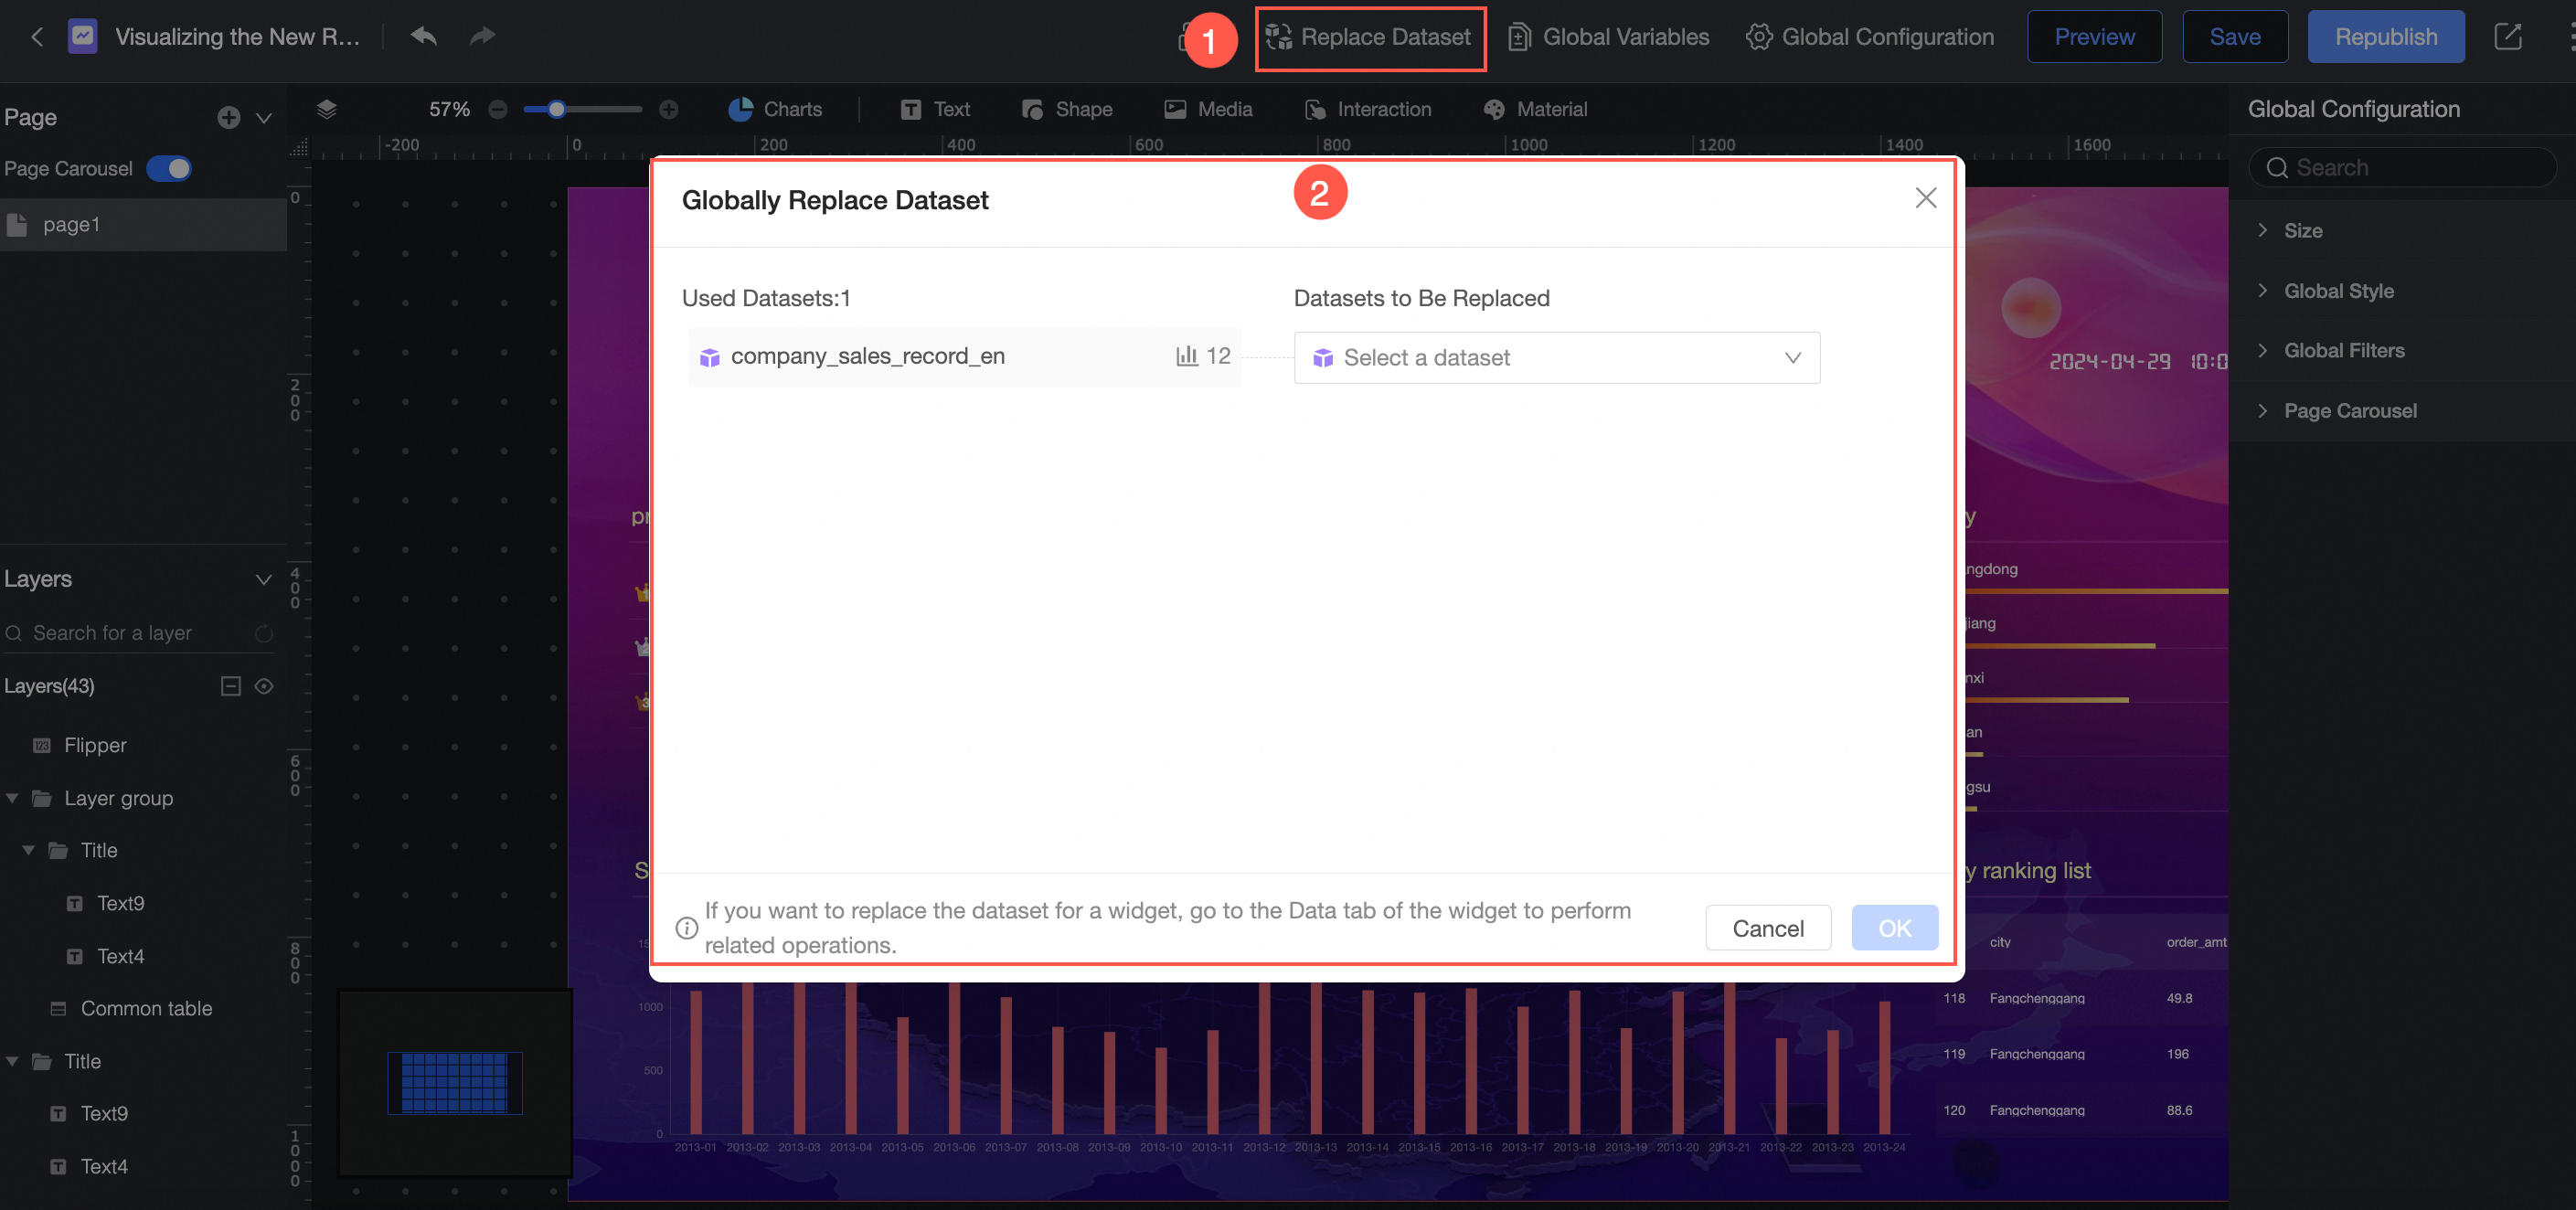
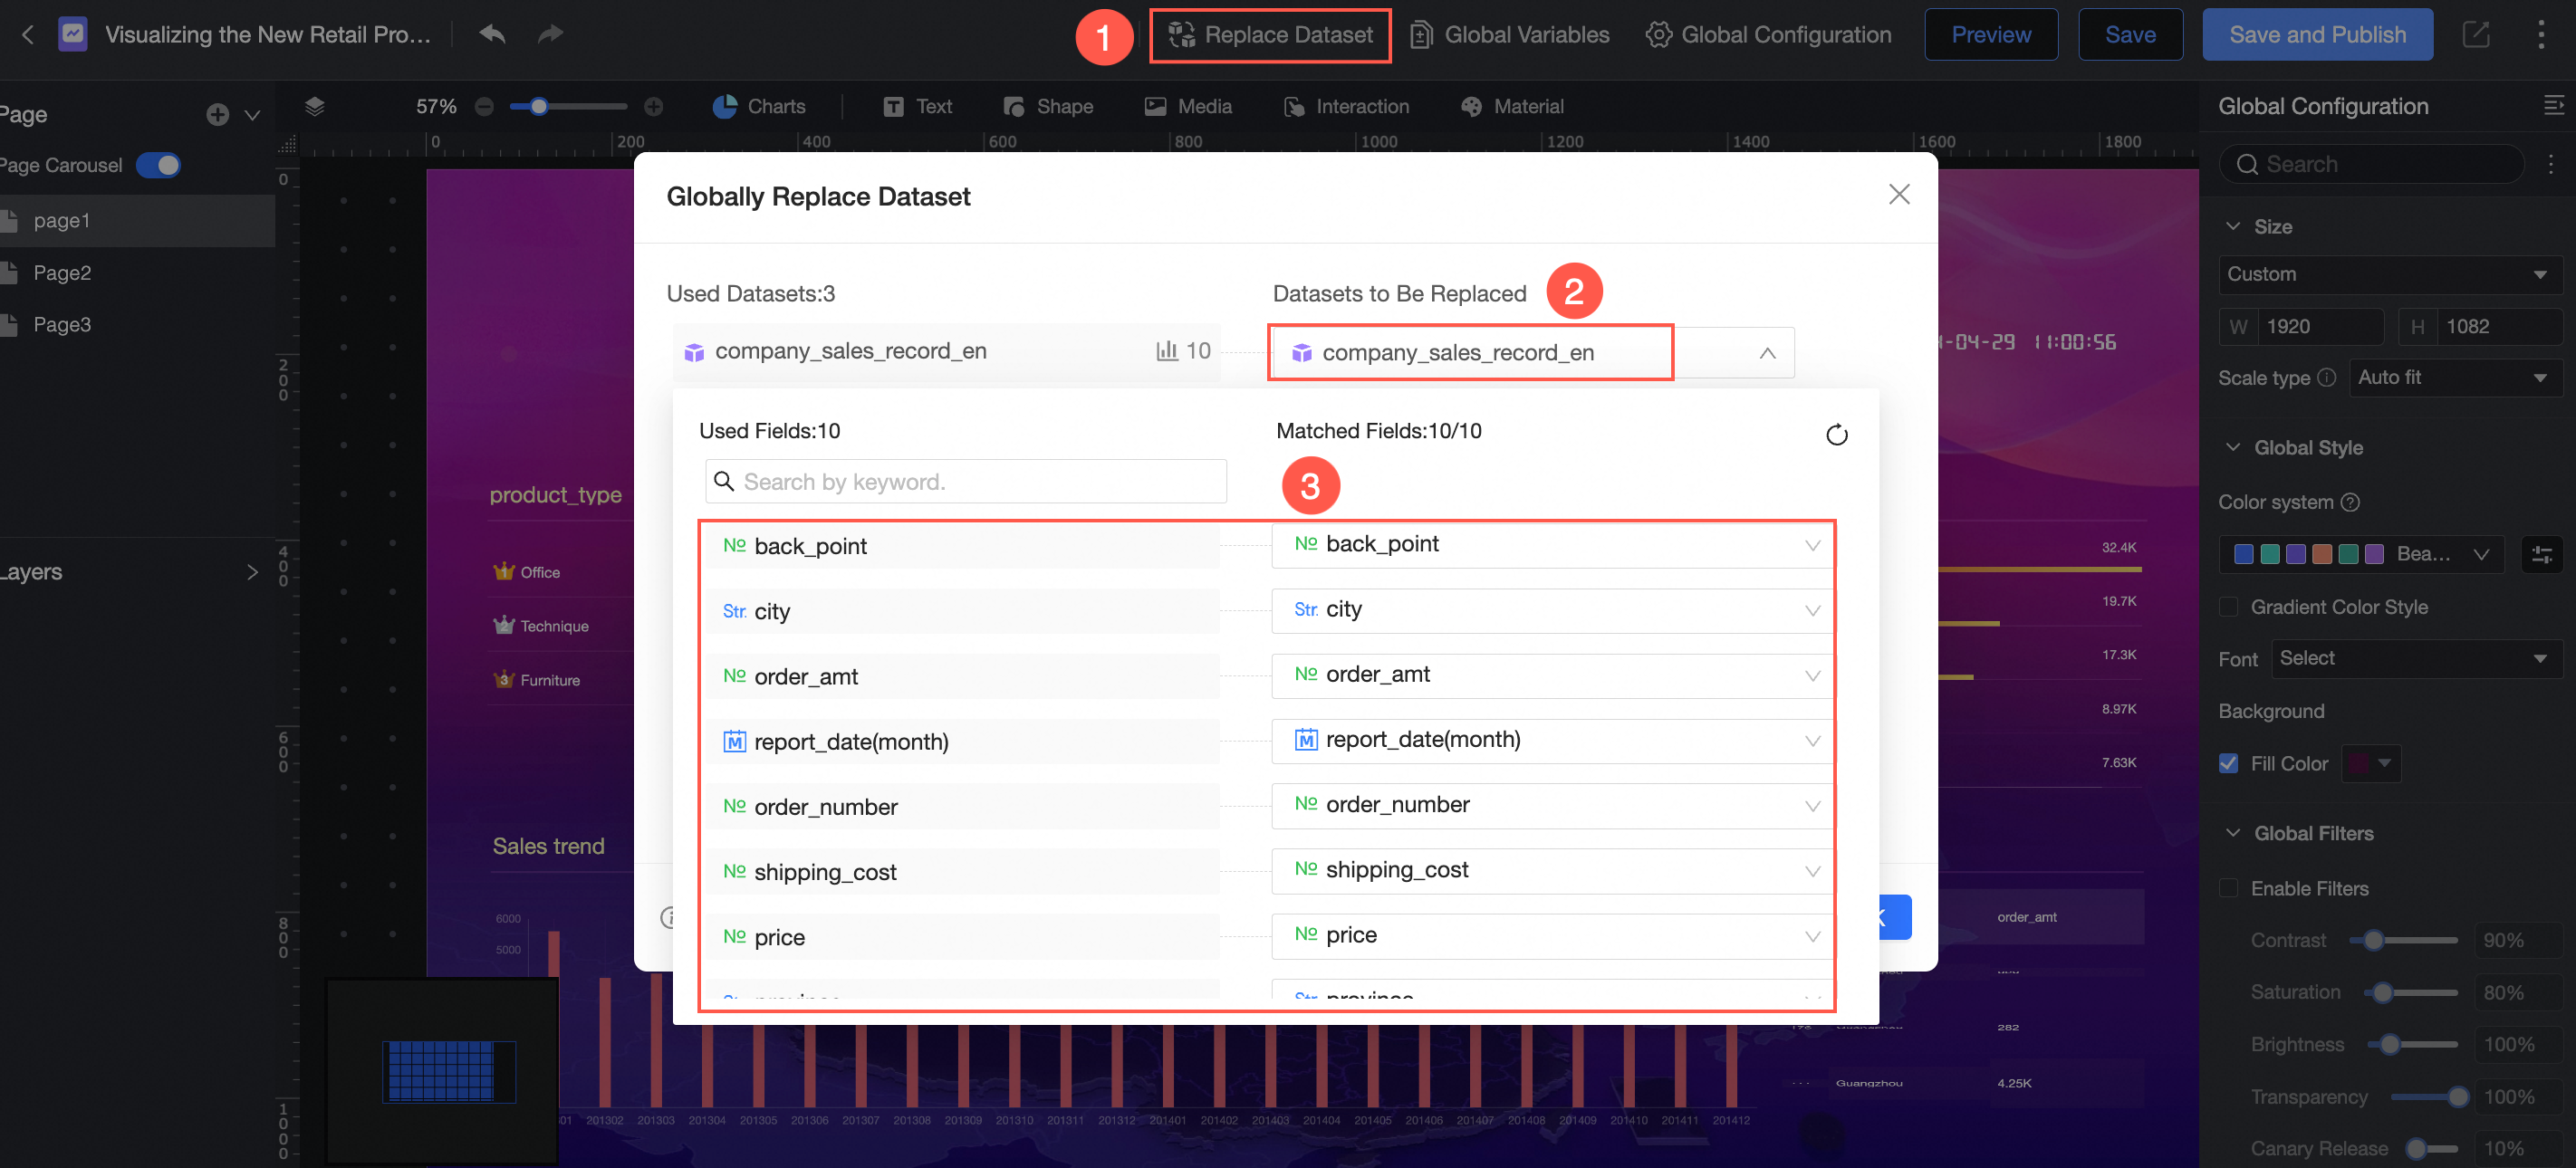
To replace a dataset in the Used datasets list (①), select an existing dataset from the same workspace in the Replace dataset section on the right (②). After selection, match fields between the two datasets (③).
Matched fields must have the same type.
Preview the screen
The feature entry point is shown below: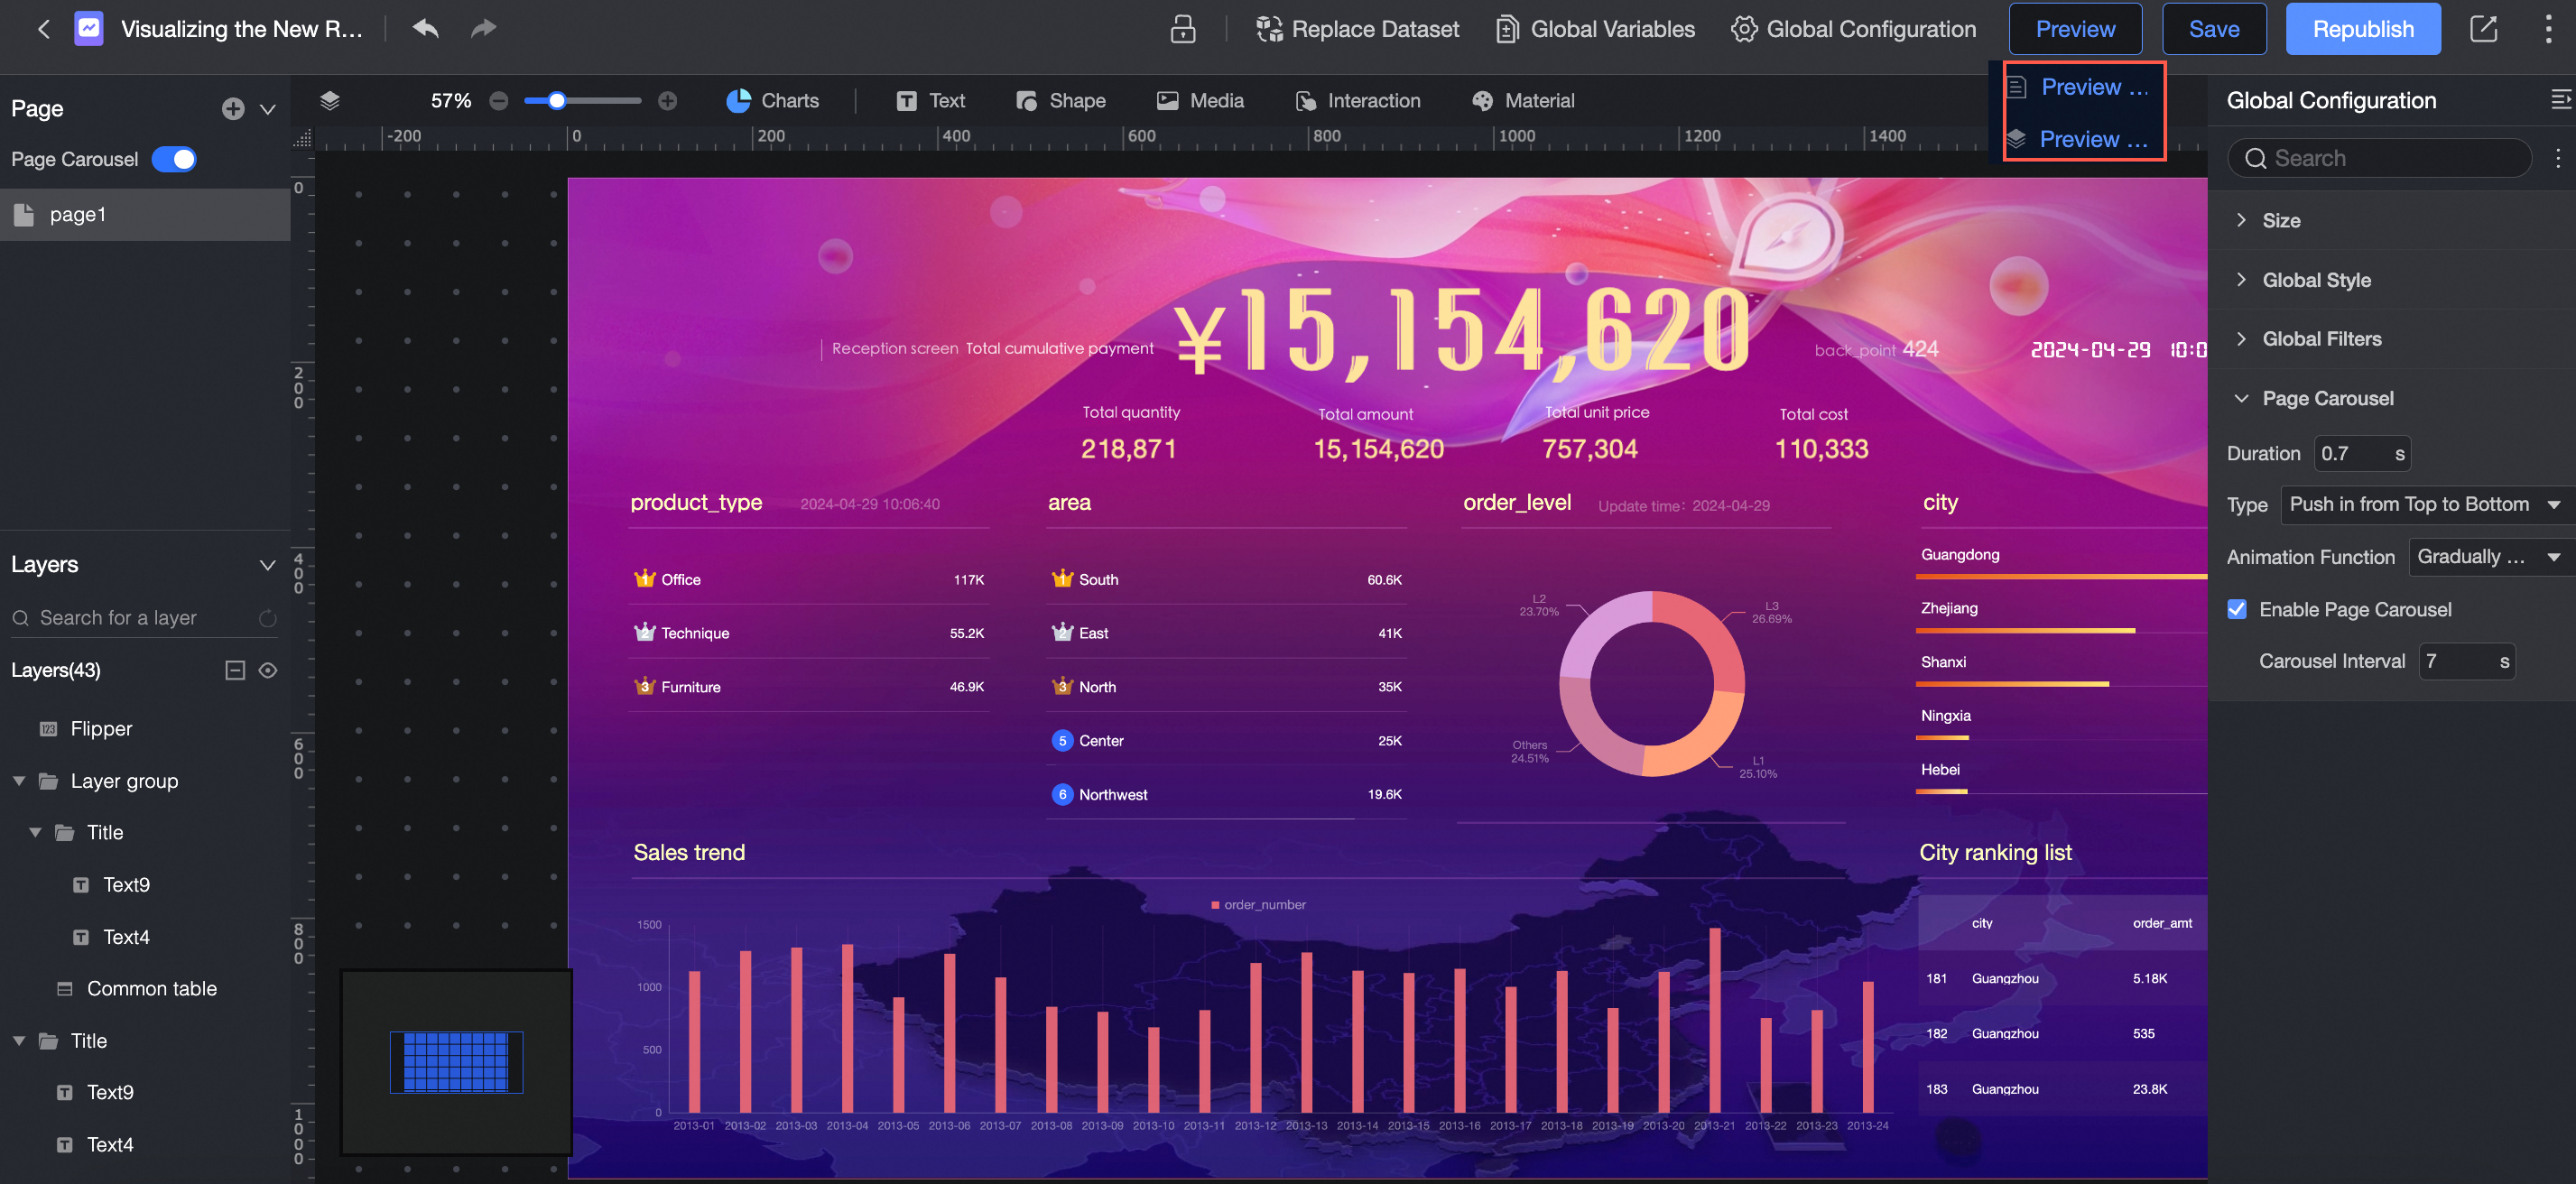
Preview page
Preview only the current page. The navigation bar remains visible.
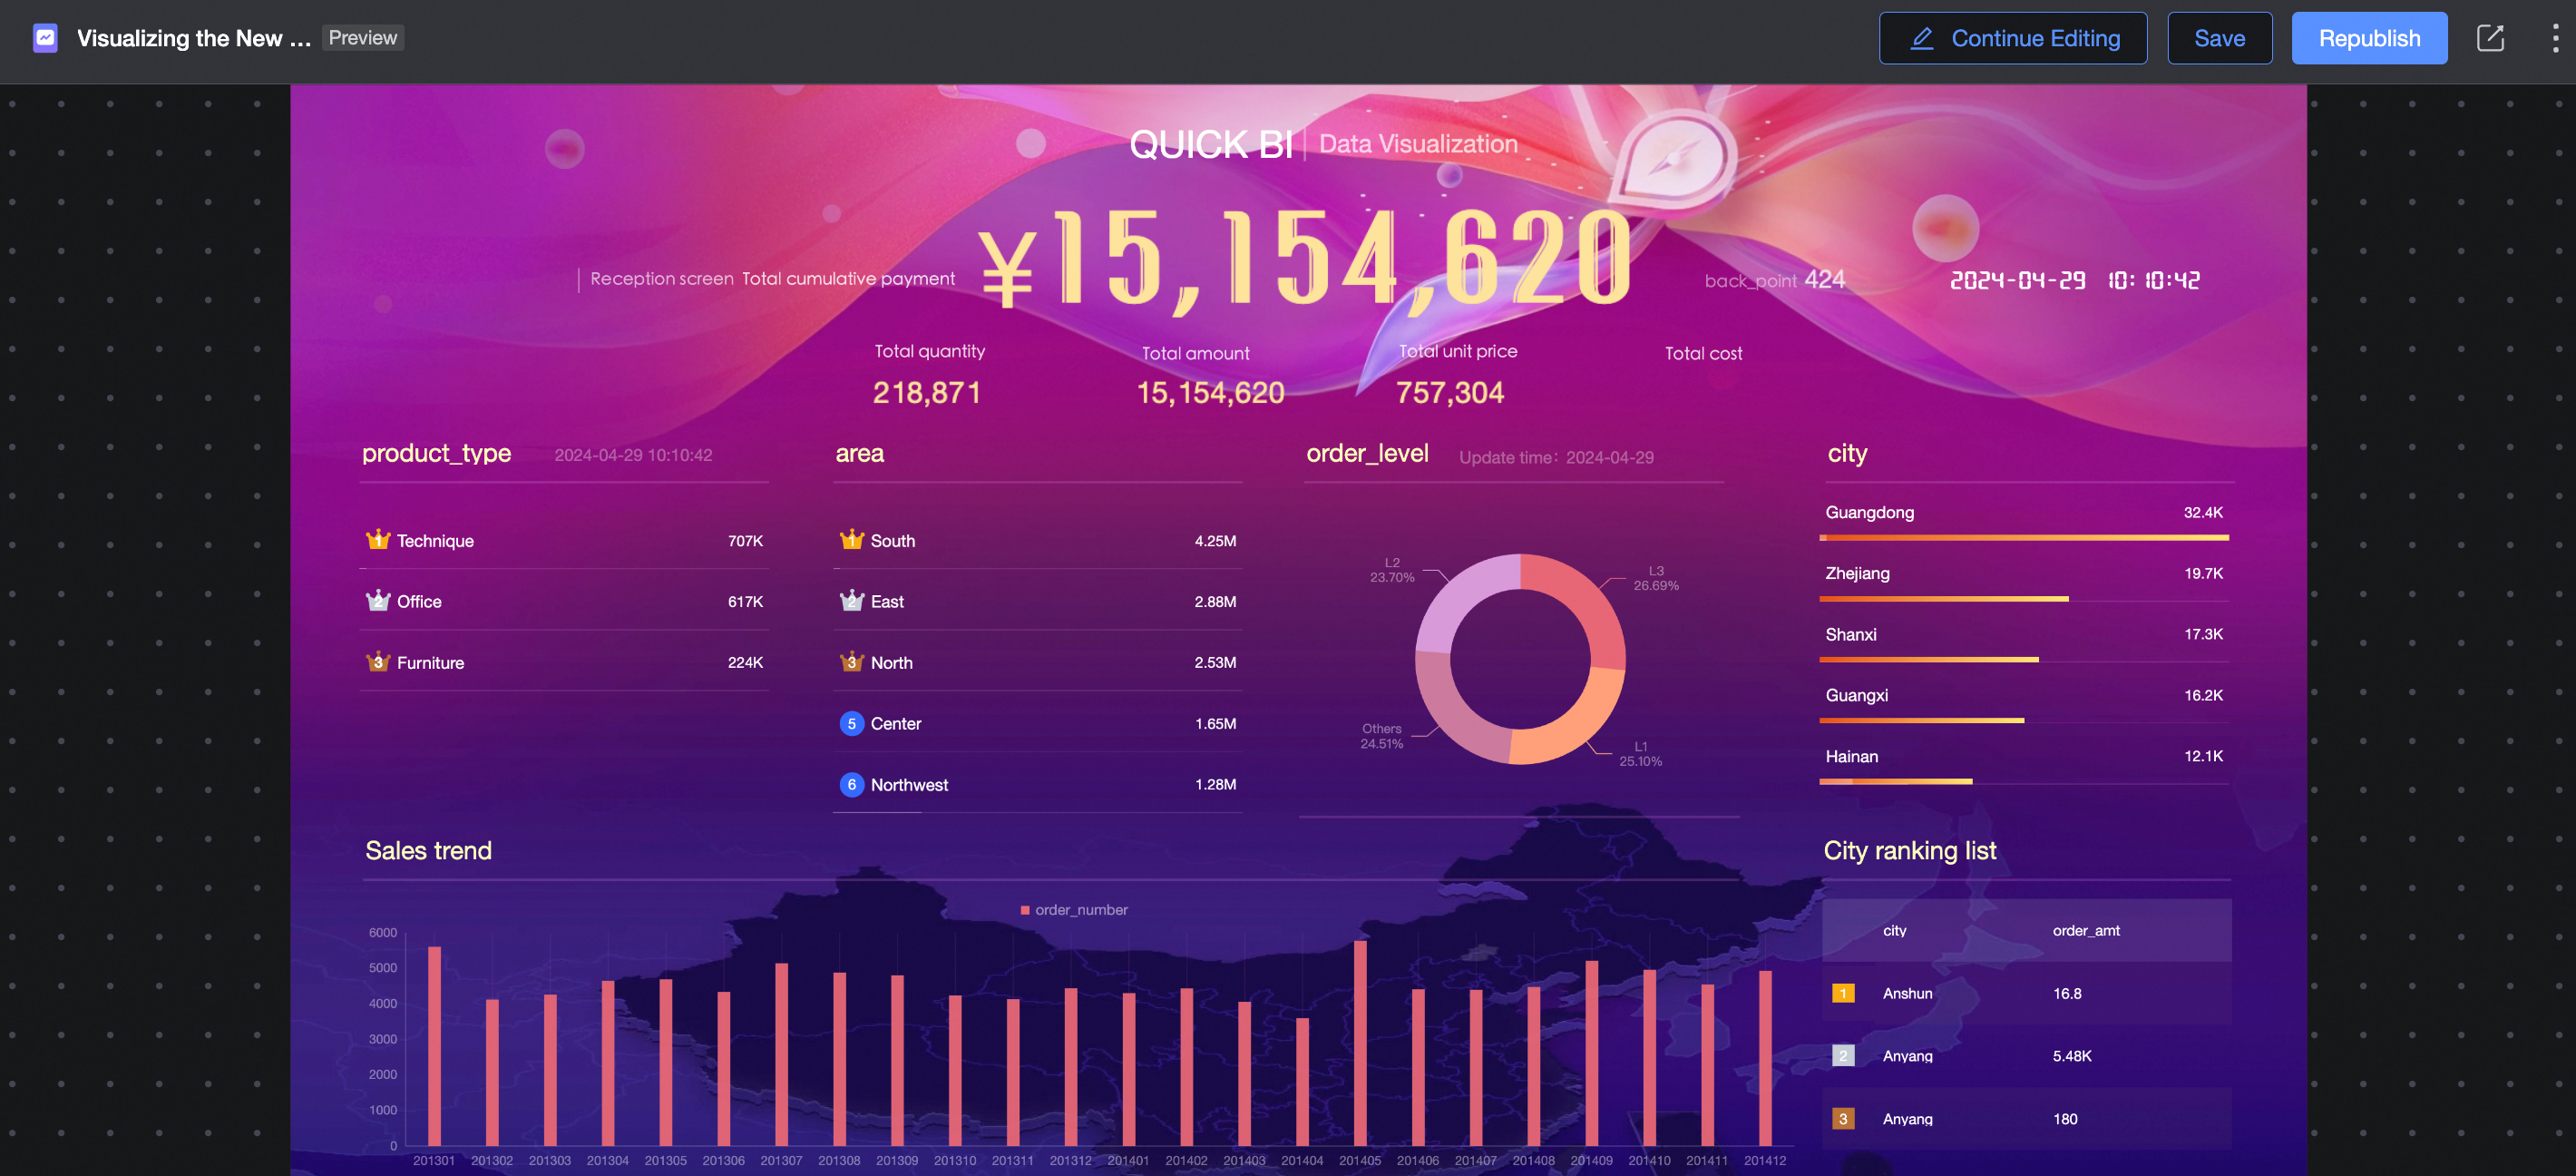
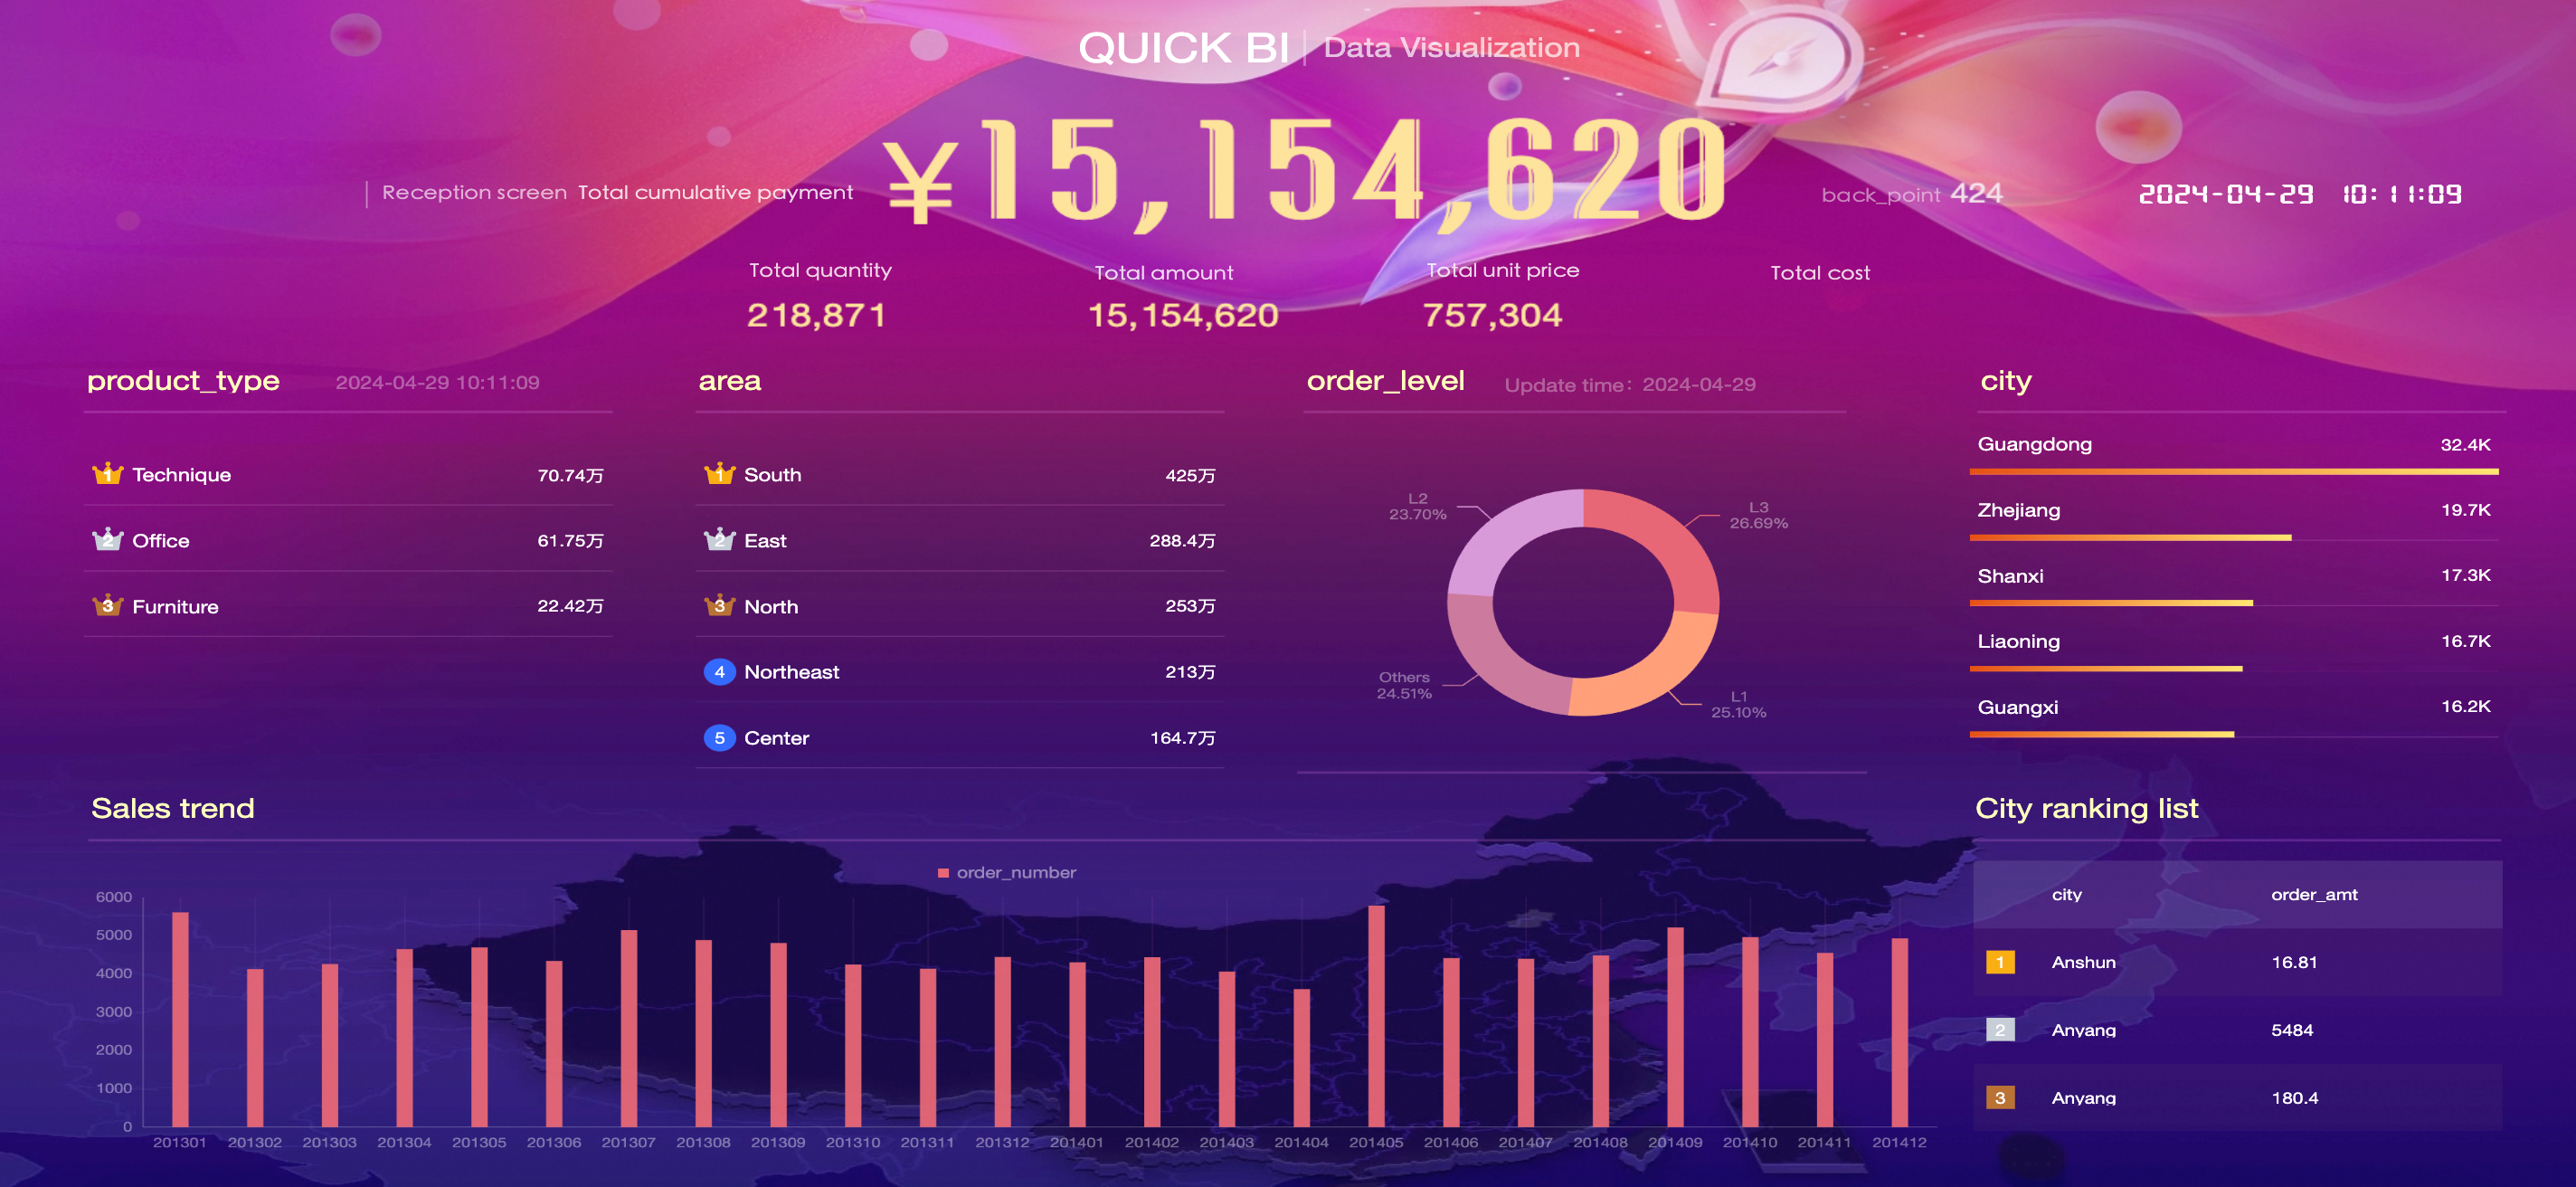
Preview
Preview the full screen to see the display effect. If you configured multiple pages, you can view them all here.
Save
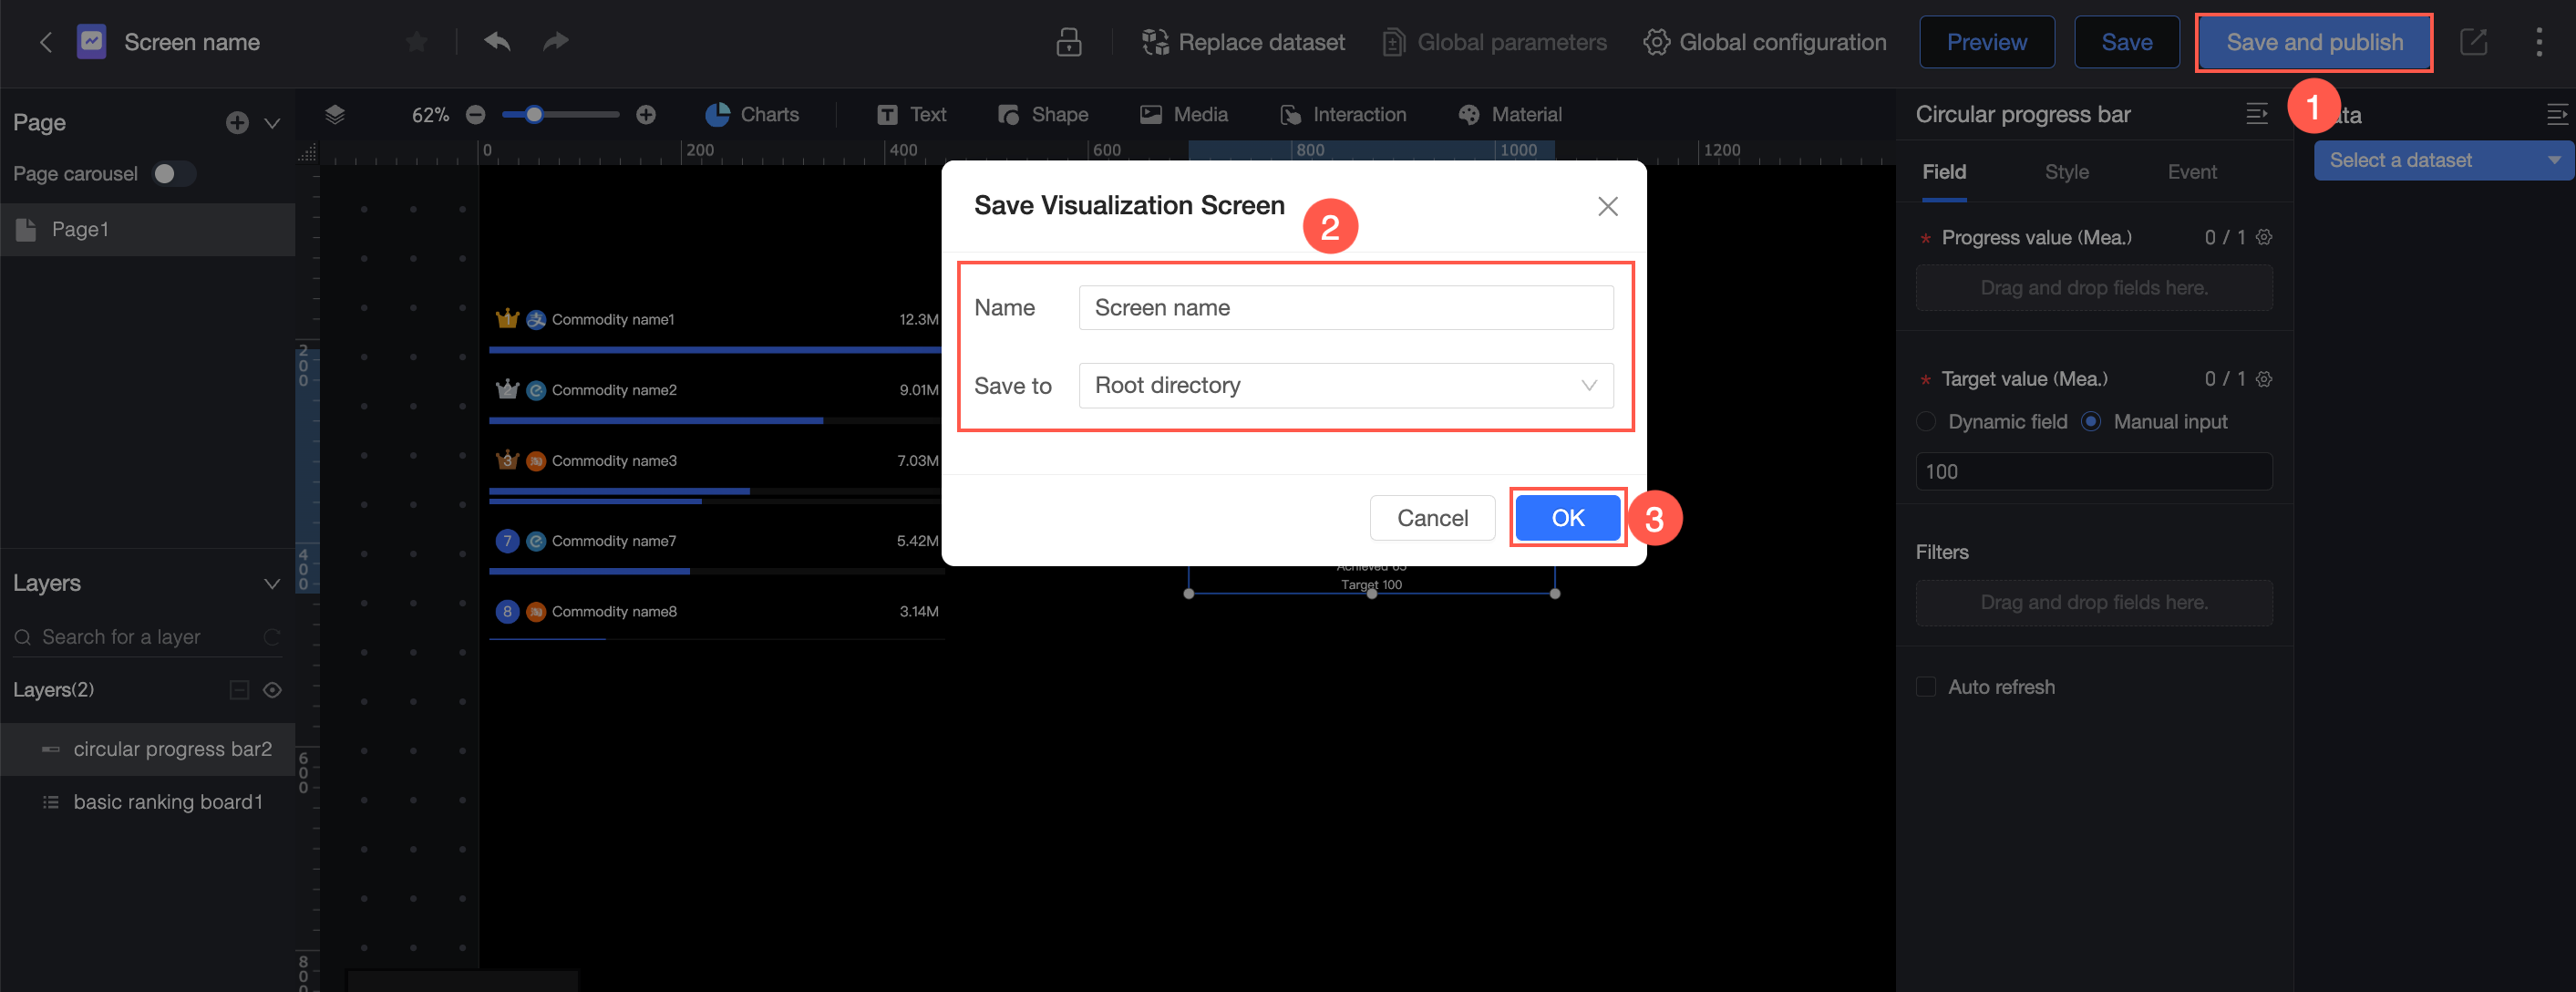
Click the Save button in the upper-right corner (①). Enter a report name, choose a save location (②), and click OK (③).
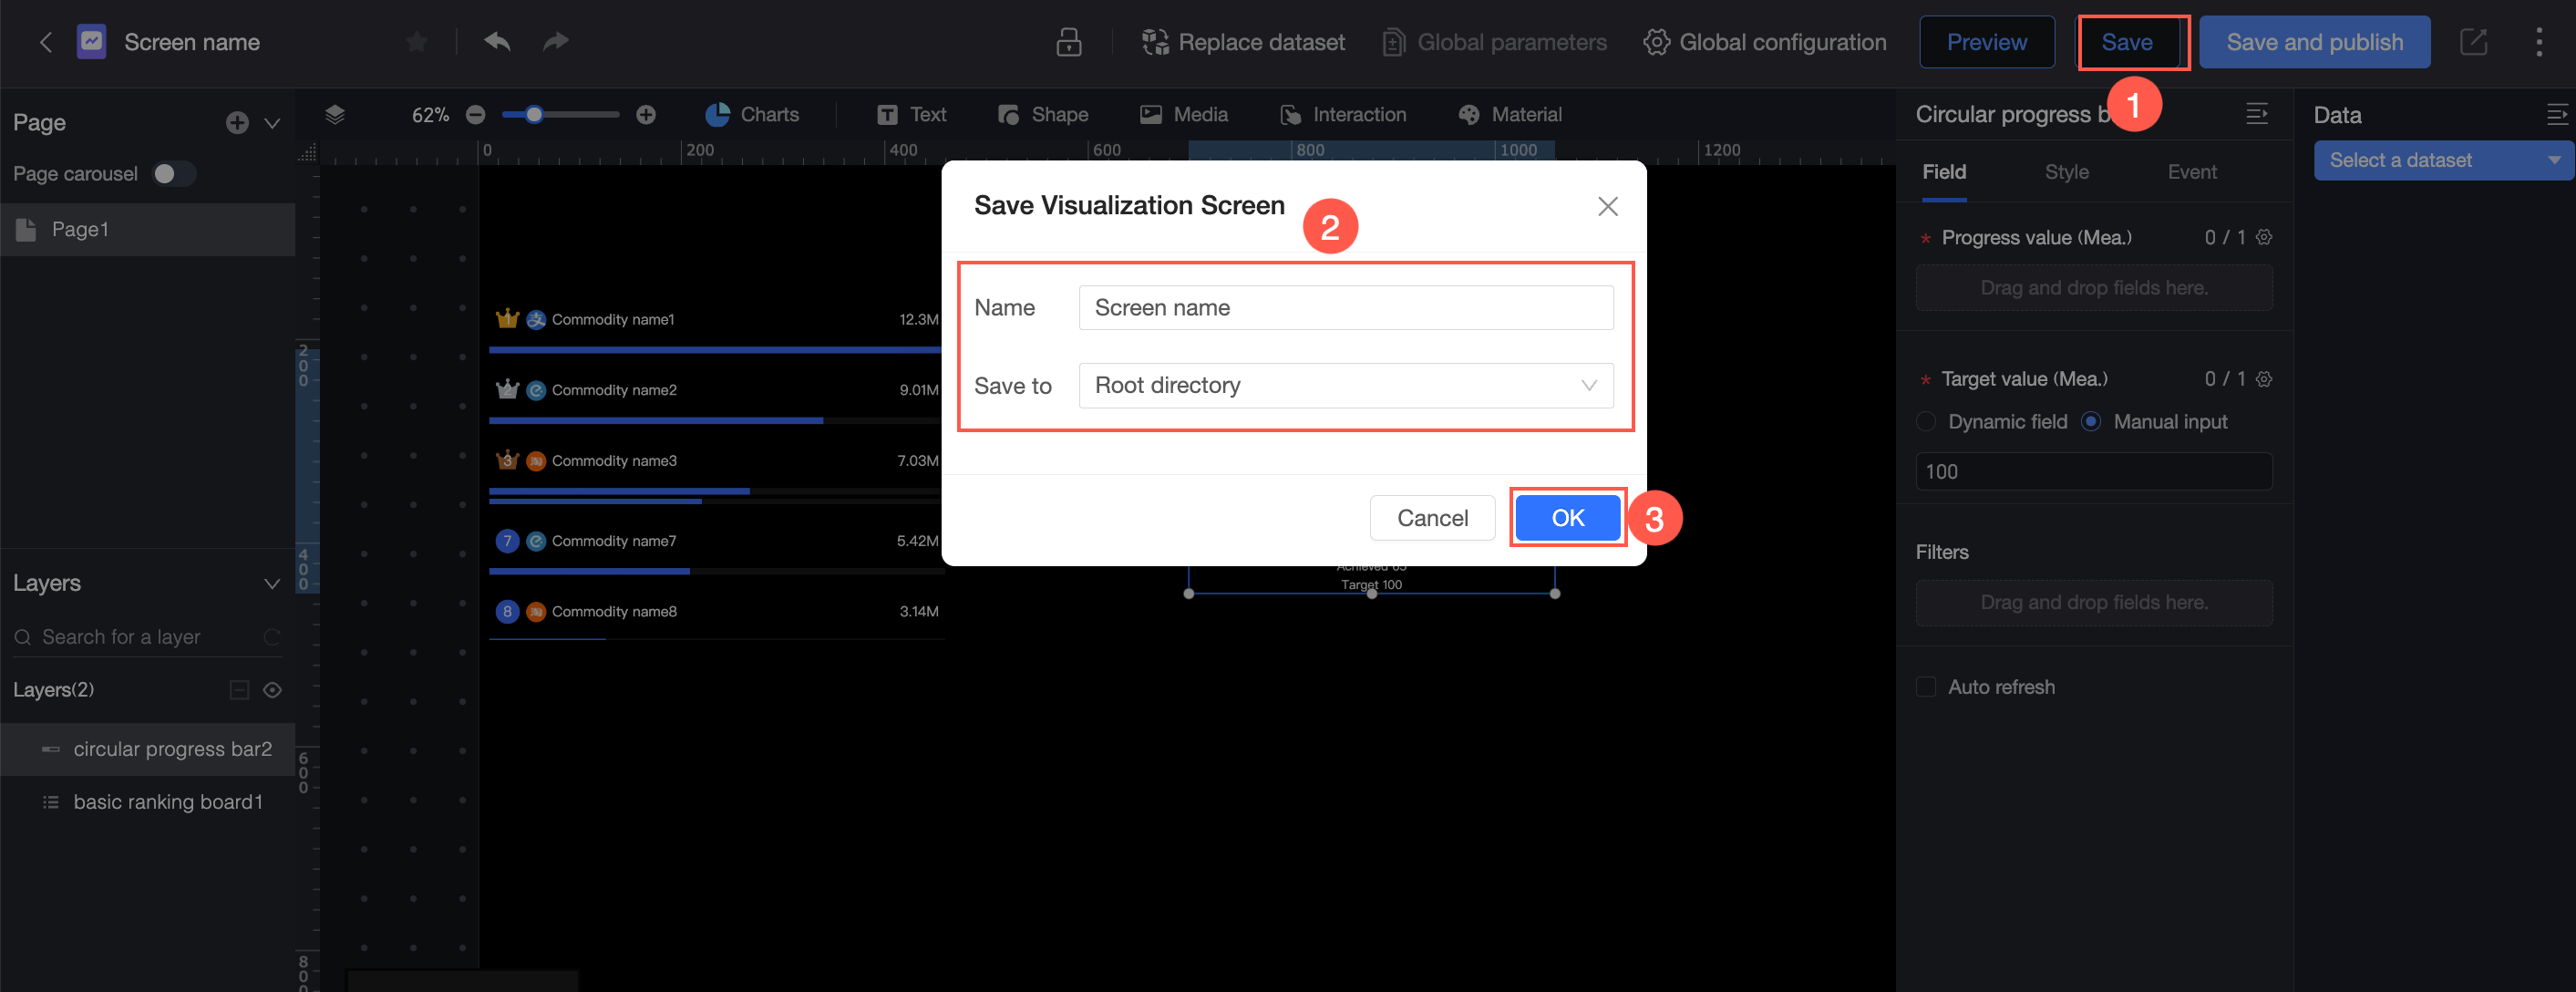
If you save only the data visualization screen, users cannot see the update:
When you create a new data visualization screen, it is saved in an unpublished state. Click Save and publish to publish it.
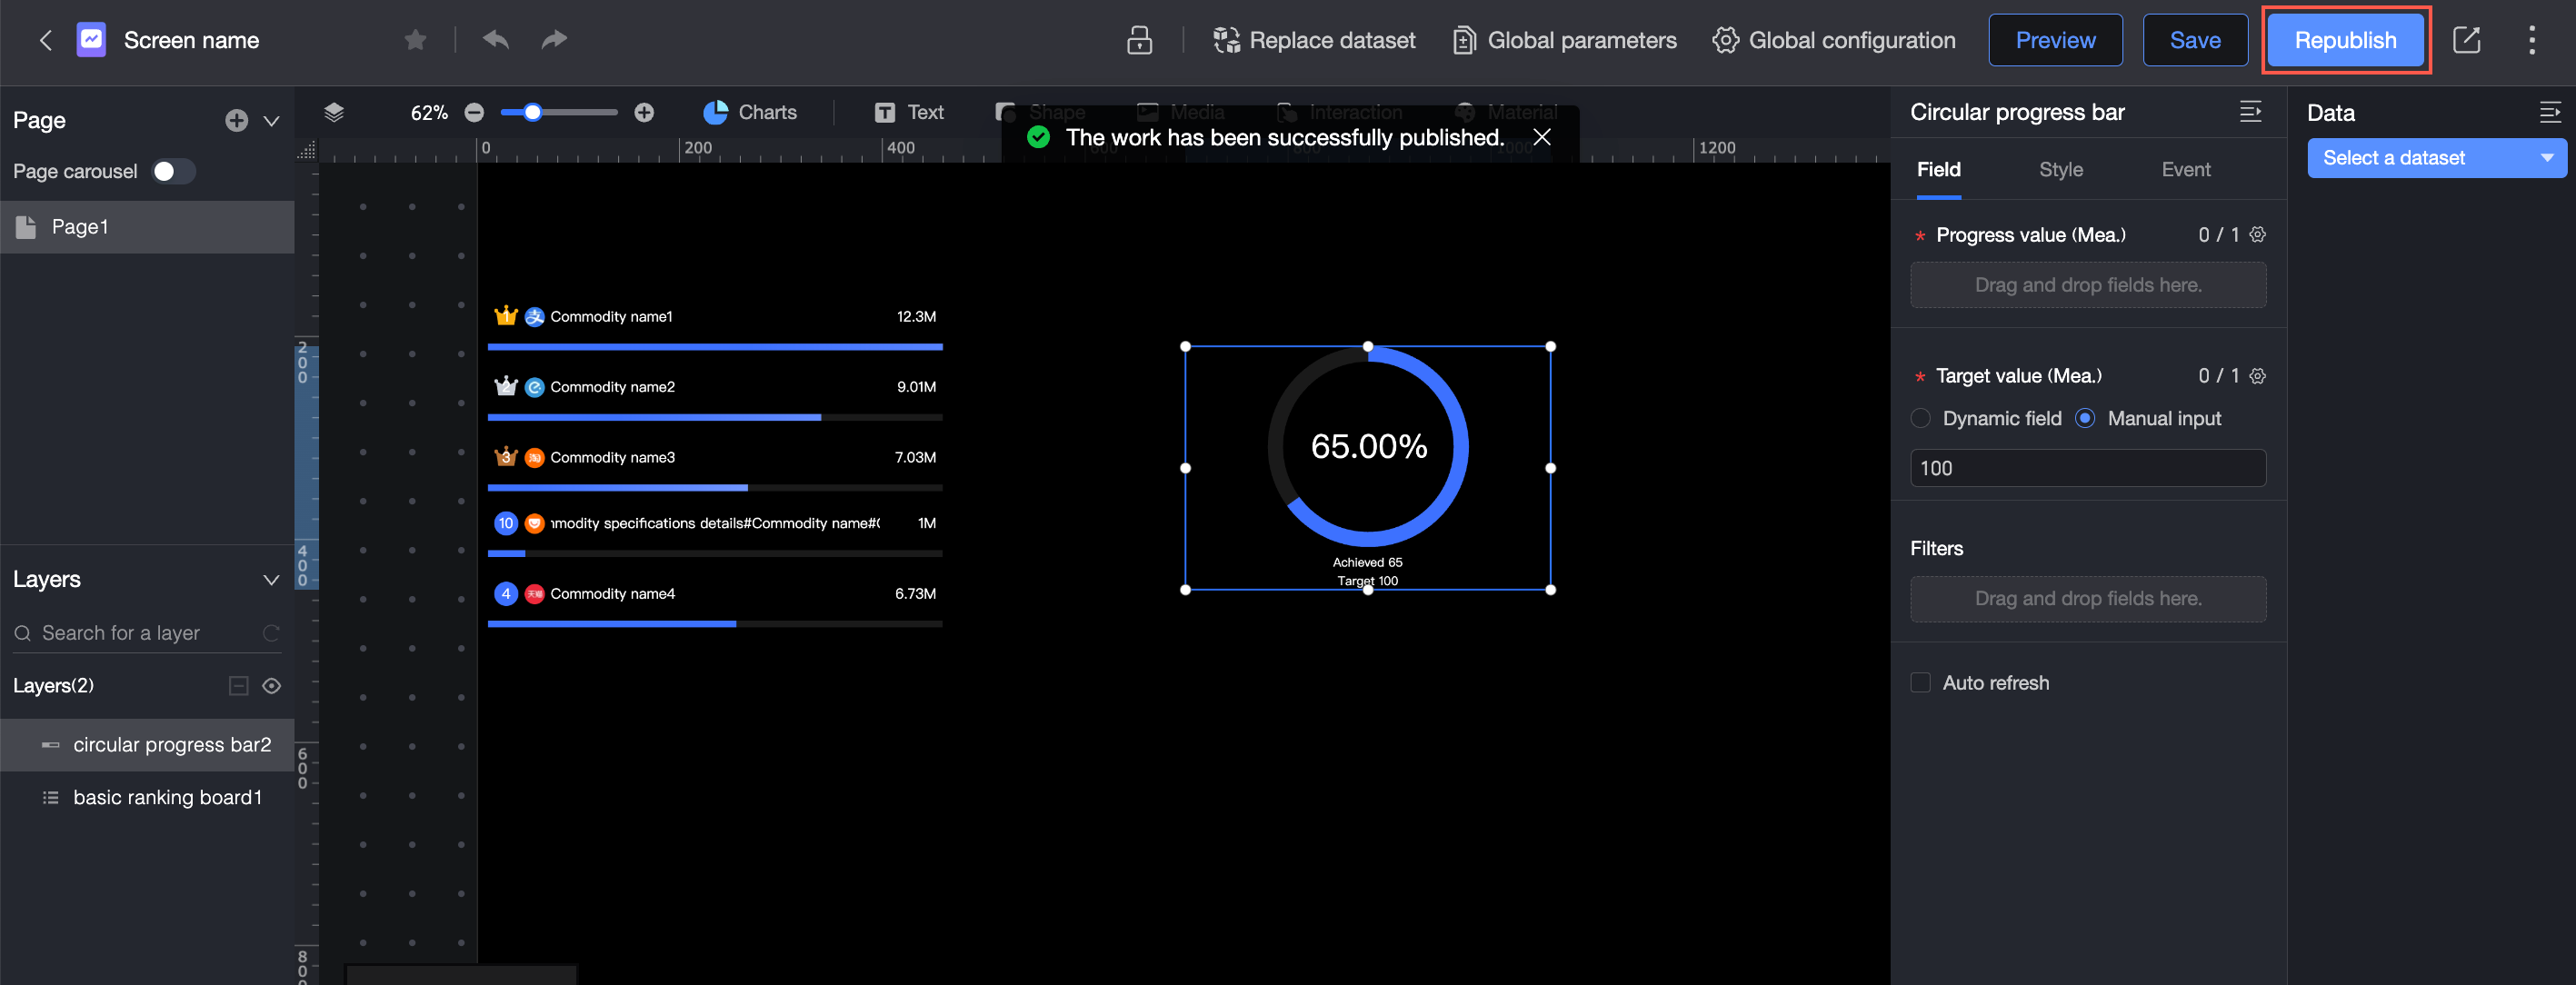
When you update a published data visualization screen, click Republish to release the update.
Save and publish
The Save and publish feature saves your changes and publishes the data visualization screen. Click the Save and publish button in the upper-right corner (①). Enter a report name, choose a save location (②), and click OK (③).
If release approval is required for the workspace that contains the data dashboard—meaning Work Publishing is selected in Approval Settings—  you must Select Approver, optionally Enter Reason for Request, and then click Submit Request. The dashboard can be published only after the request is approved. For more information, see Create and Manage Workspaces.

You can keep editing after submitting a publishing request. If you save again, the published version becomes the latest saved version.
Workspace administrators can publish without approval.
Republish
Use Republish to push updates to an already-published data visualization screen. A notification appears on the editor page, and the screen status changes to Saved but not published.
 Release approval is enabled for a data dashboard's workspace if the Publish Work checkbox is selected in the Approval Settings.
 In this case, an approval process is triggered each time you republish the dashboard. The dashboard can be republished only after the approval is granted. For more information, see Create and Manage Workspaces.
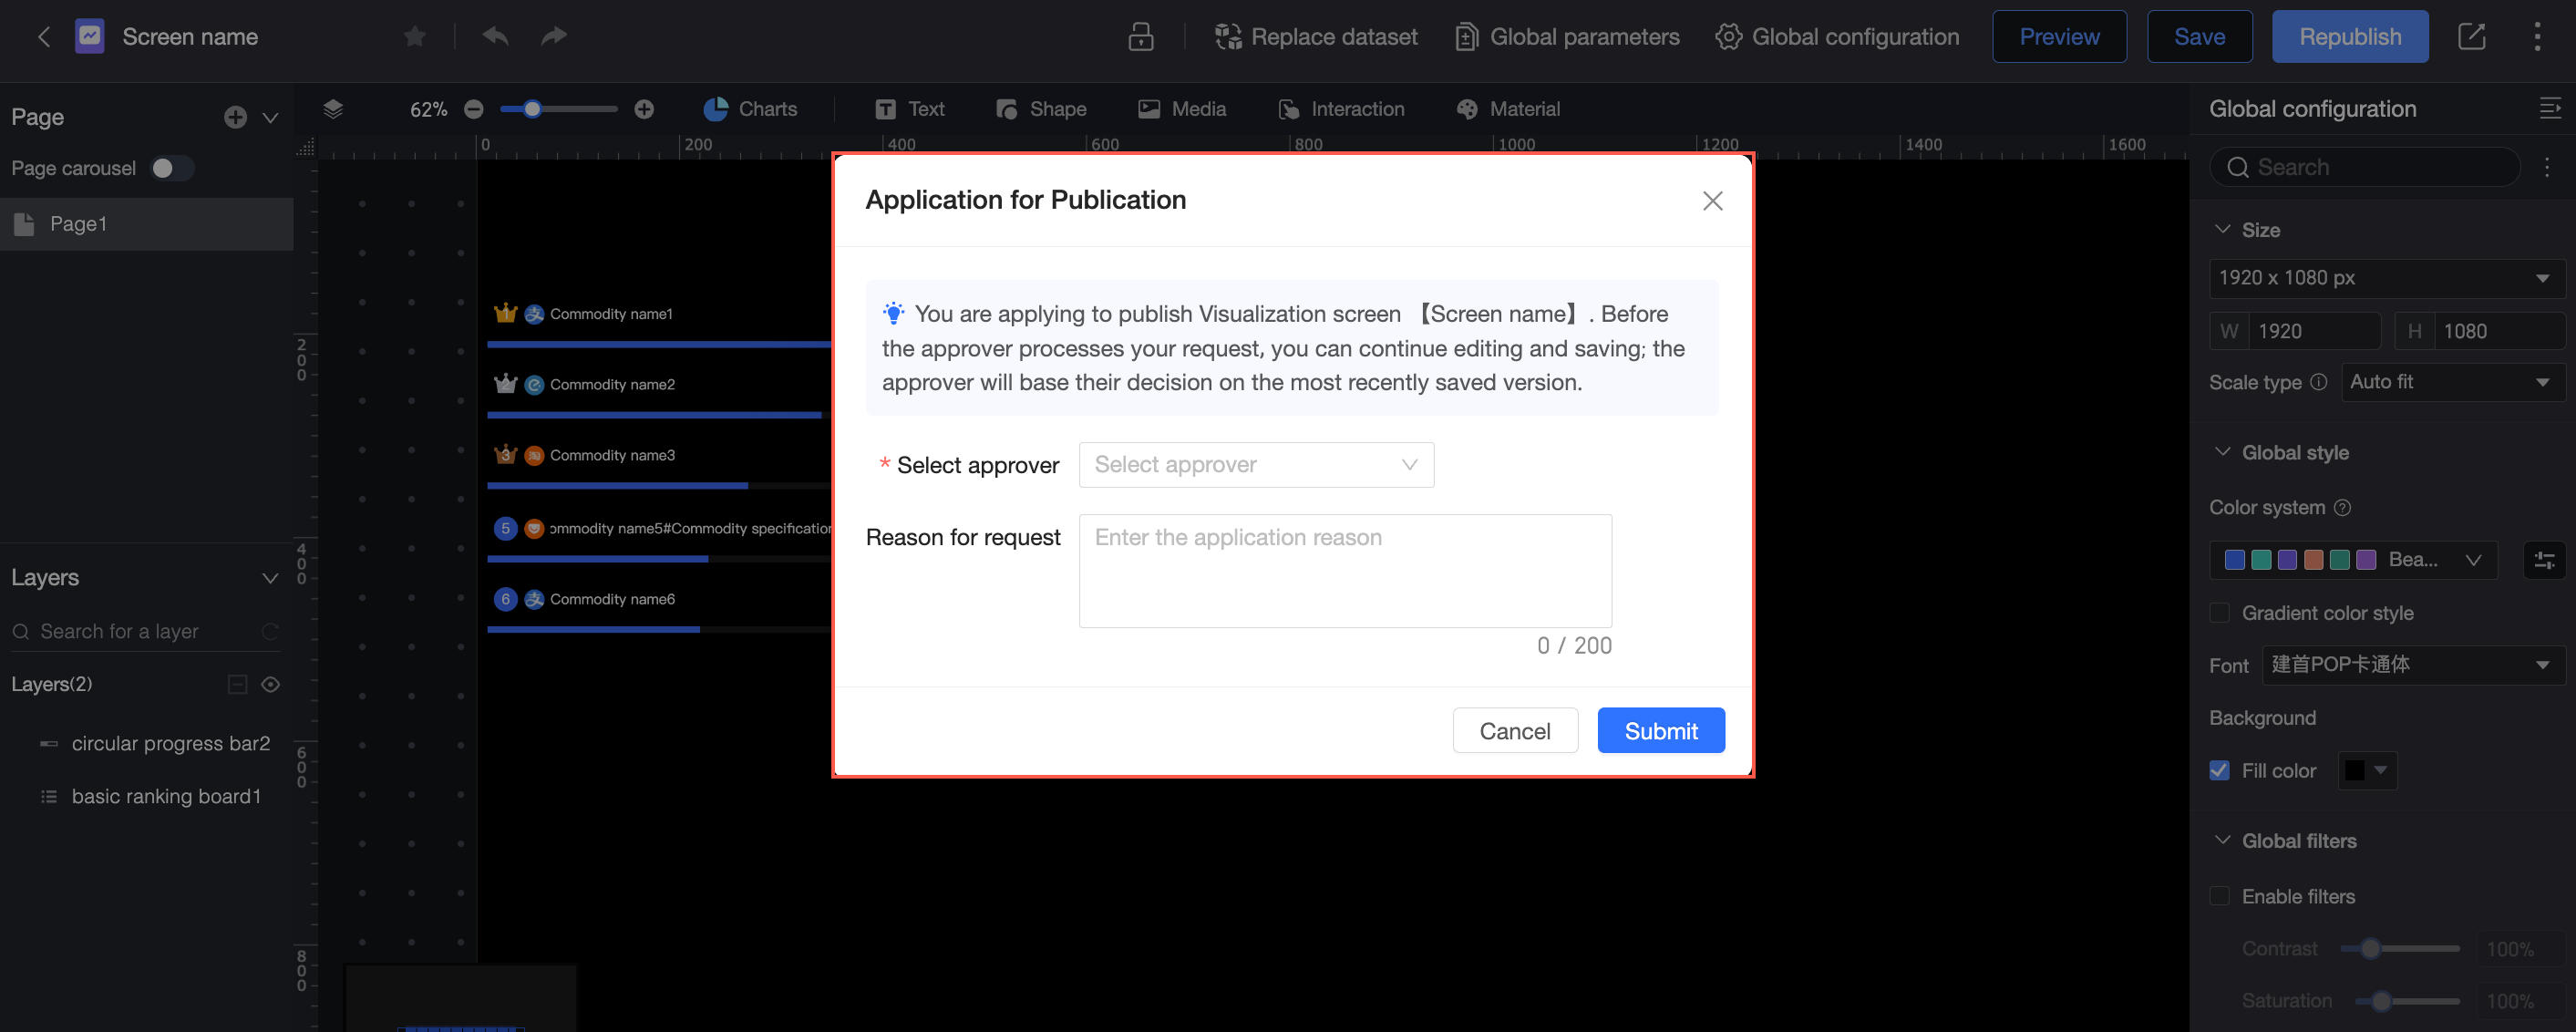
You can keep editing after submitting a publishing request. If you save again, the published version becomes the latest saved version.
Workspace administrators can publish without approval.
Share and make public
You can share or make a screen public only when it is published.
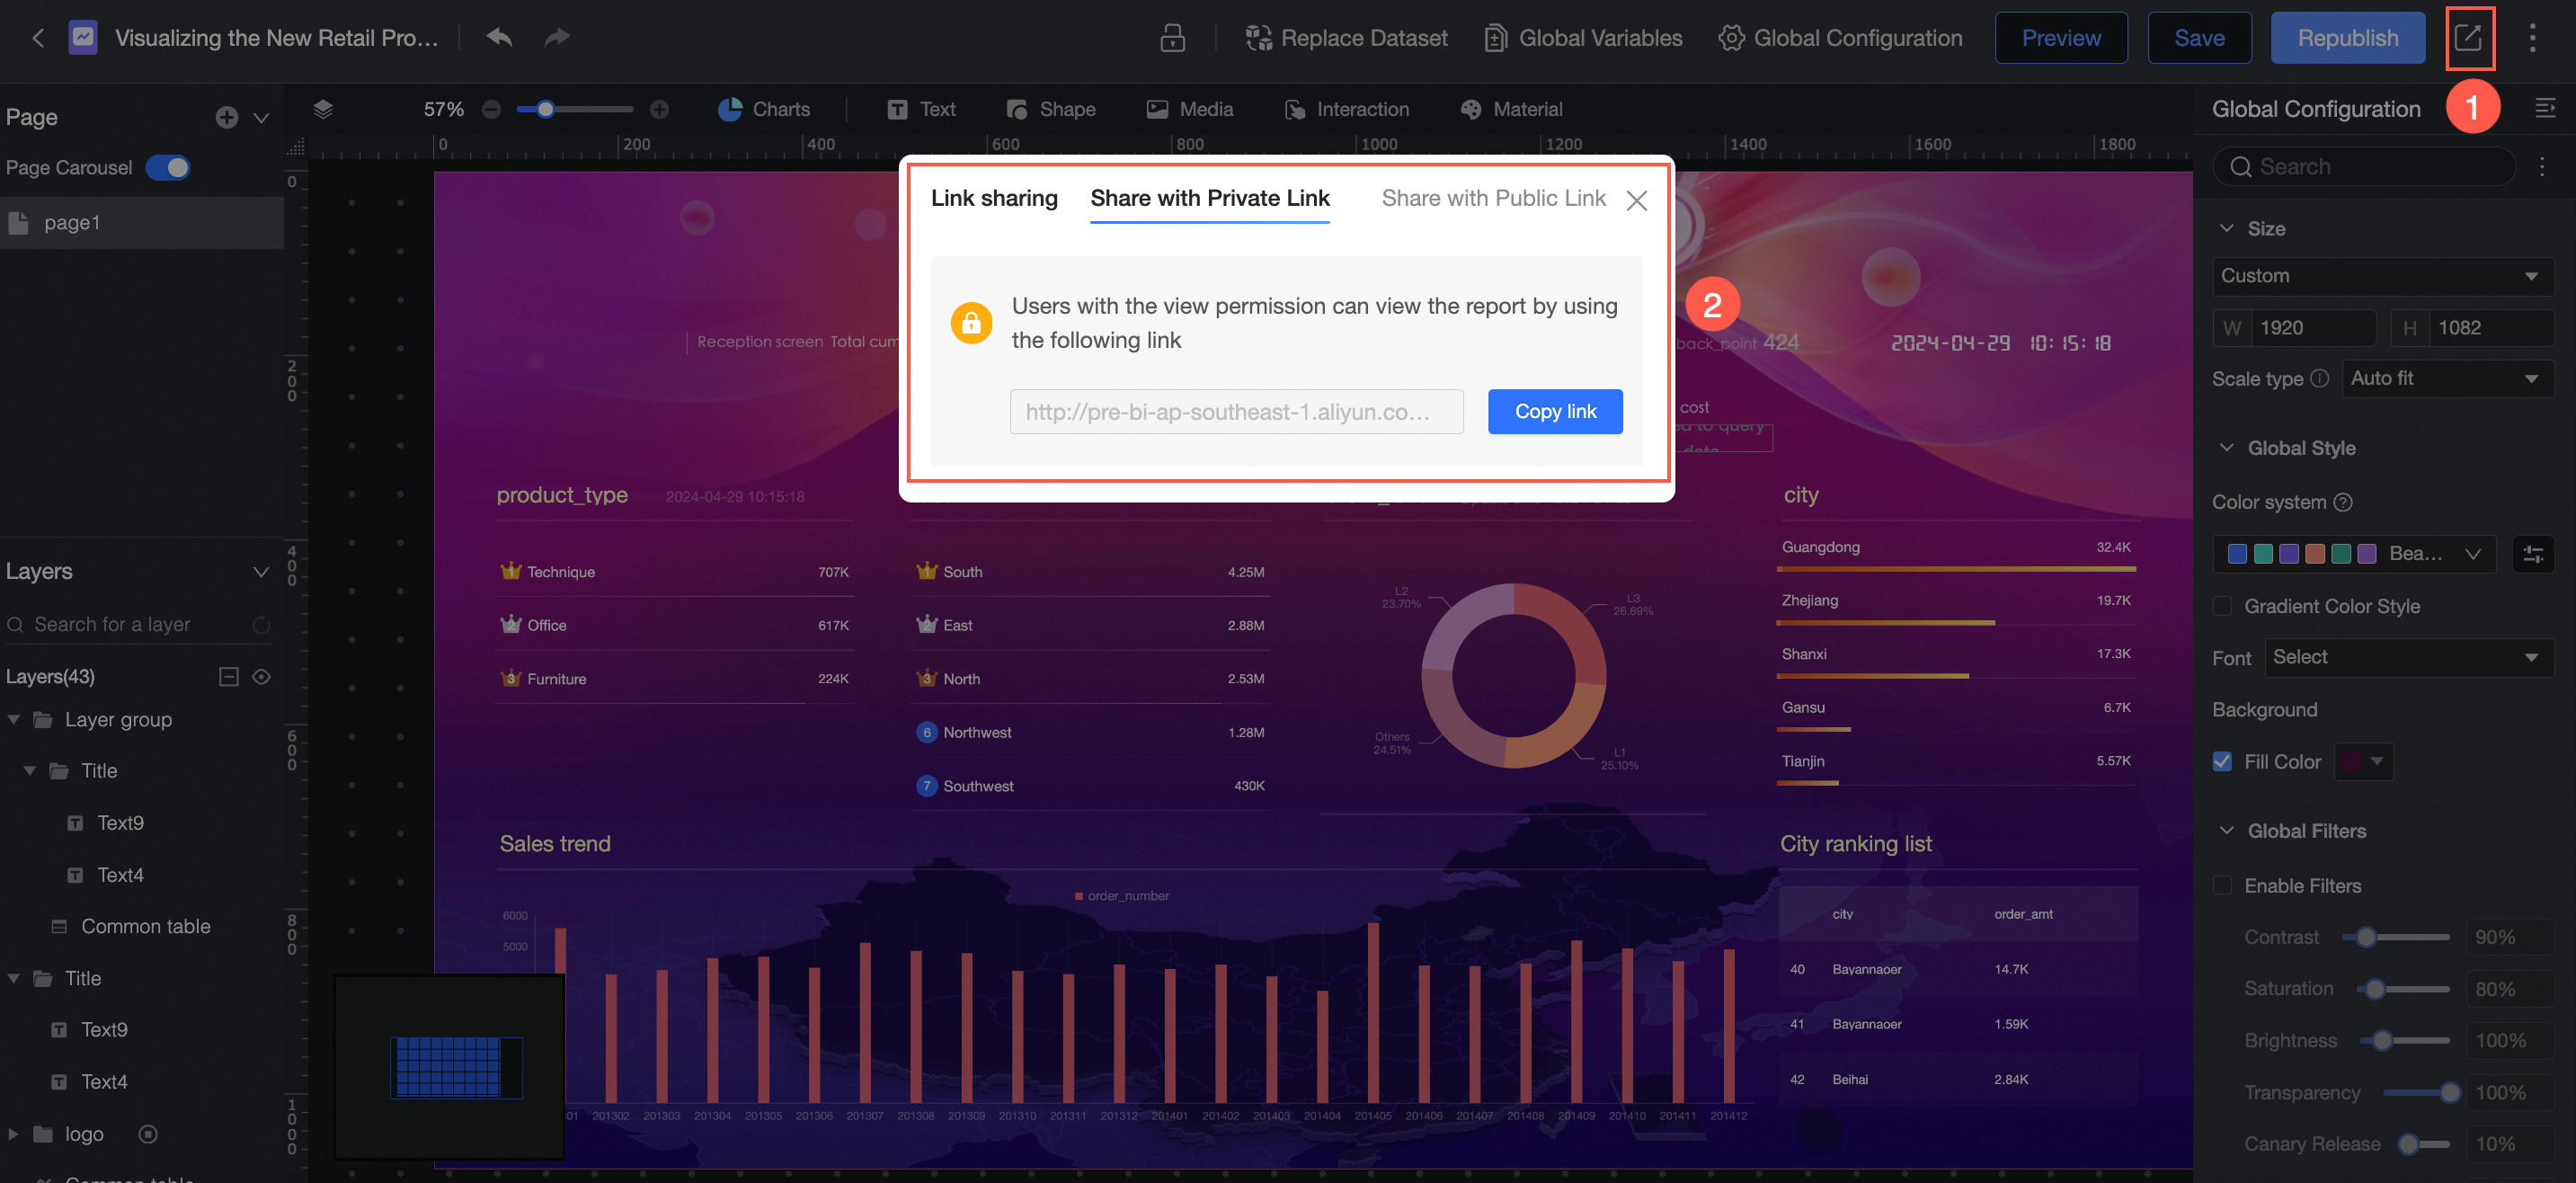
Private link sharing: Users with permission can access the generated link.
Public link sharing: Anyone can access the generated link during its validity period, without logging on to an Alibaba Cloud account.
Save as
You can rename the screen or change its save location.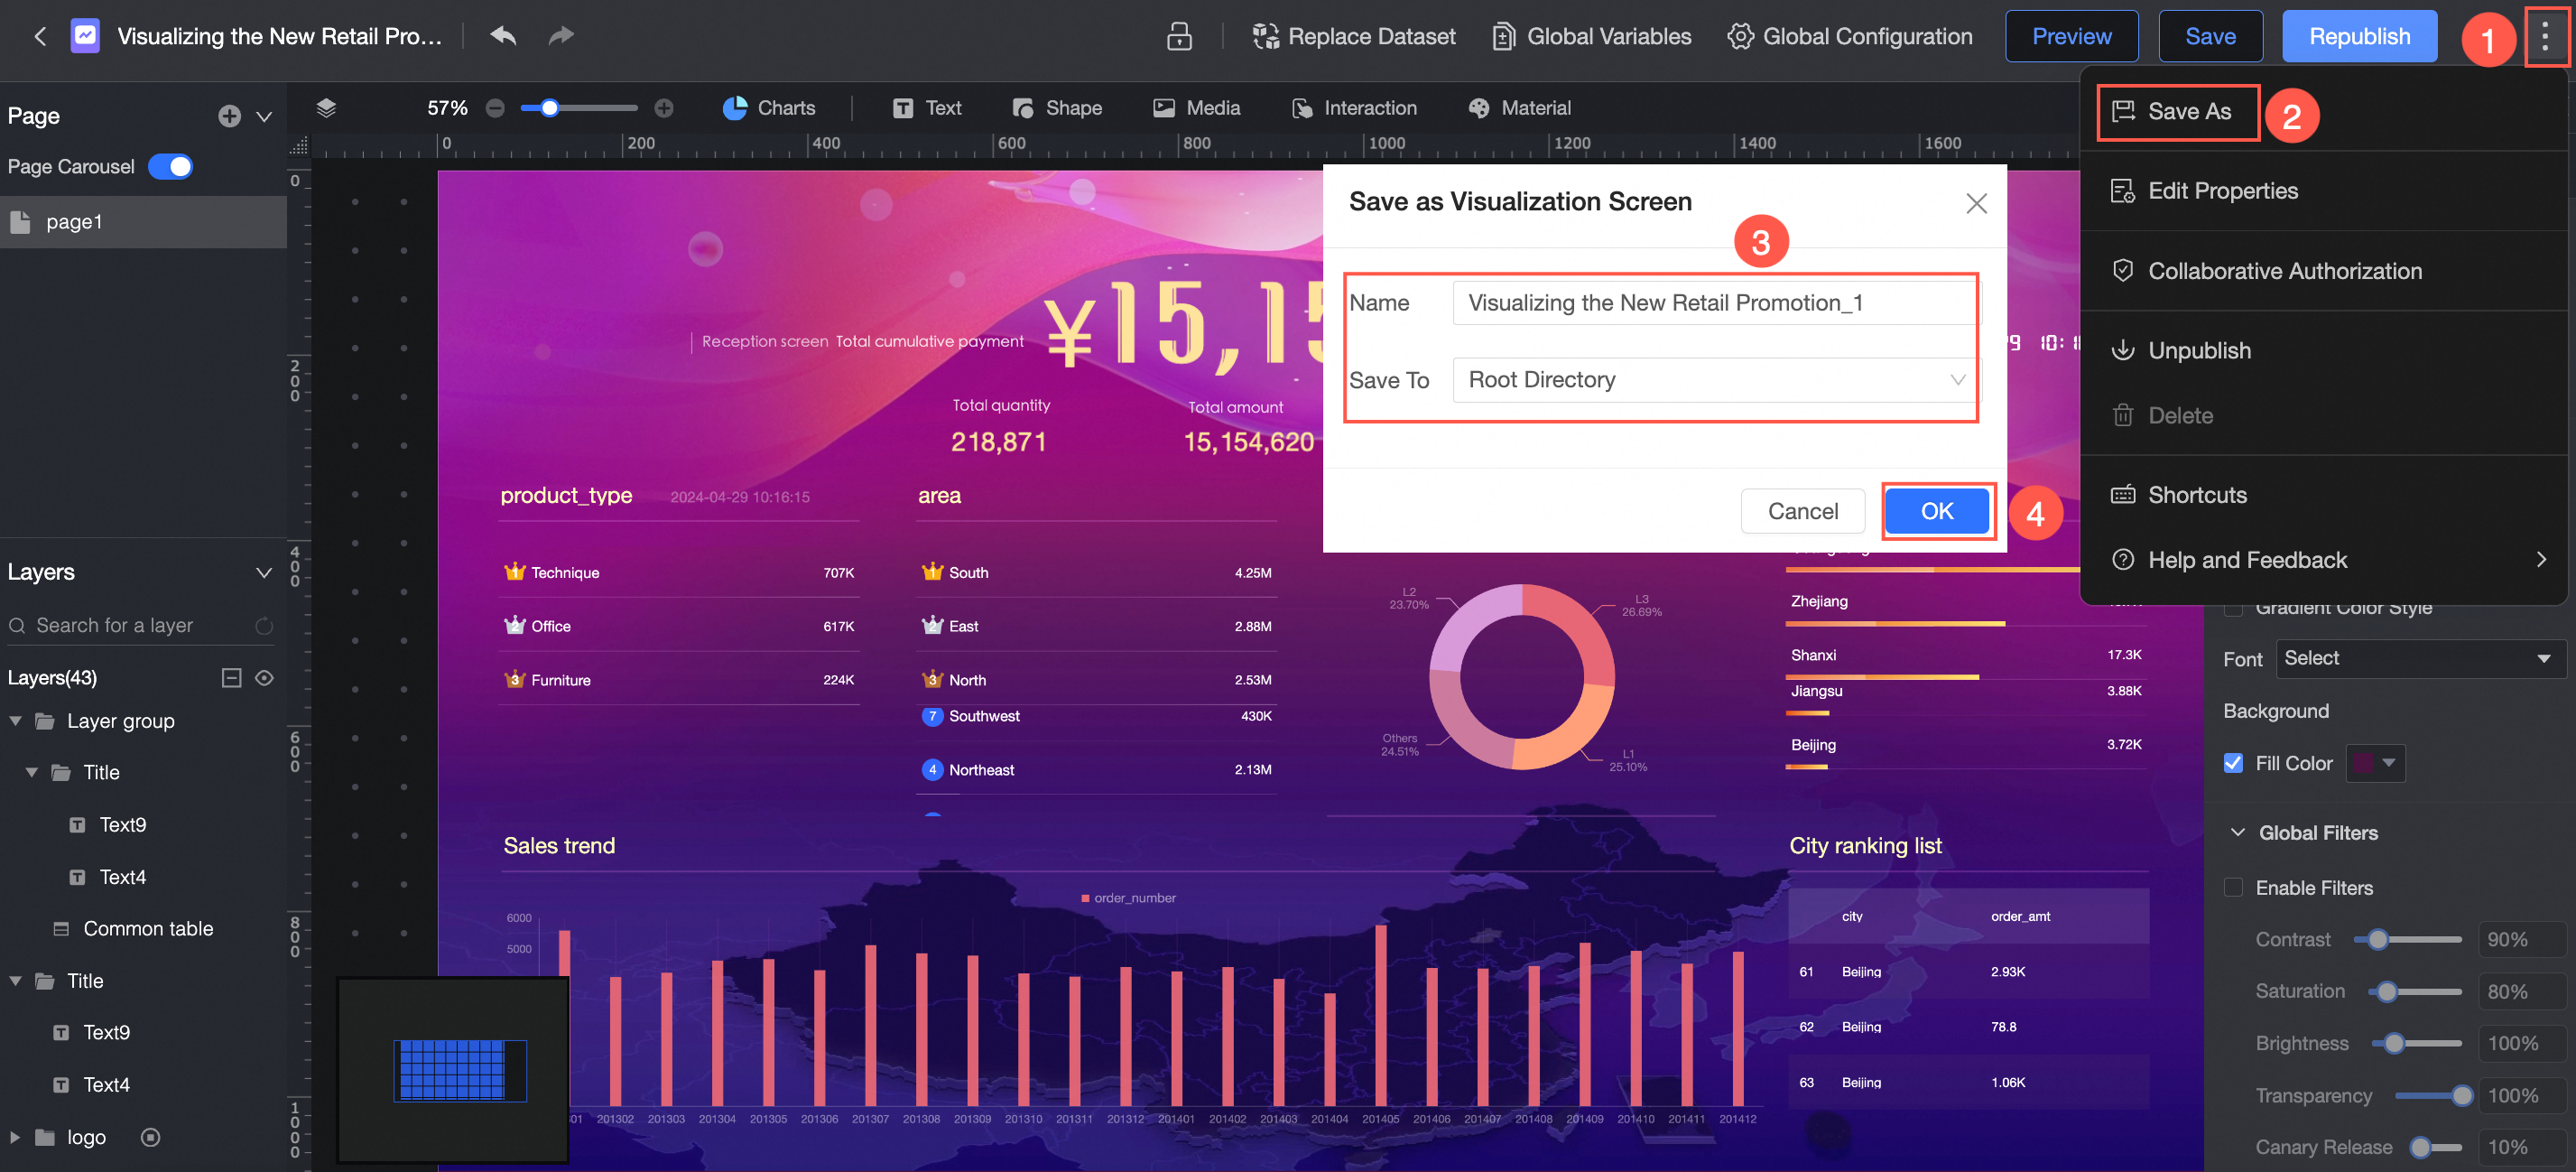
Properties
You can change the title, owner, or add notes to the screen.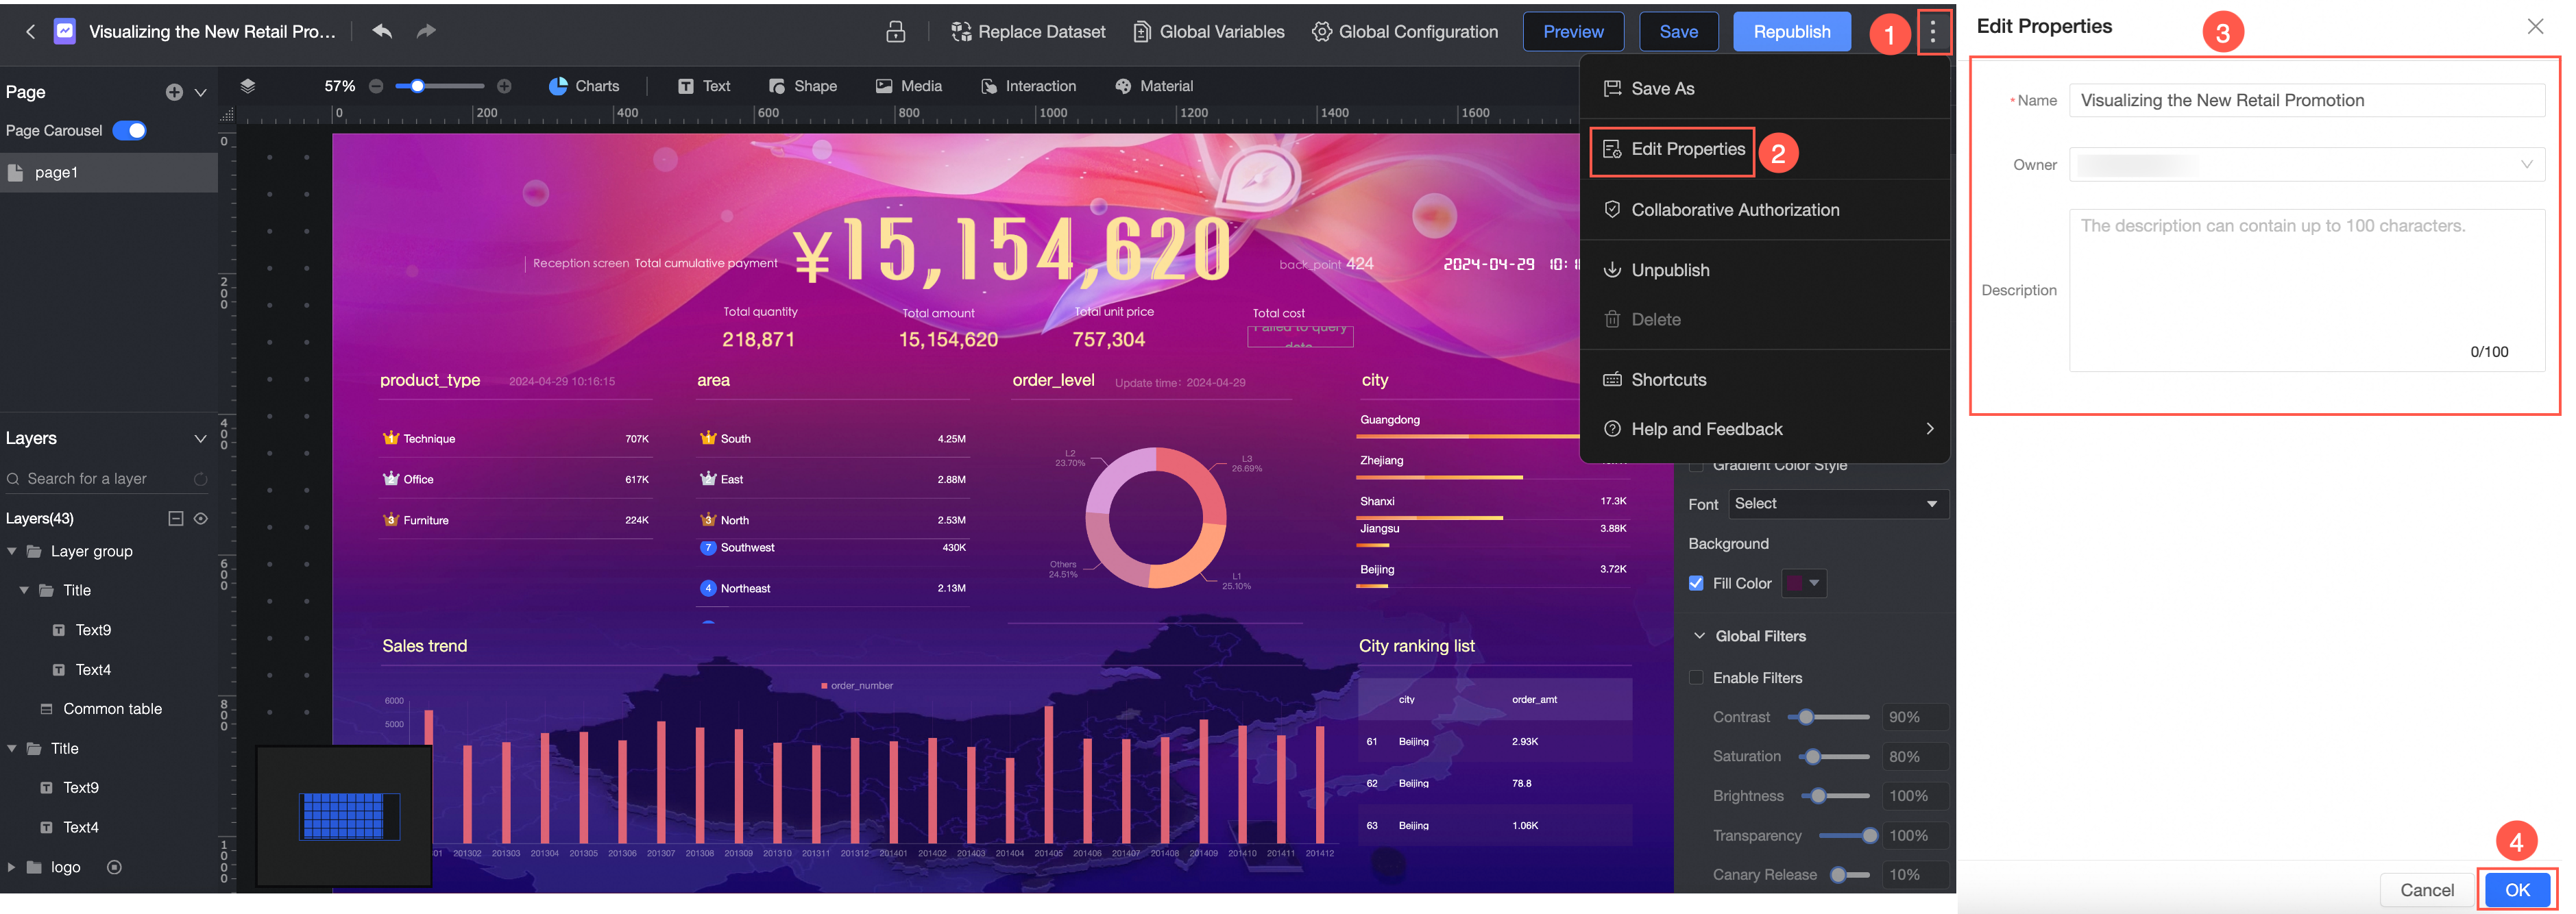
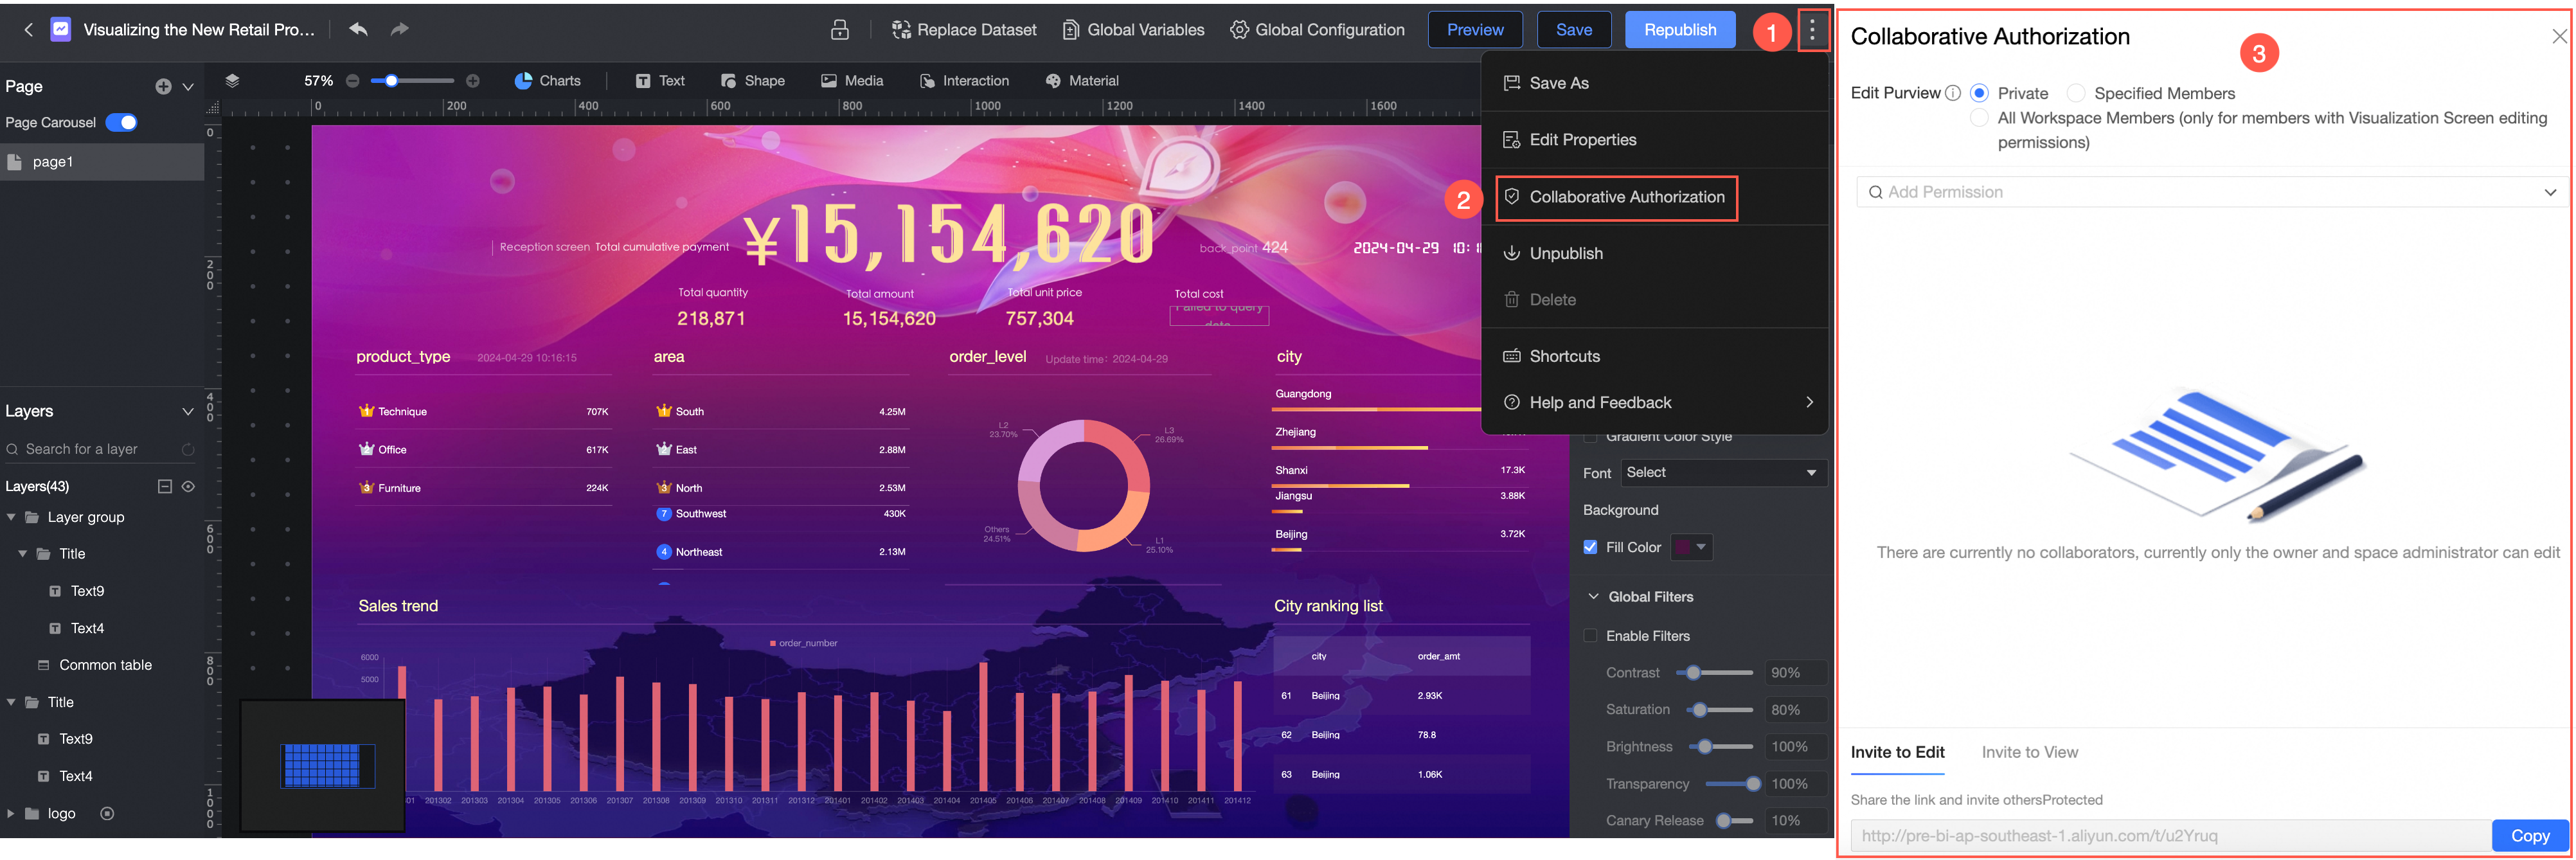
Collaborative authorization
Customize edit permissions. For details, see Authorization Settings.
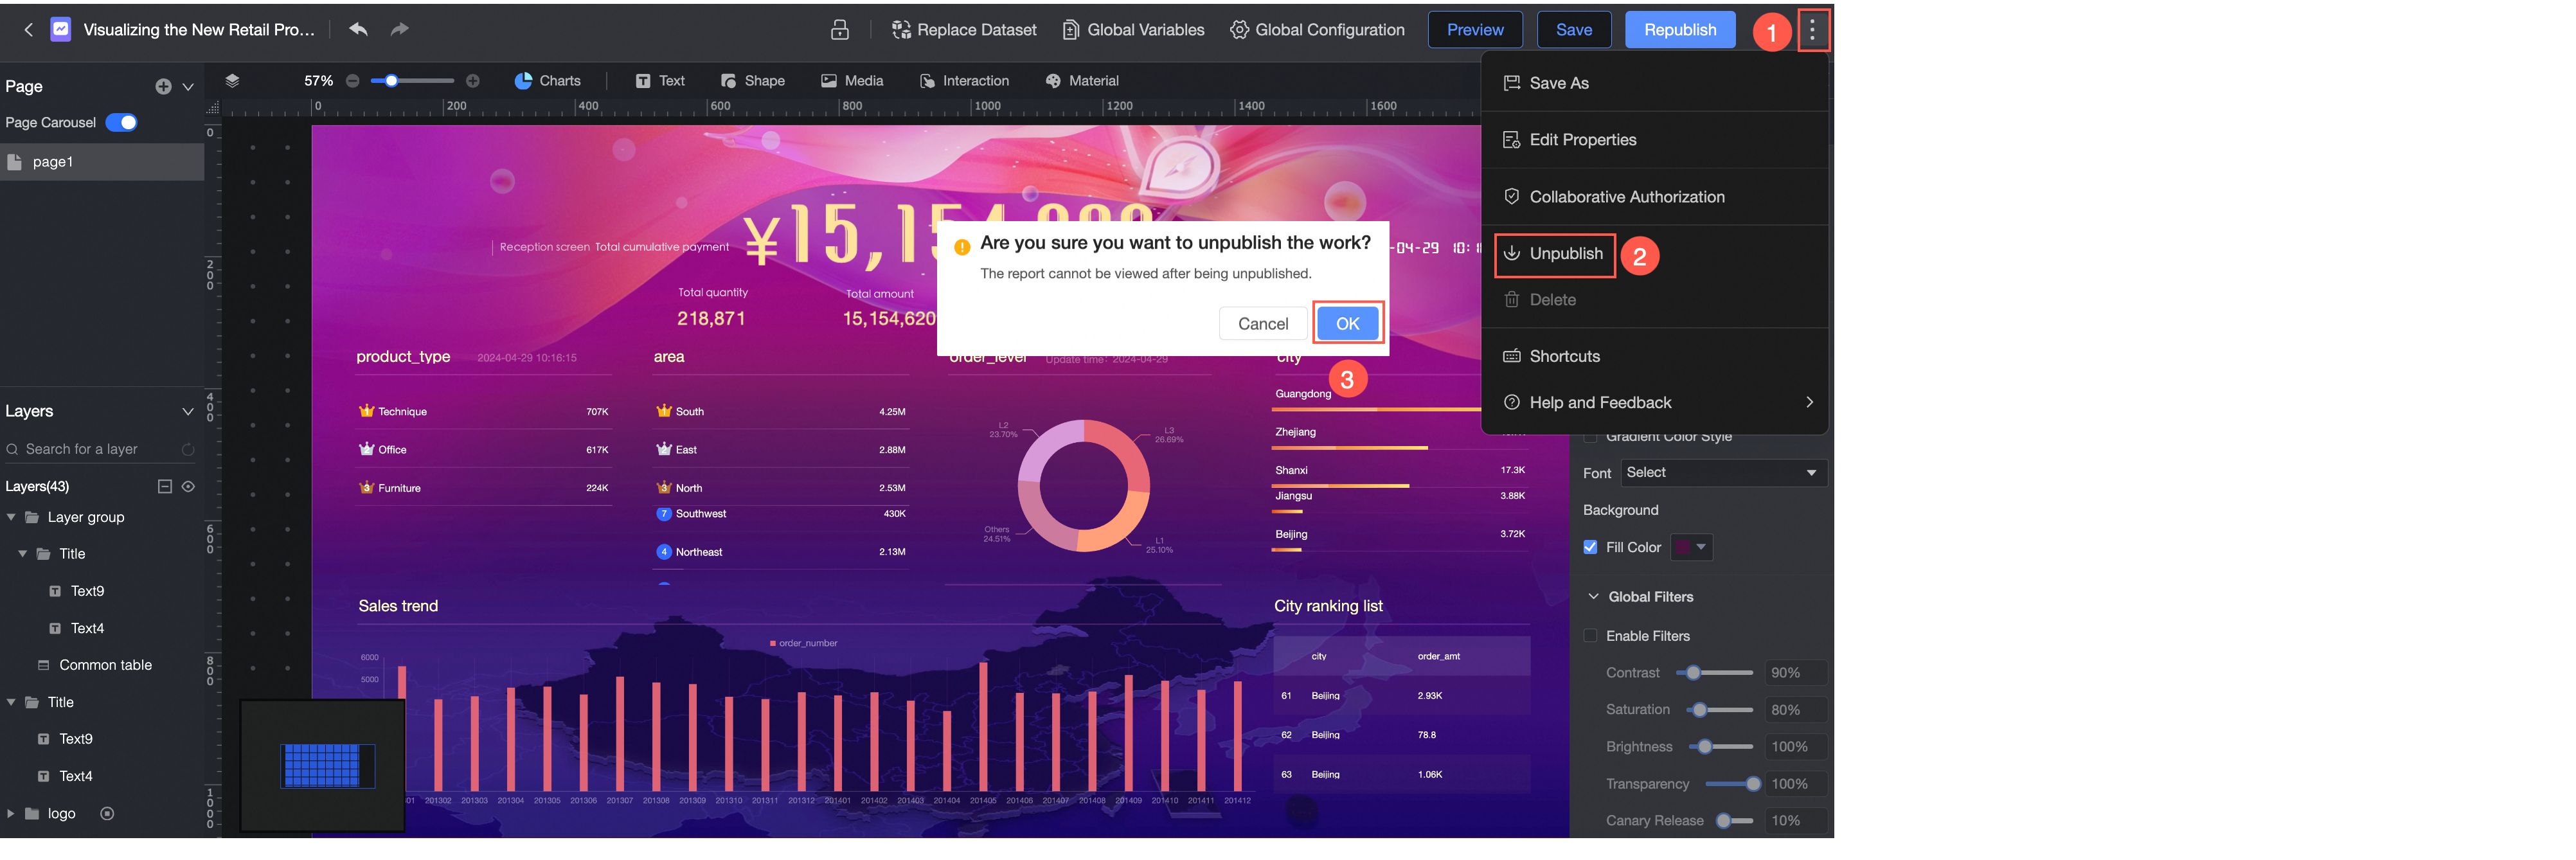
Unpublish
You can unpublish a screen only when it is published.
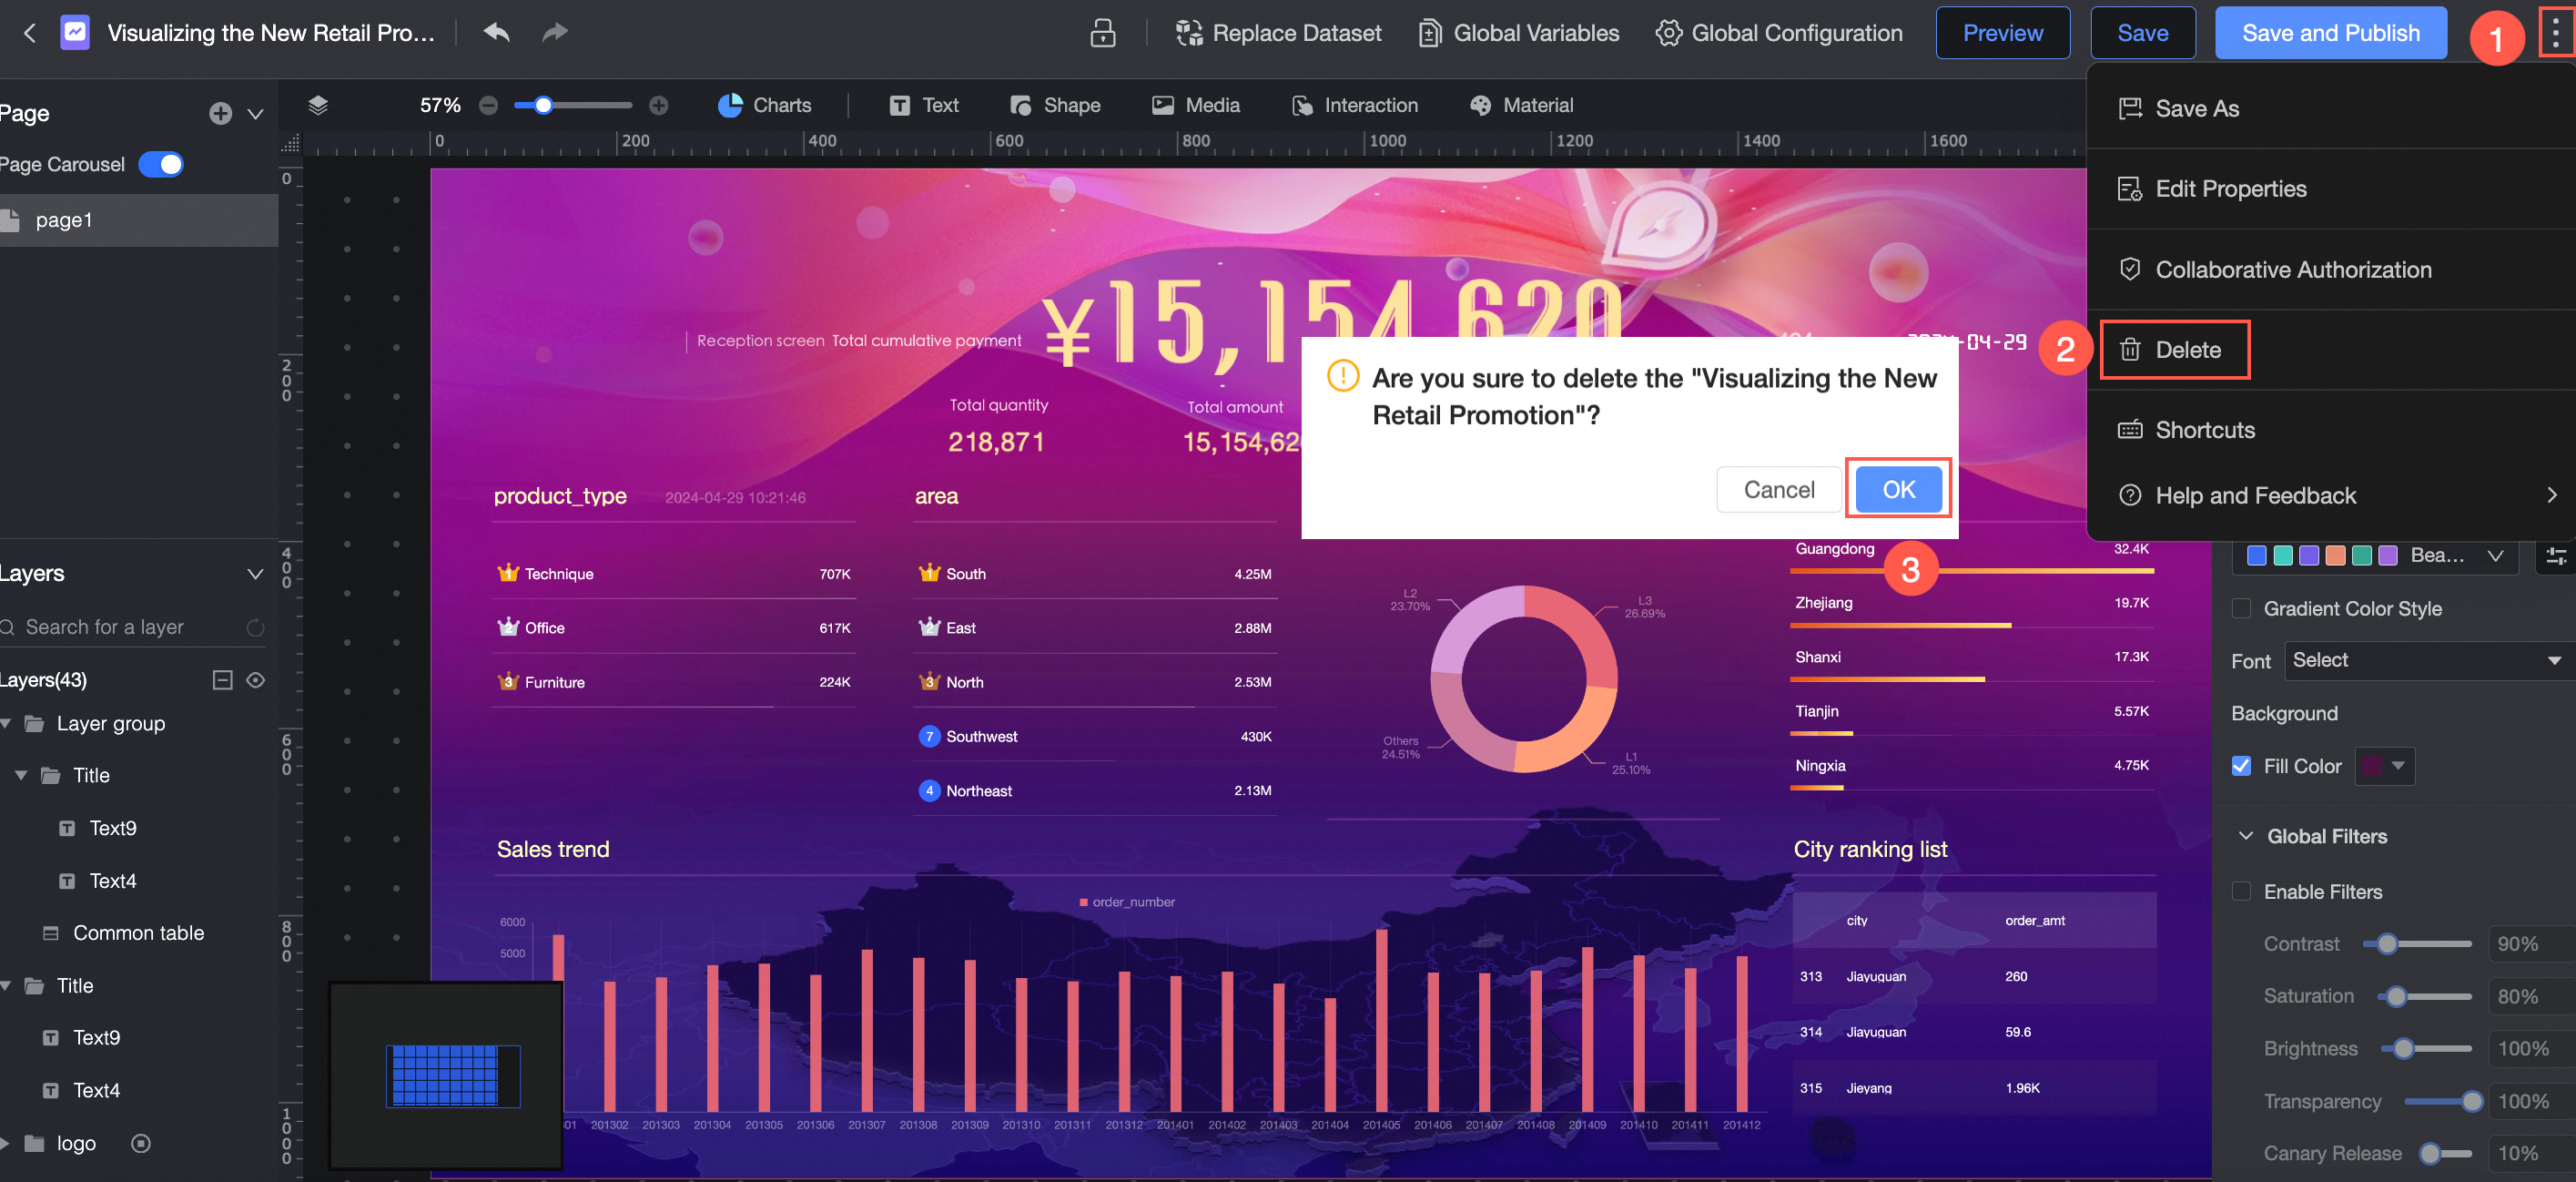
Delete
You can delete a screen only when it is unpublished or offline.
Keyboard shortcuts
Keyboard shortcuts differ by operating system.
Function | Shortcut (Windows) | Shortcut (Mac) |
Select multiple items | Ctrl+left-click | Command (⌘)+left-click |
Undo | Ctrl+Z | Command (⌘)+Z |
Redo | Ctrl+Shift+Z | Command (⌘)+Shift (⇧)+Z |
Group | Ctrl+G | Command (⌘)+G |
Ungroup | Ctrl+Shift+G | Command (⌘)+Shift (⇧)+G |
Move Up One Layer | Ctrl+] | Command (⌘)+] |
Move backward one layer | Ctrl+[ | Command (⌘)+[ |
Bring to front | Ctrl+Shift+] | Option (⌥)+Command (⌘)+] |
Send to back | Ctrl+Shift+[ | Option (⌥)+Command (⌘)+[ |
Cut | Ctrl+X | Command (⌘)+X |
Copy | Ctrl+C | Command (⌘)+C |
Paste | Ctrl+V | Command (⌘)+V |
Lock | Ctrl+L | Command (⌘)+L |
Hide | Ctrl+H | Command (⌘)+H |
Delete | Backspace (←) | Delete (⌫) |
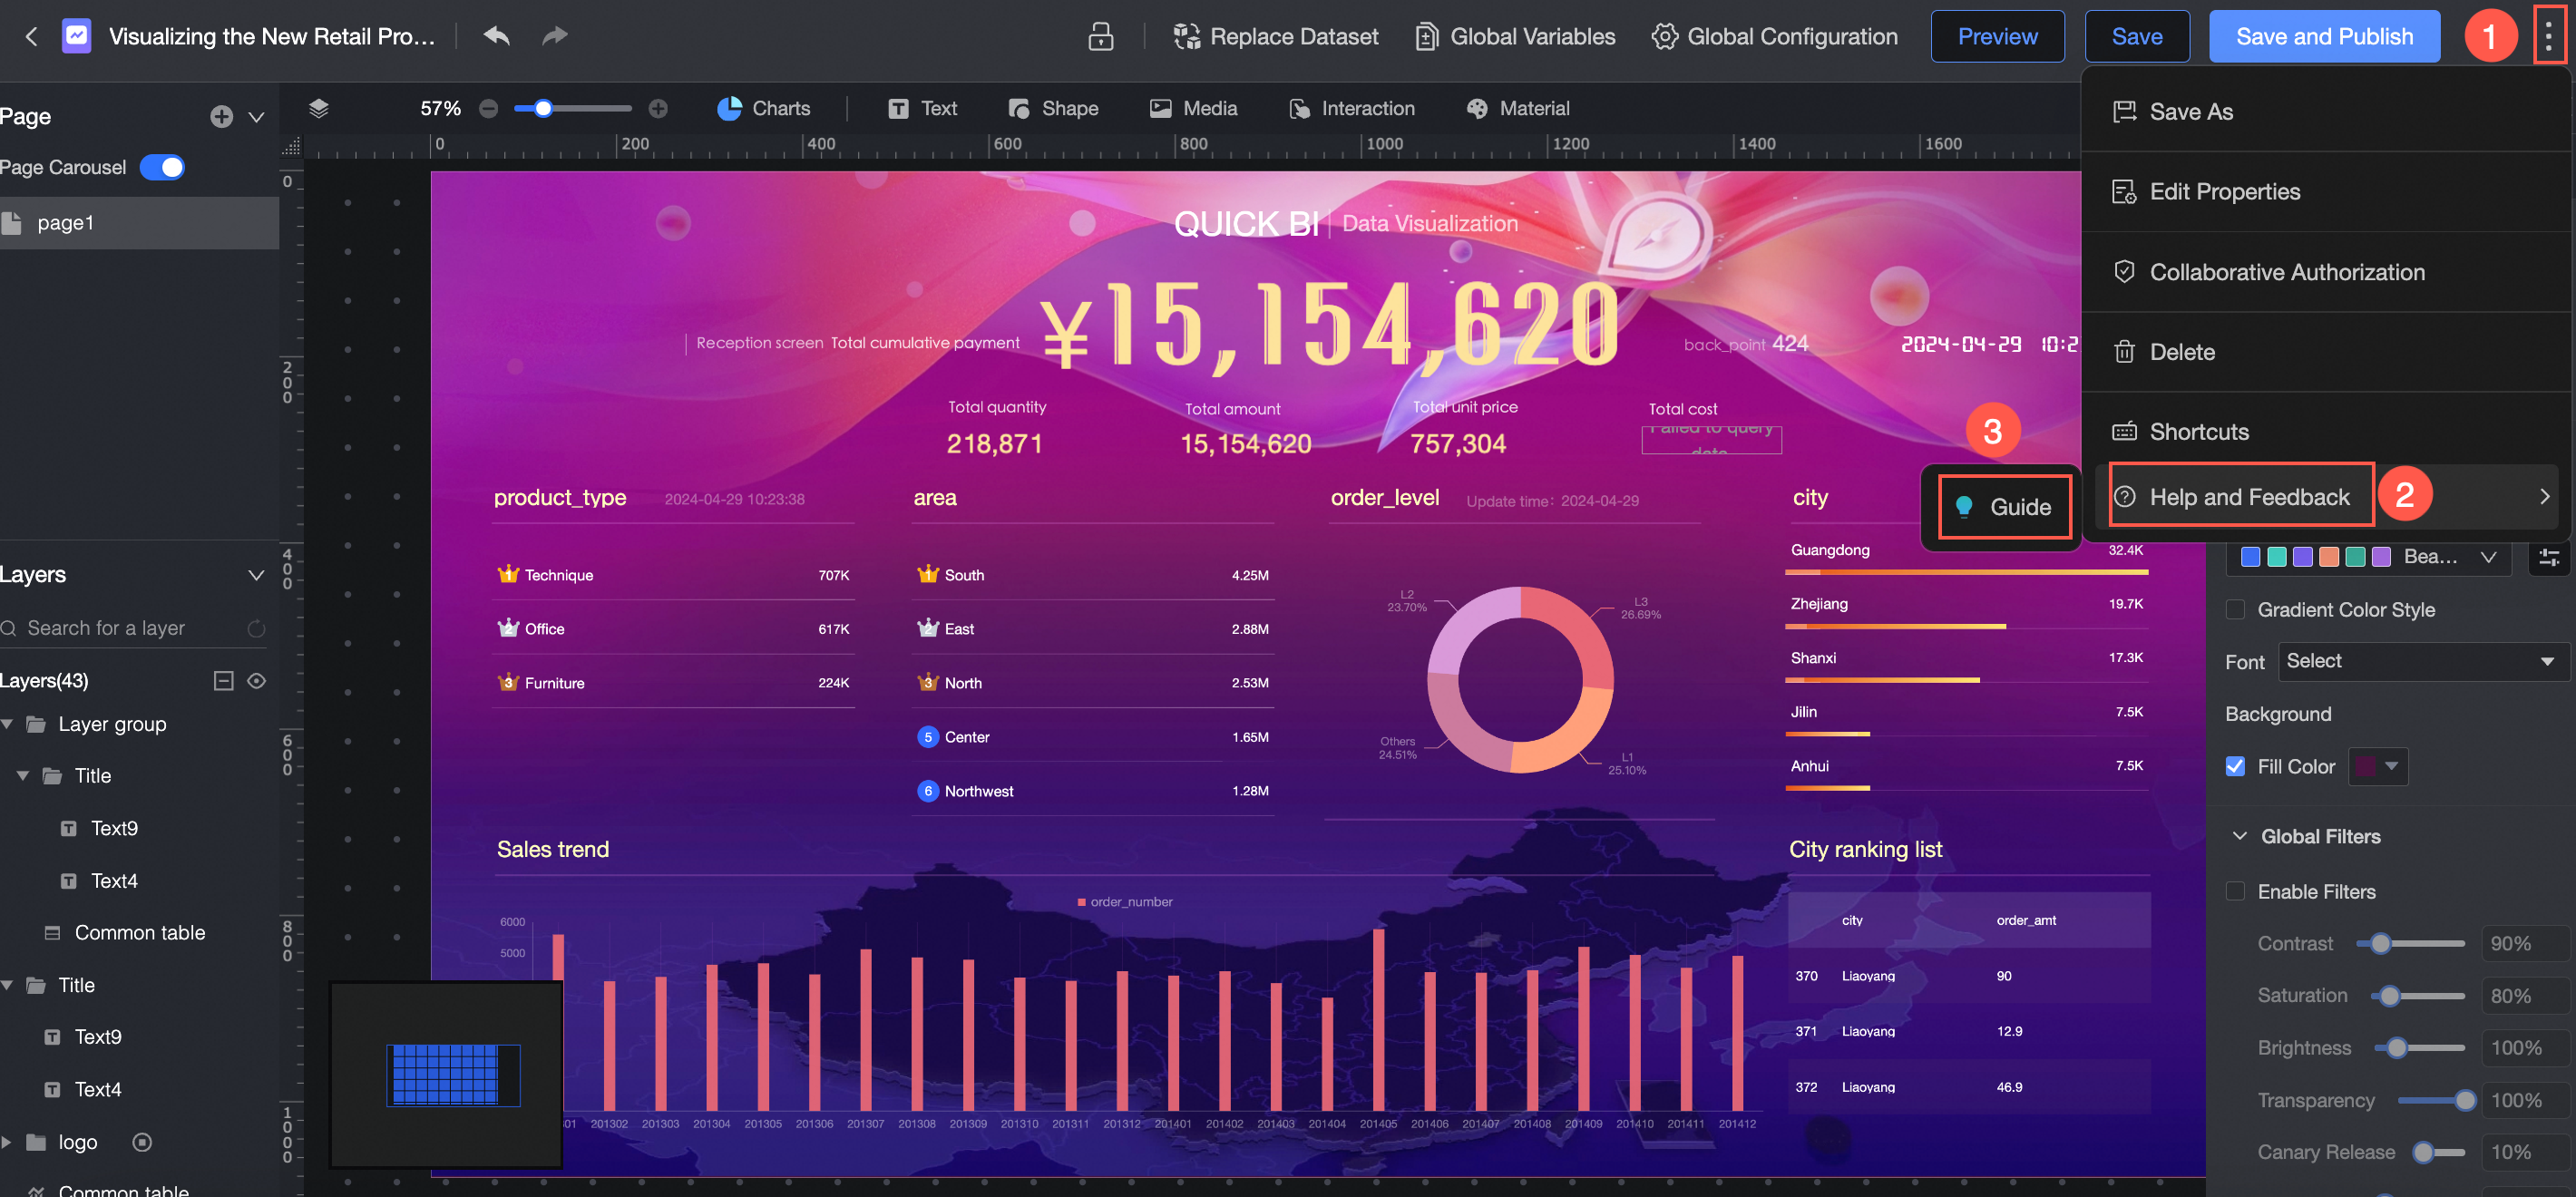
Help and feedback
When you first start using the data visualization screen, use the Help and feedback feature to view the New user guide tutorial.
Widget library
The data visualization screen provides a range of components for creating diverse screens, including eight chart types, rich text, shapes, media, interactive controls, and assets.
The feature entry point is: 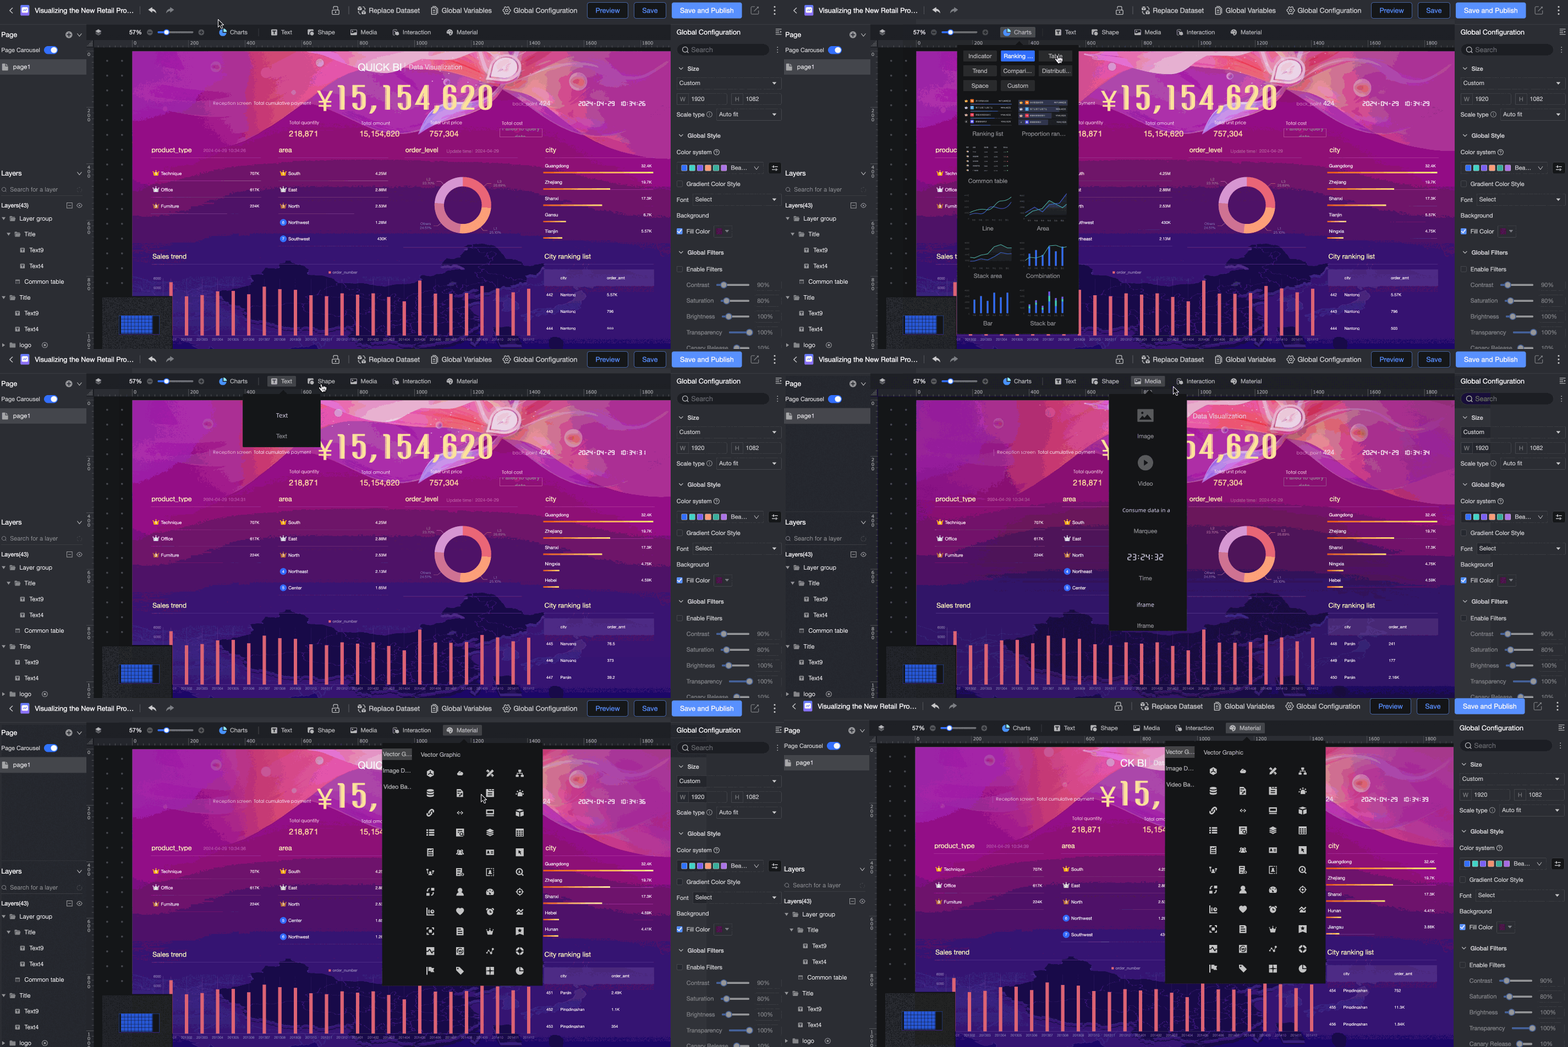
Charts
Metric class
Media
Interactive
Assets
Page configuration area
You can add up to 10 pages.
You can add pages (①), set page carousels (②), or click More (③) to select Hide (④) or Delete (⑤).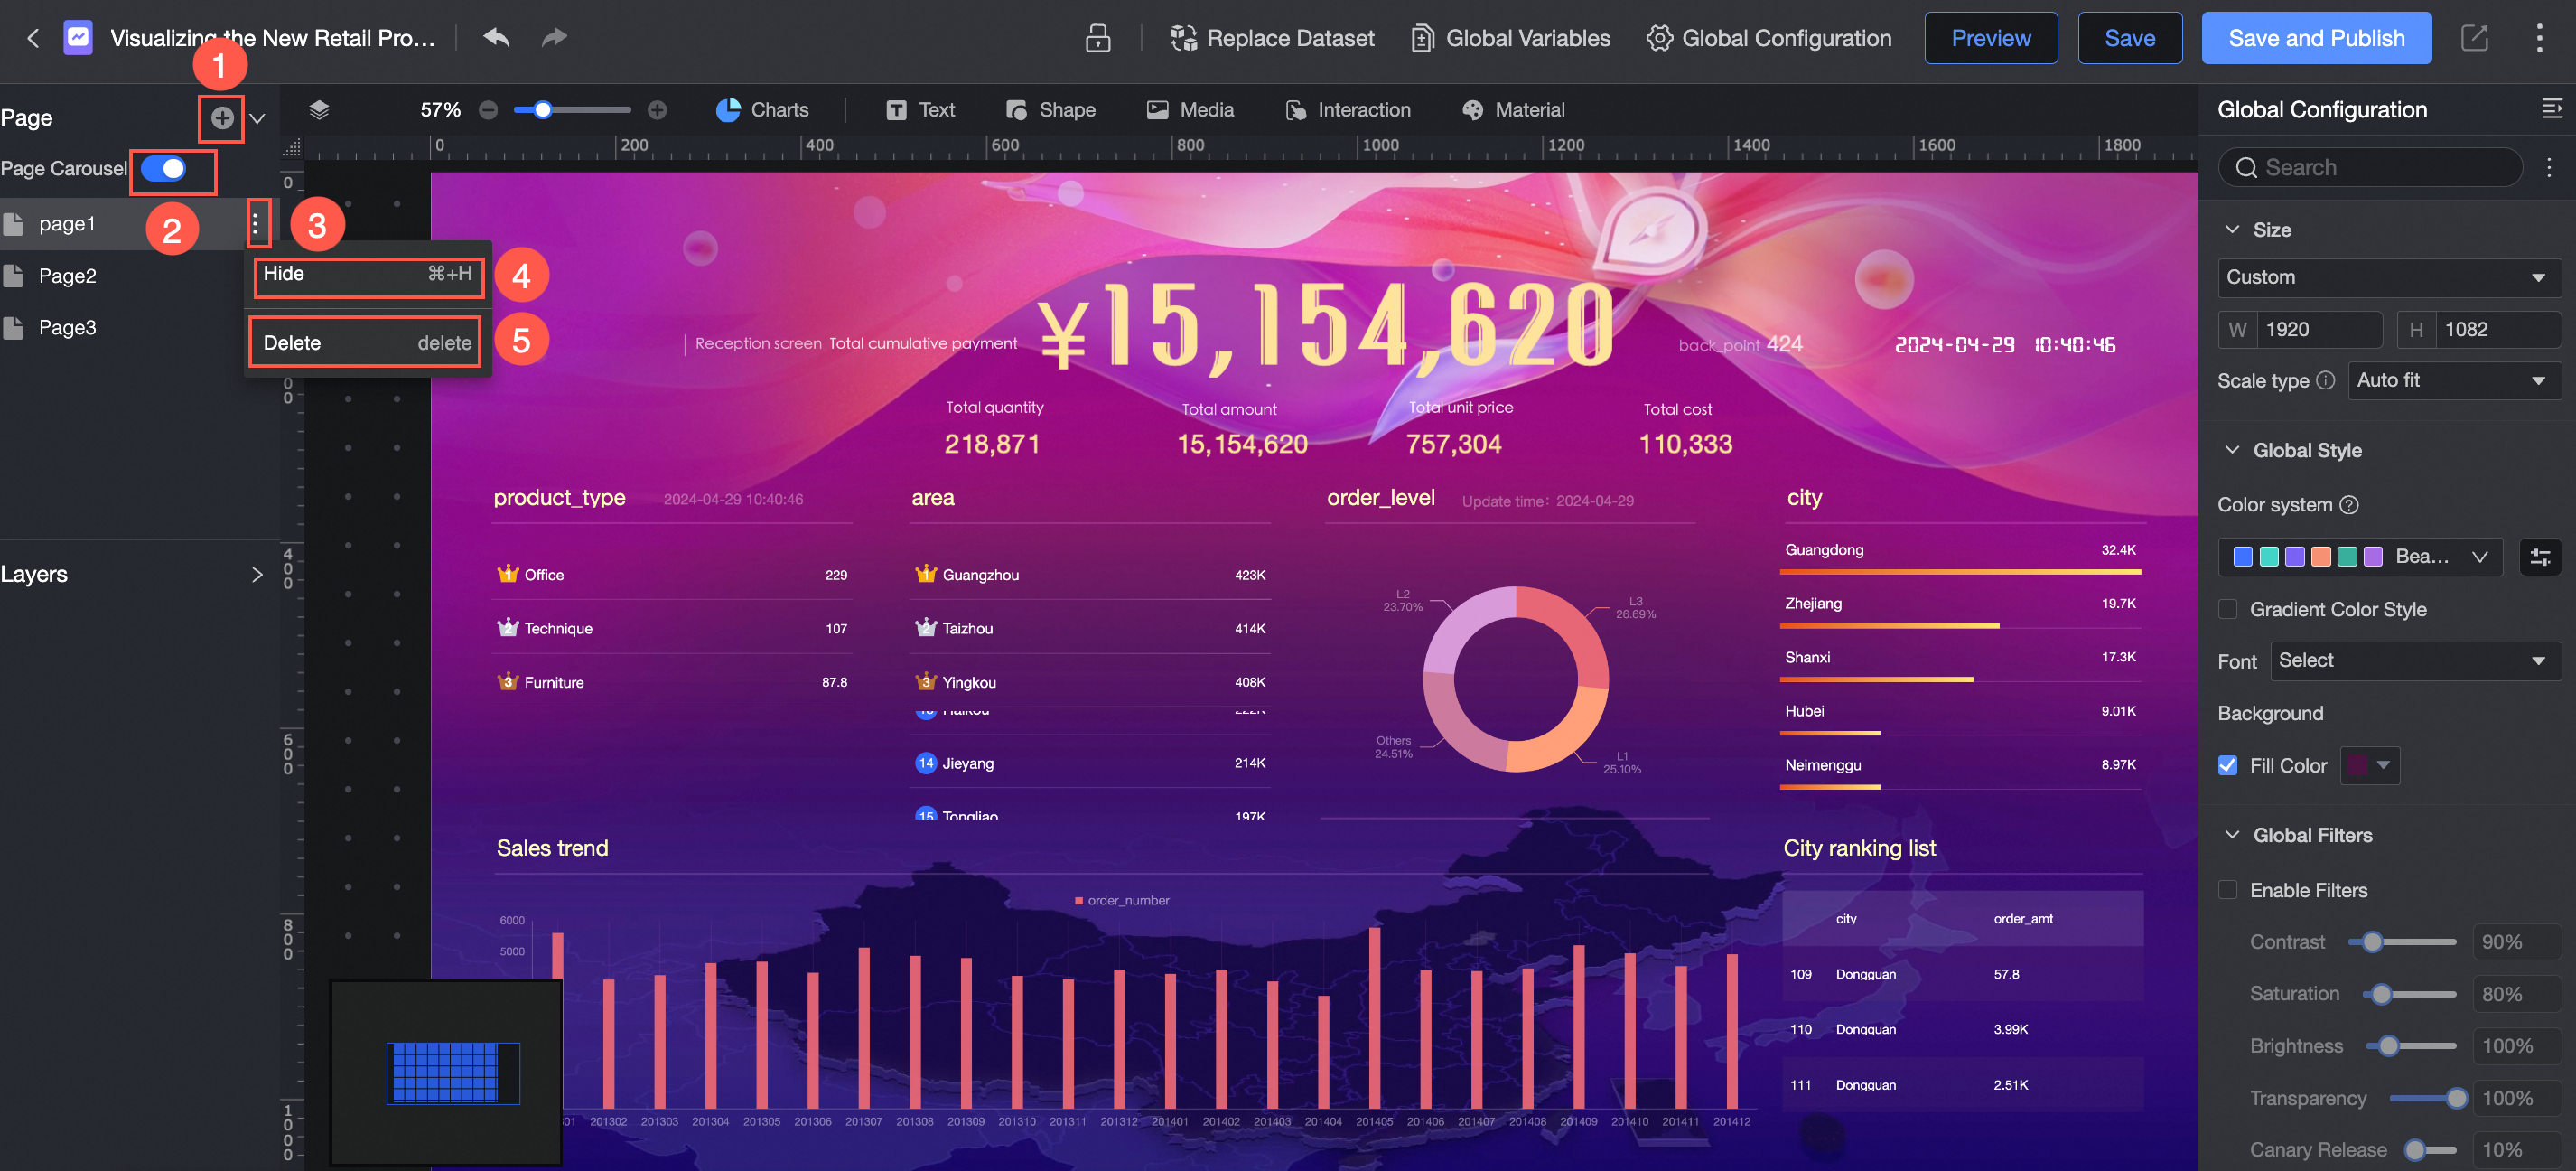
Layer configuration area
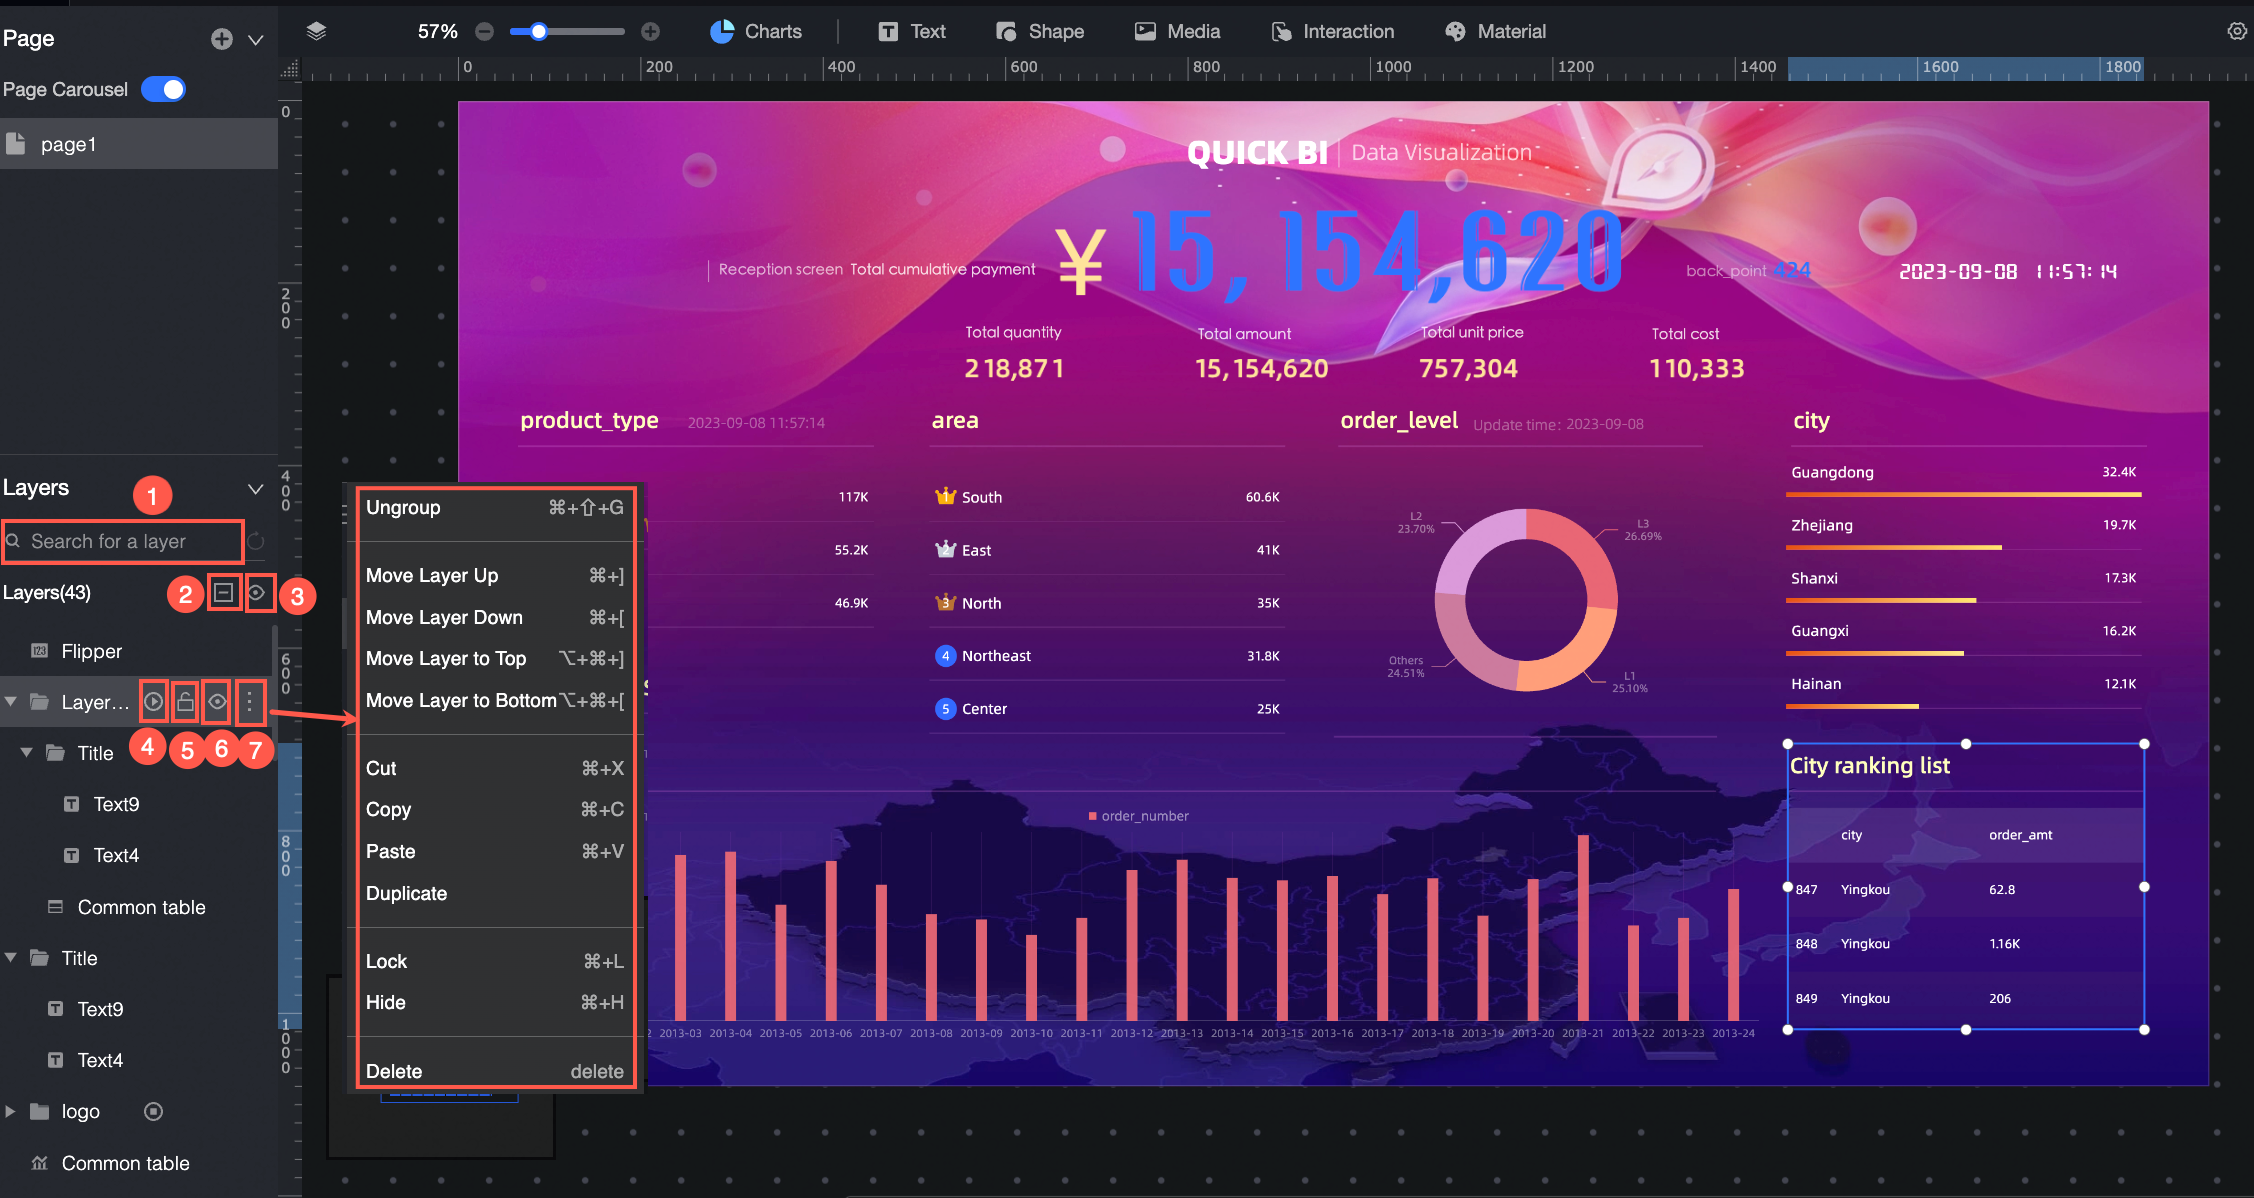
Support multiple layers. Group layers, set layer carousels, lock layers, or hide layers.
① Search layers
② Collapse all layers
③ Hide all layers
④ Carousel layers
⑤ Unlock or lock layers
⑥ Show or hide layer groups
⑦ Layer group actions (ungroup, copy, paste, etc.)
Canvas configuration area
In the top navigation bar, drag widgets onto the canvas.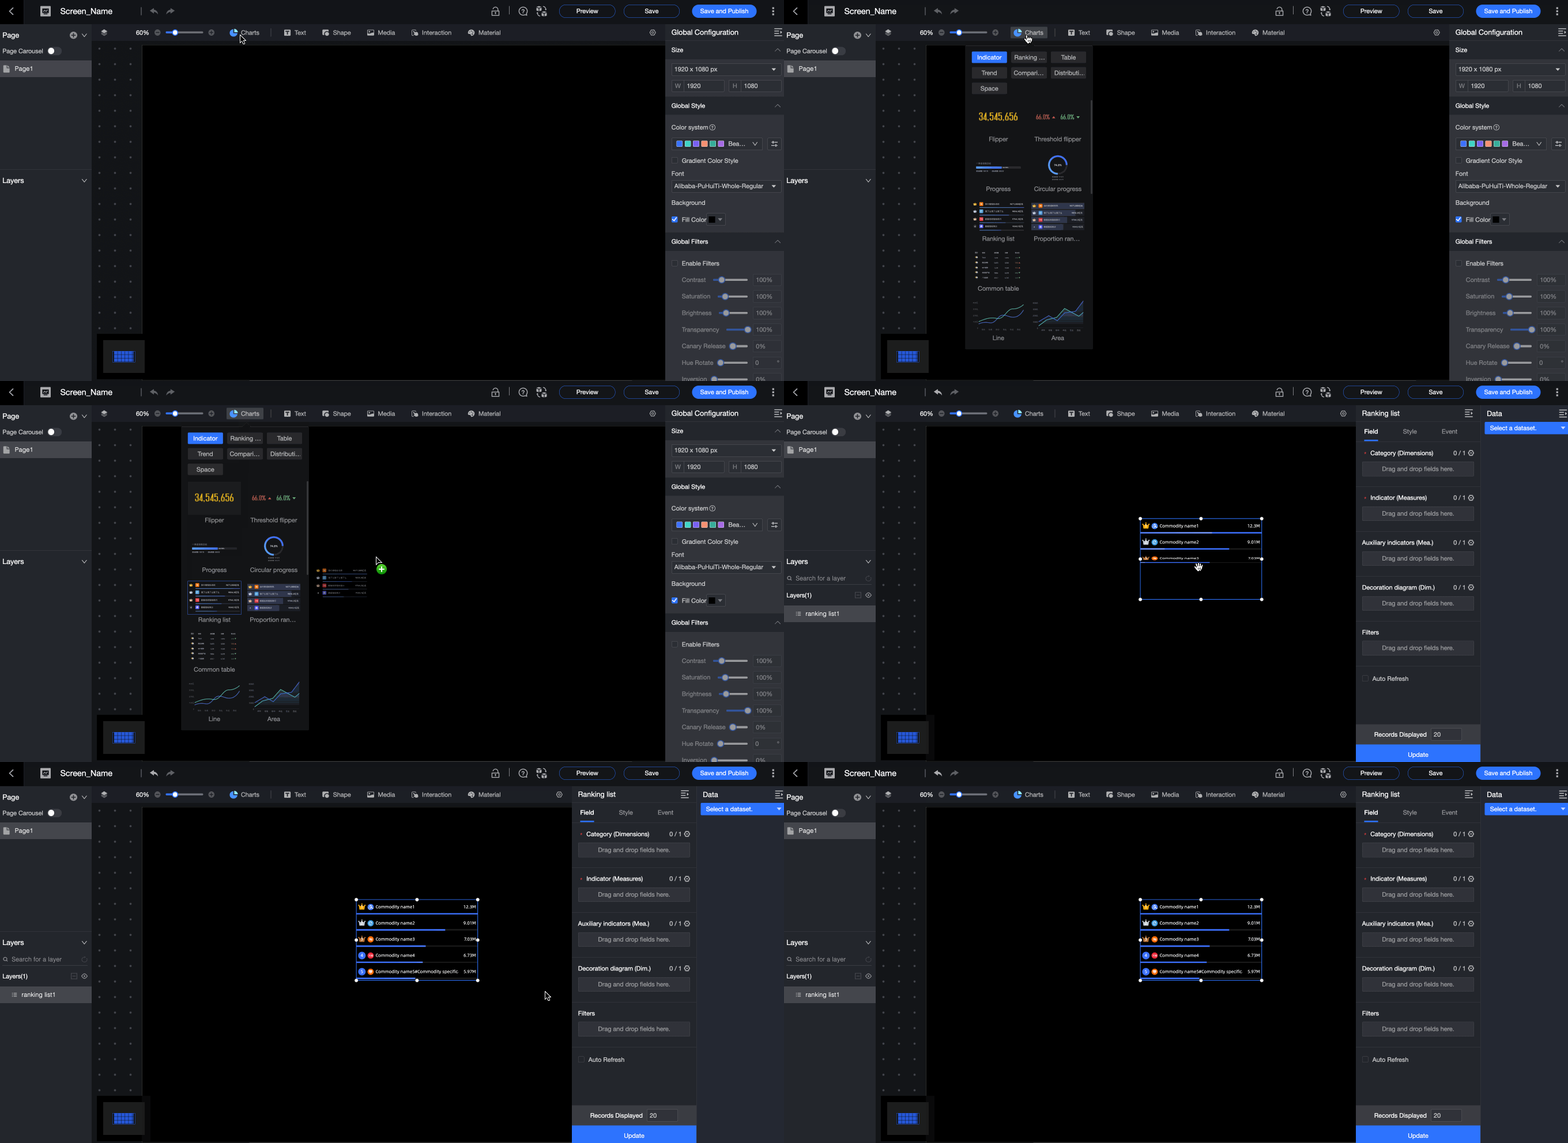
Adjust the canvas layout flexibly: The data visualization screen uses a flexible layout approach. You can drag widgets freely onto the canvas, move them pixel by pixel, and cut, copy, lock, hide, or group widgets to control the layout.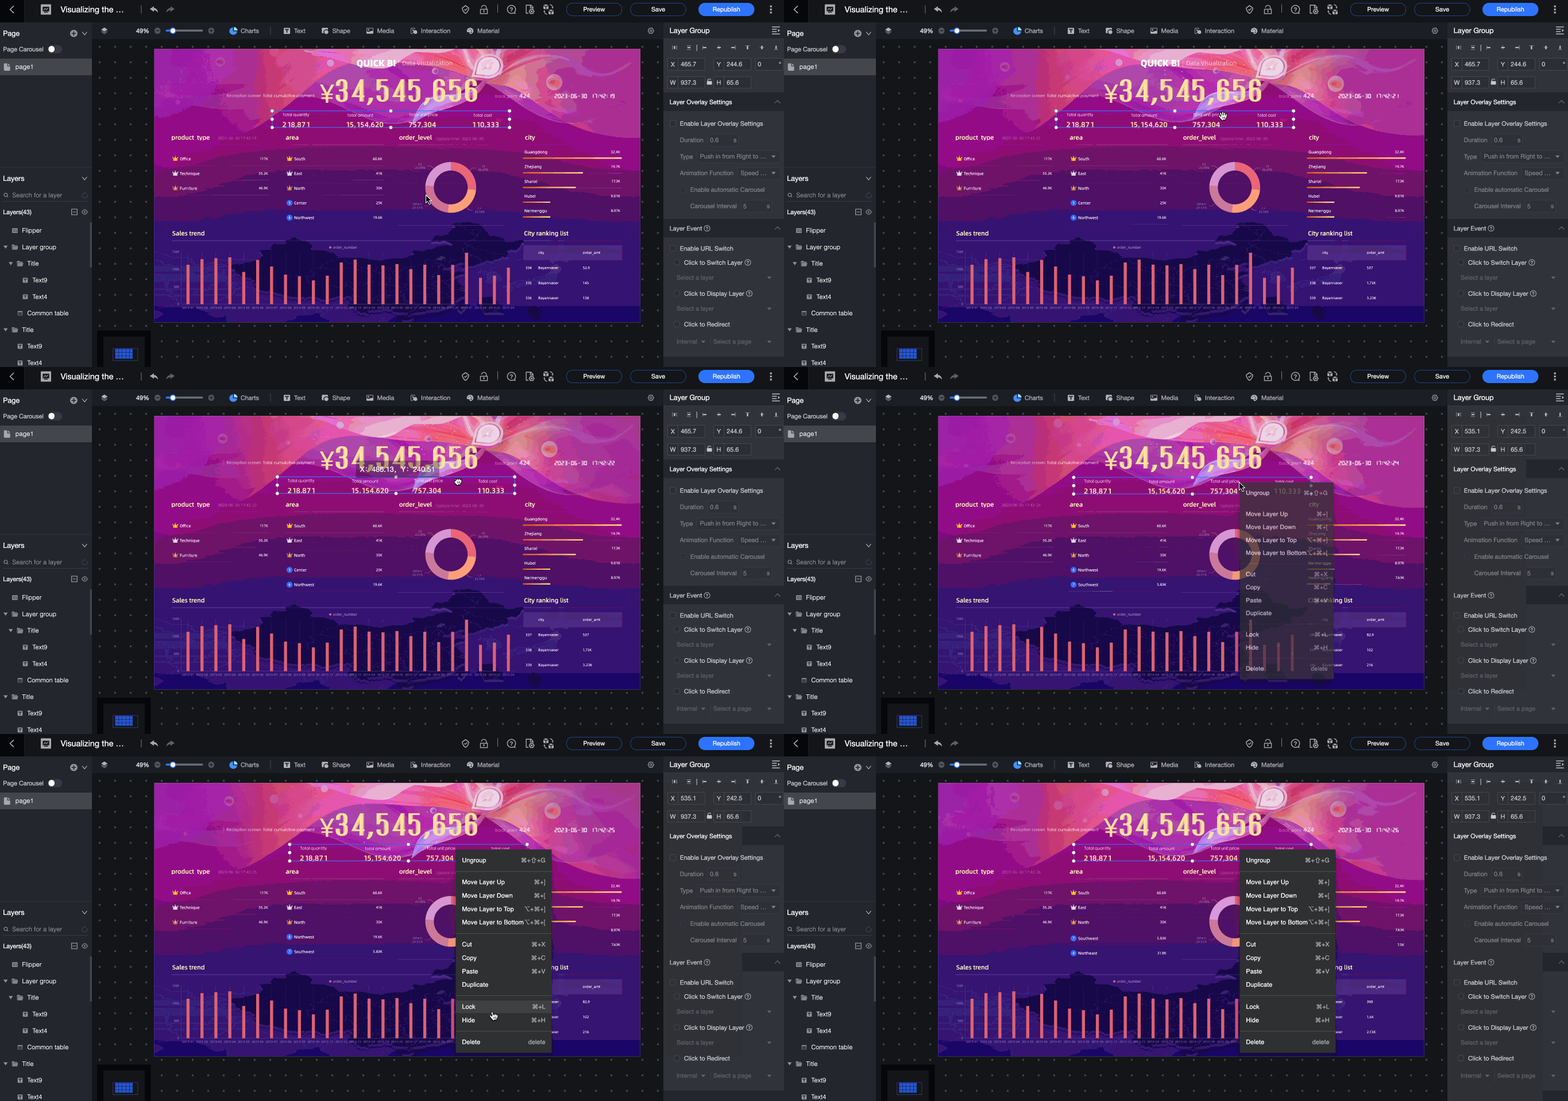
Widget configuration area
Add fields
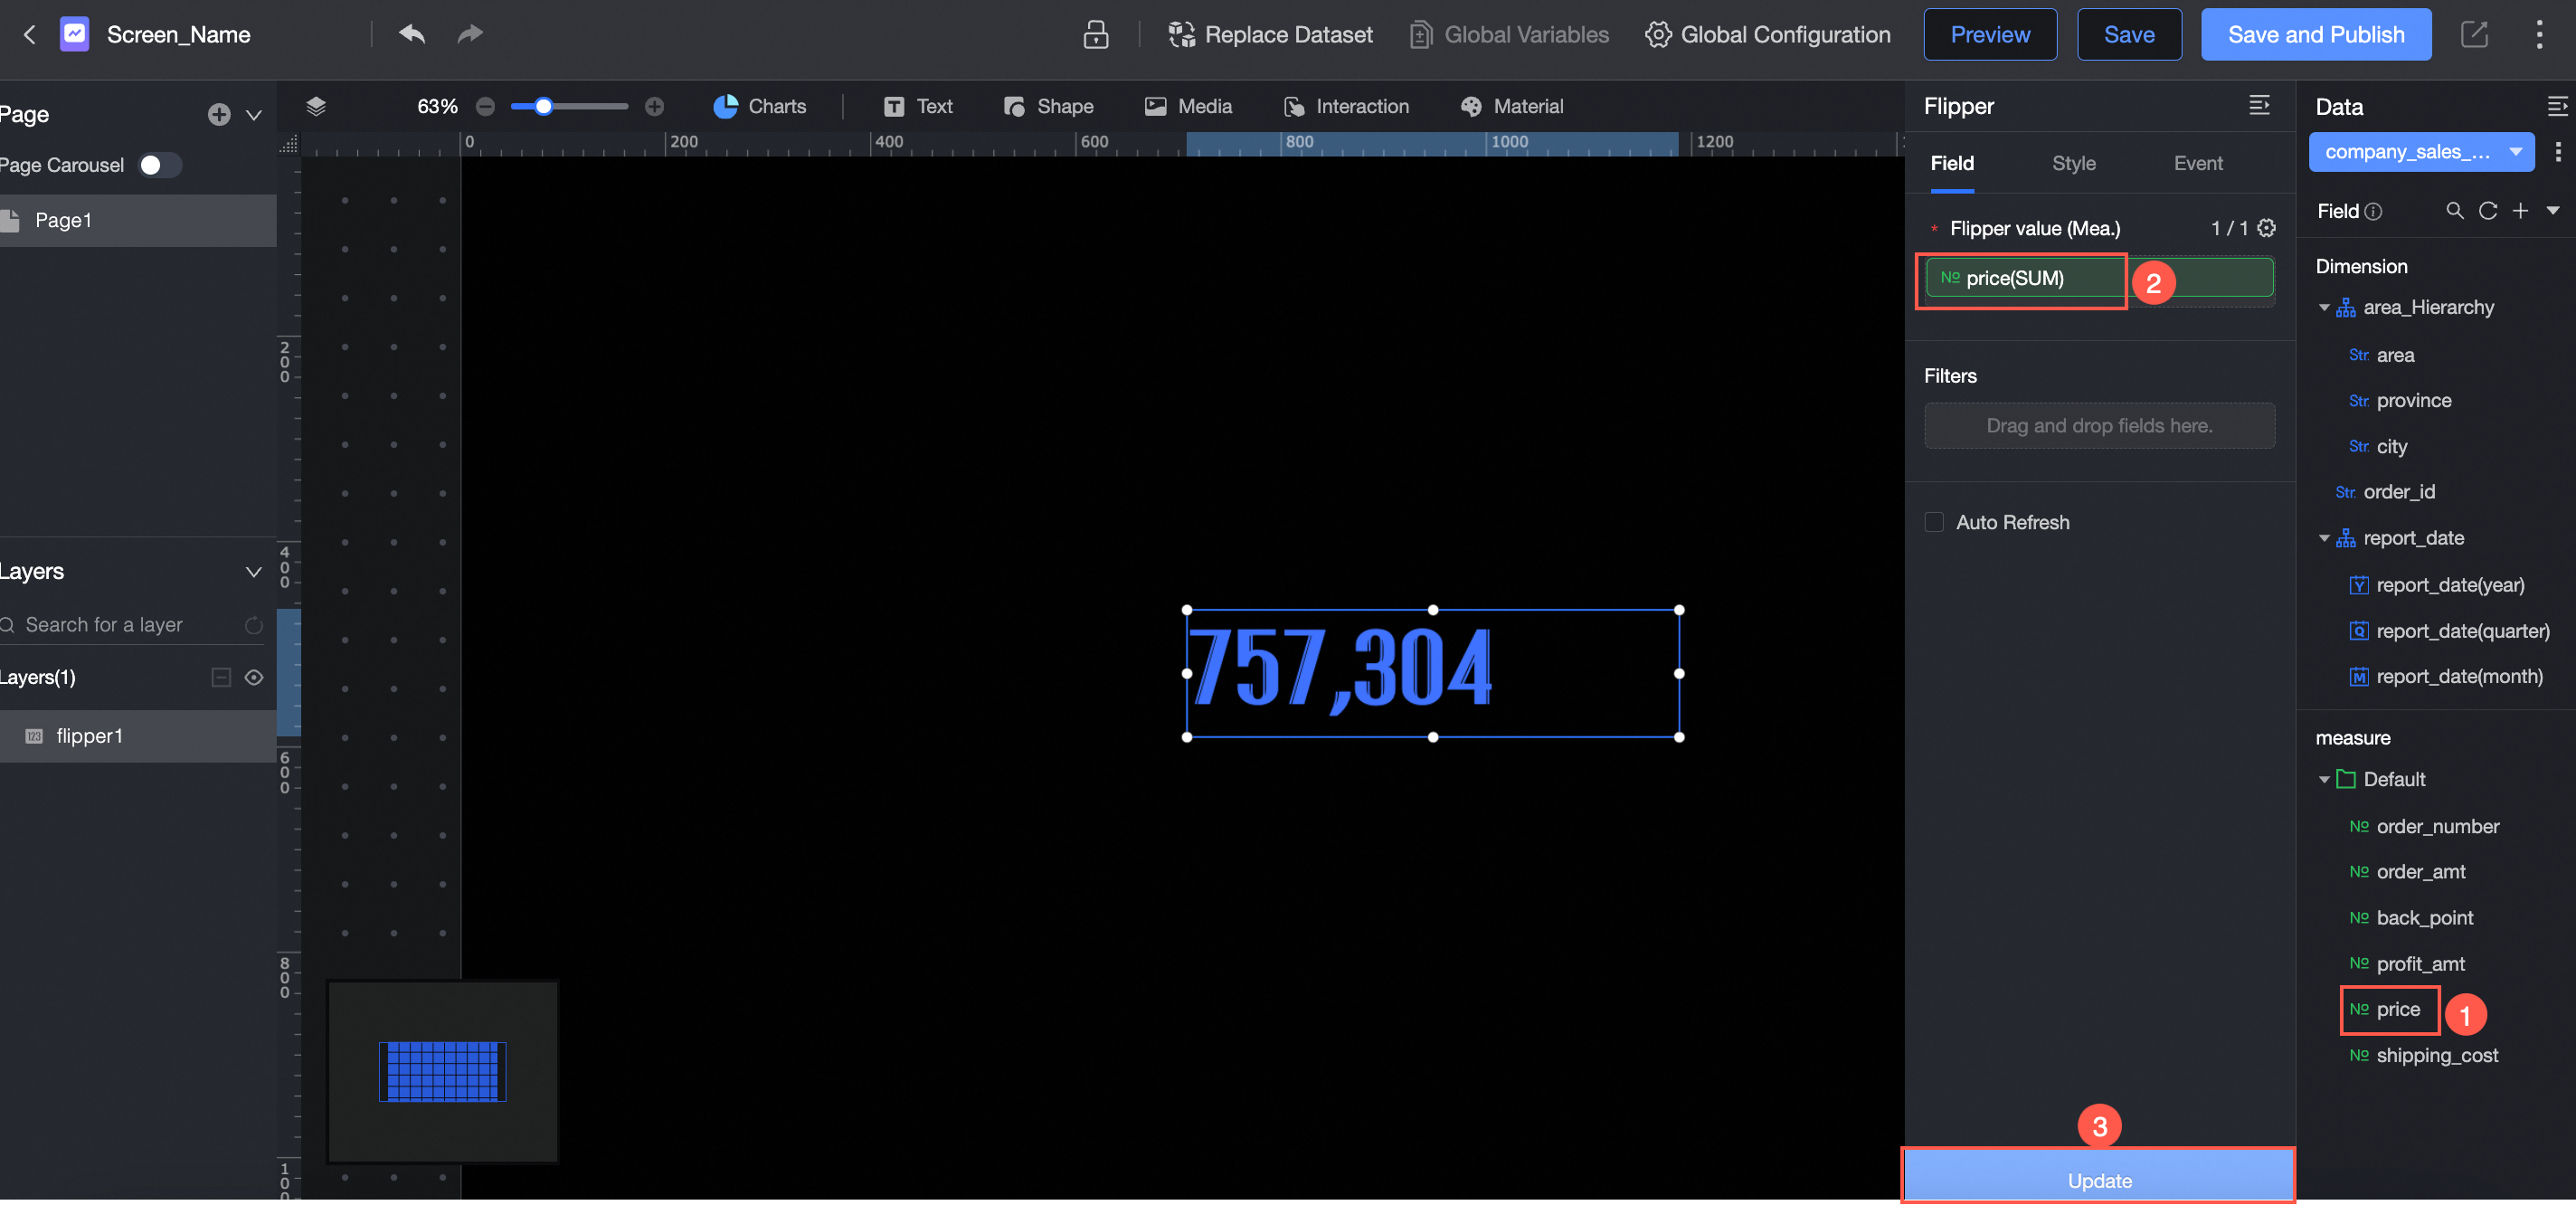
Use the ticker board as an example.
In the Charts section of the widget library, locate the Ticker board and drag it onto the canvas.
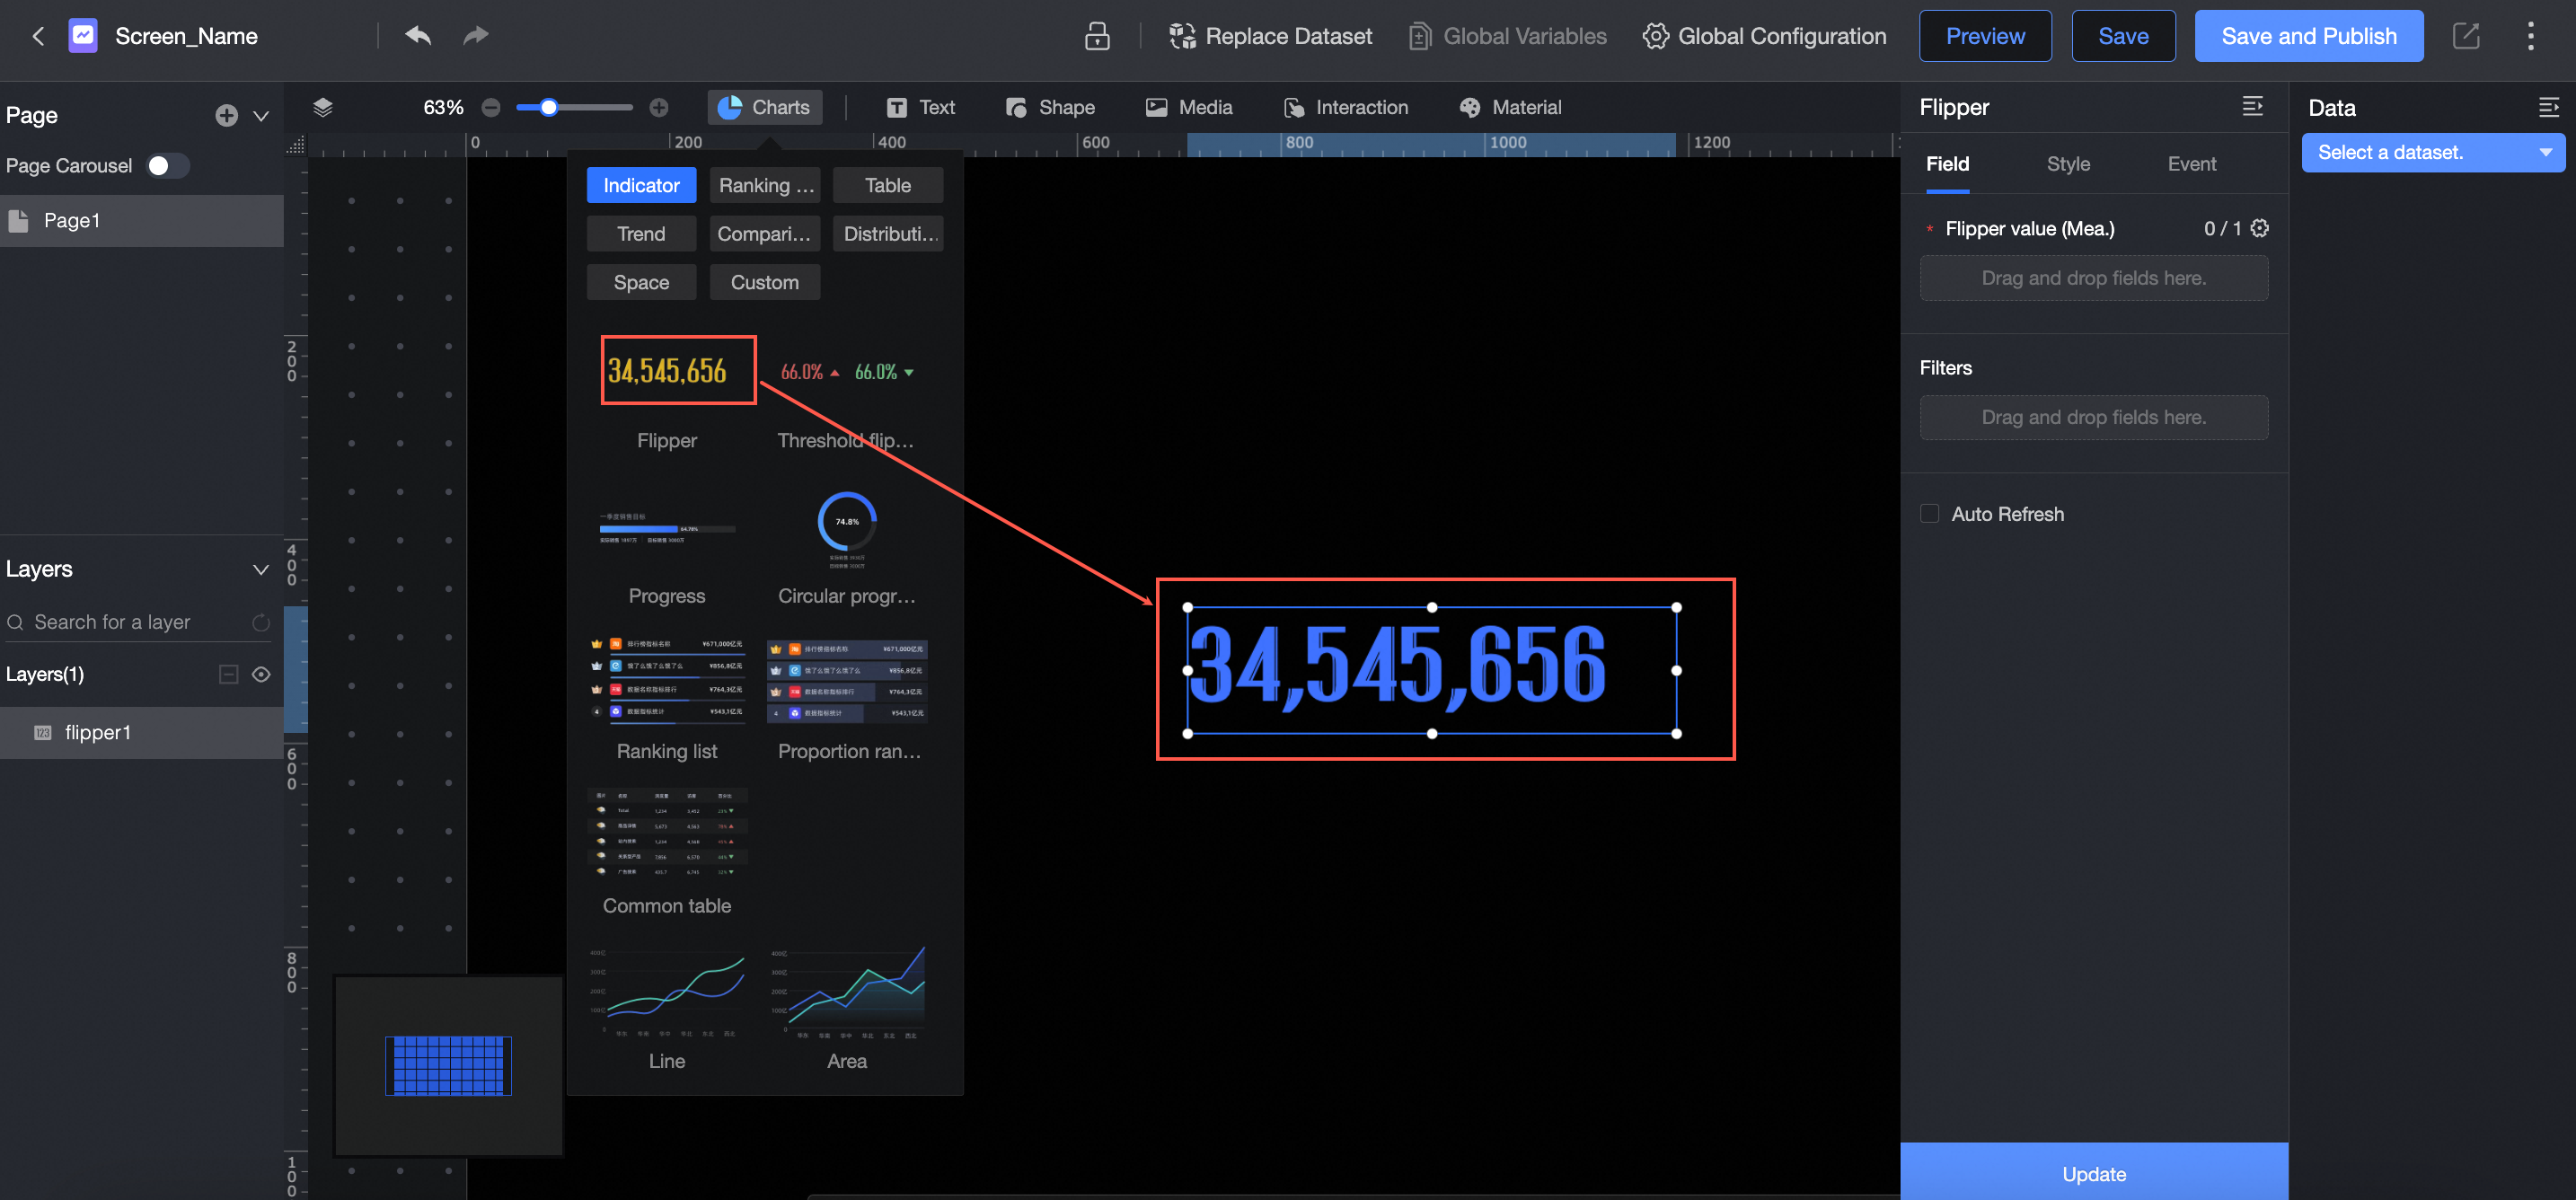
Click Select dataset and follow the instructions in the figure to add data.
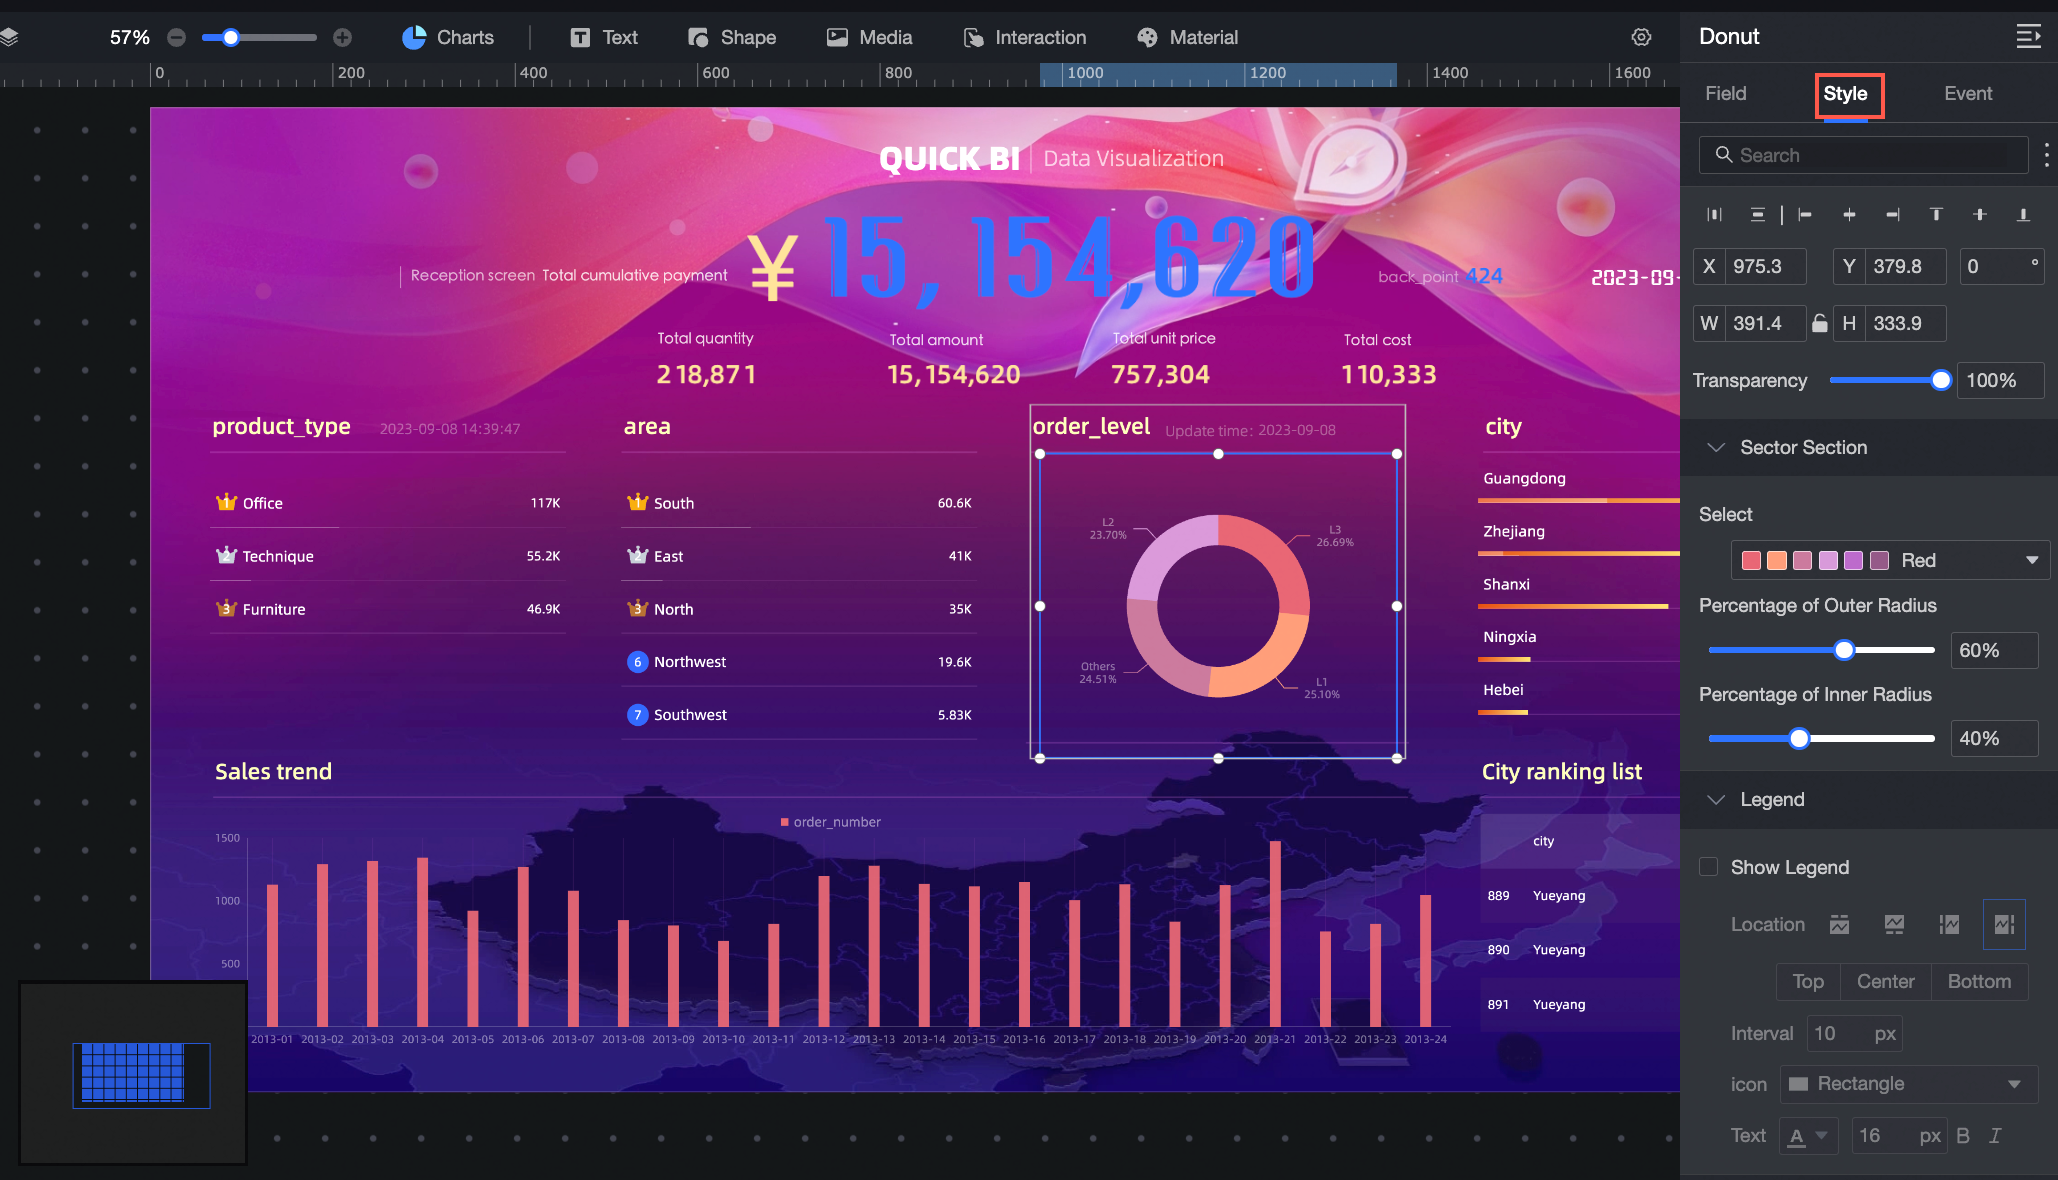
Configure style
Fine-grained style properties: Configure styles for individual chart elements, such as color, font, position, alignment, width, height, and transparency.
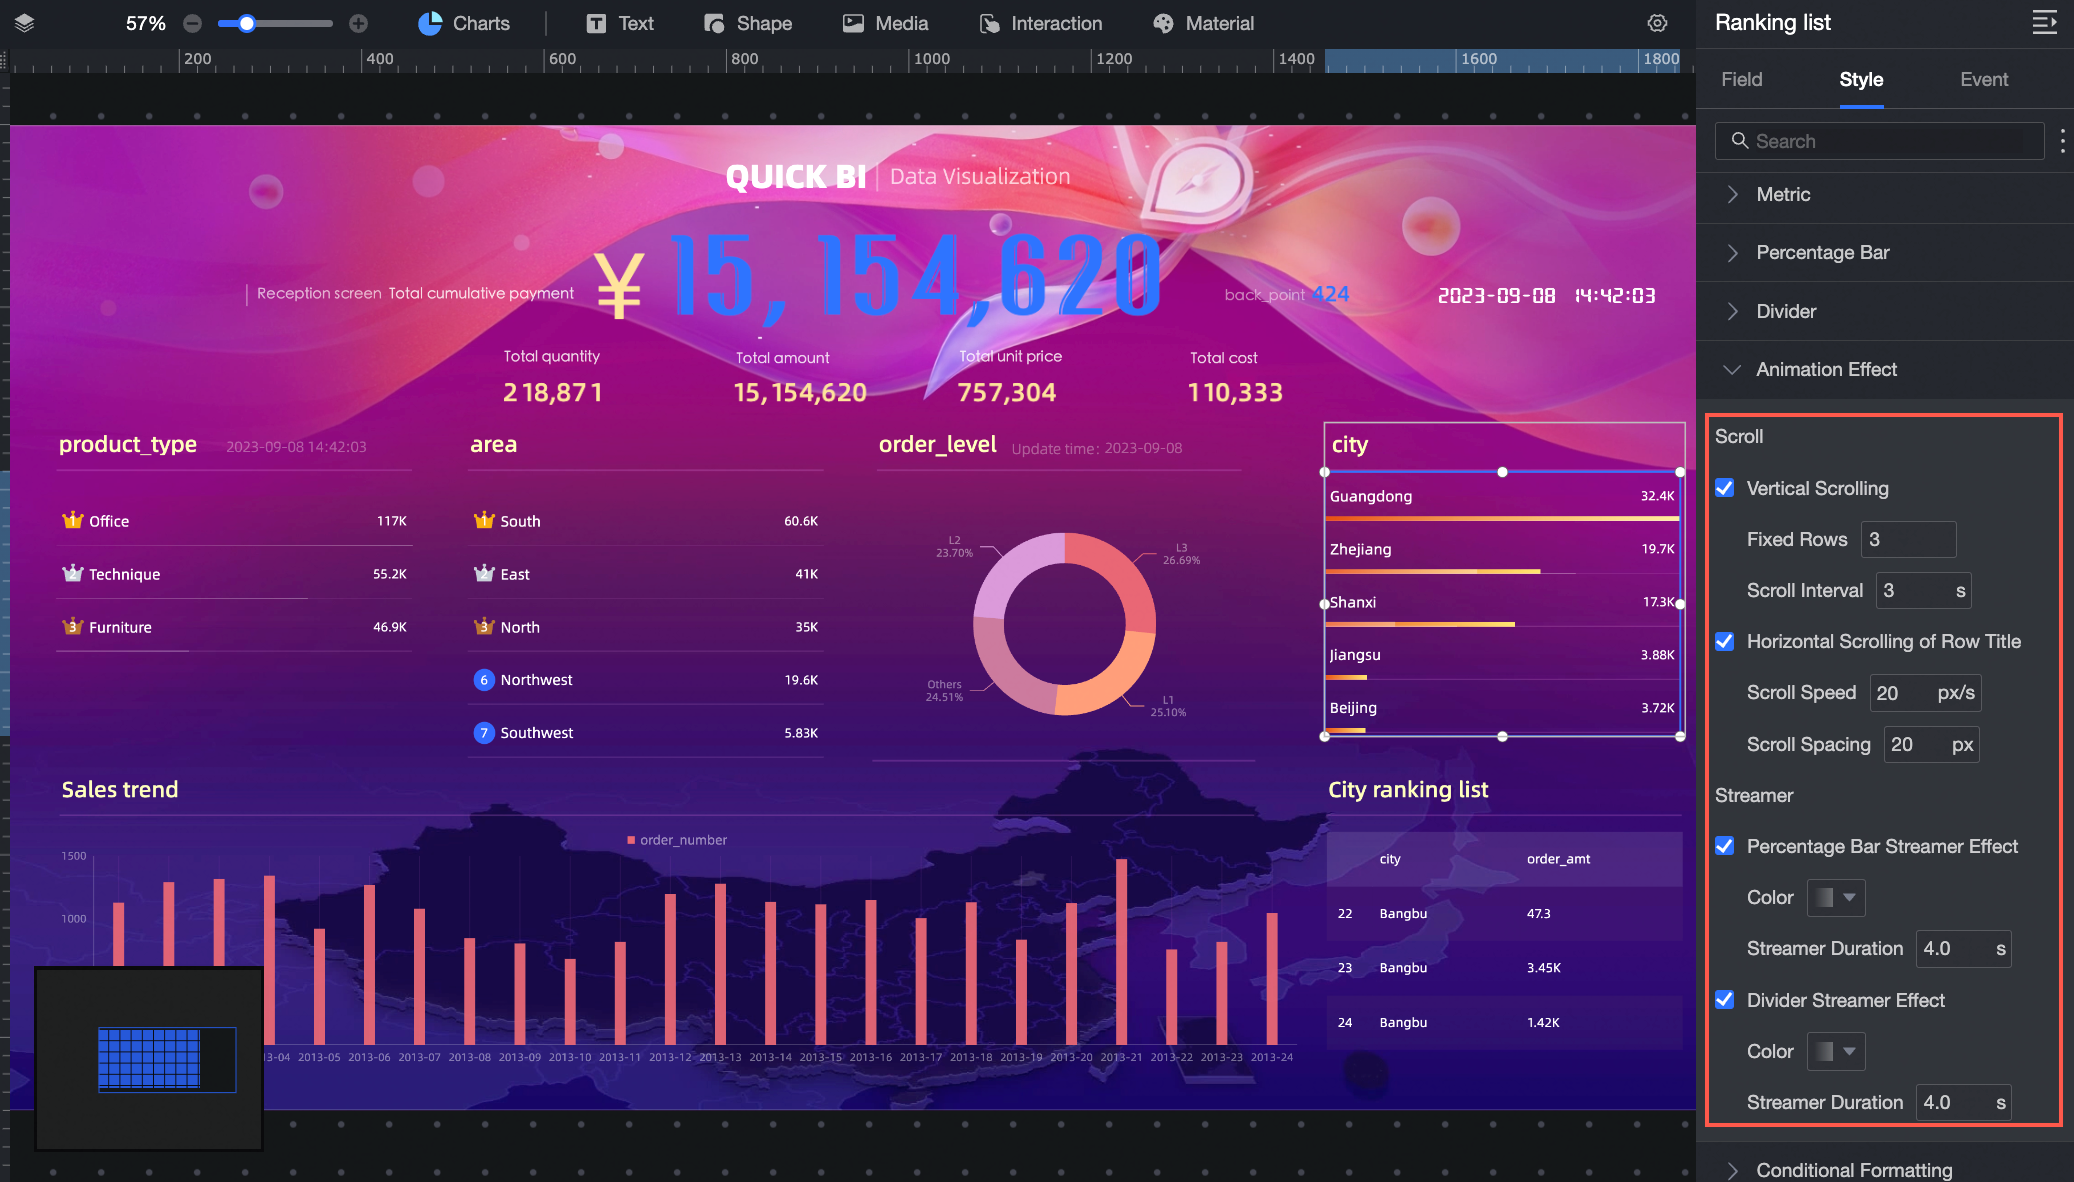
Rich animation effects: You can add effects such as light flow, page flip, and scroll.
For details, see Configure Chart Style.
Data transformation area
Select datasets, add data, modify data formats, or transform data.
① Set field formats in batch
② Filter fields
③ Auto-filter data
④ Switch datasets
⑤ Preview or edit datasets
⑥ Transform data (create calculated fields or grouped dimensions)
⑦ Copy fields
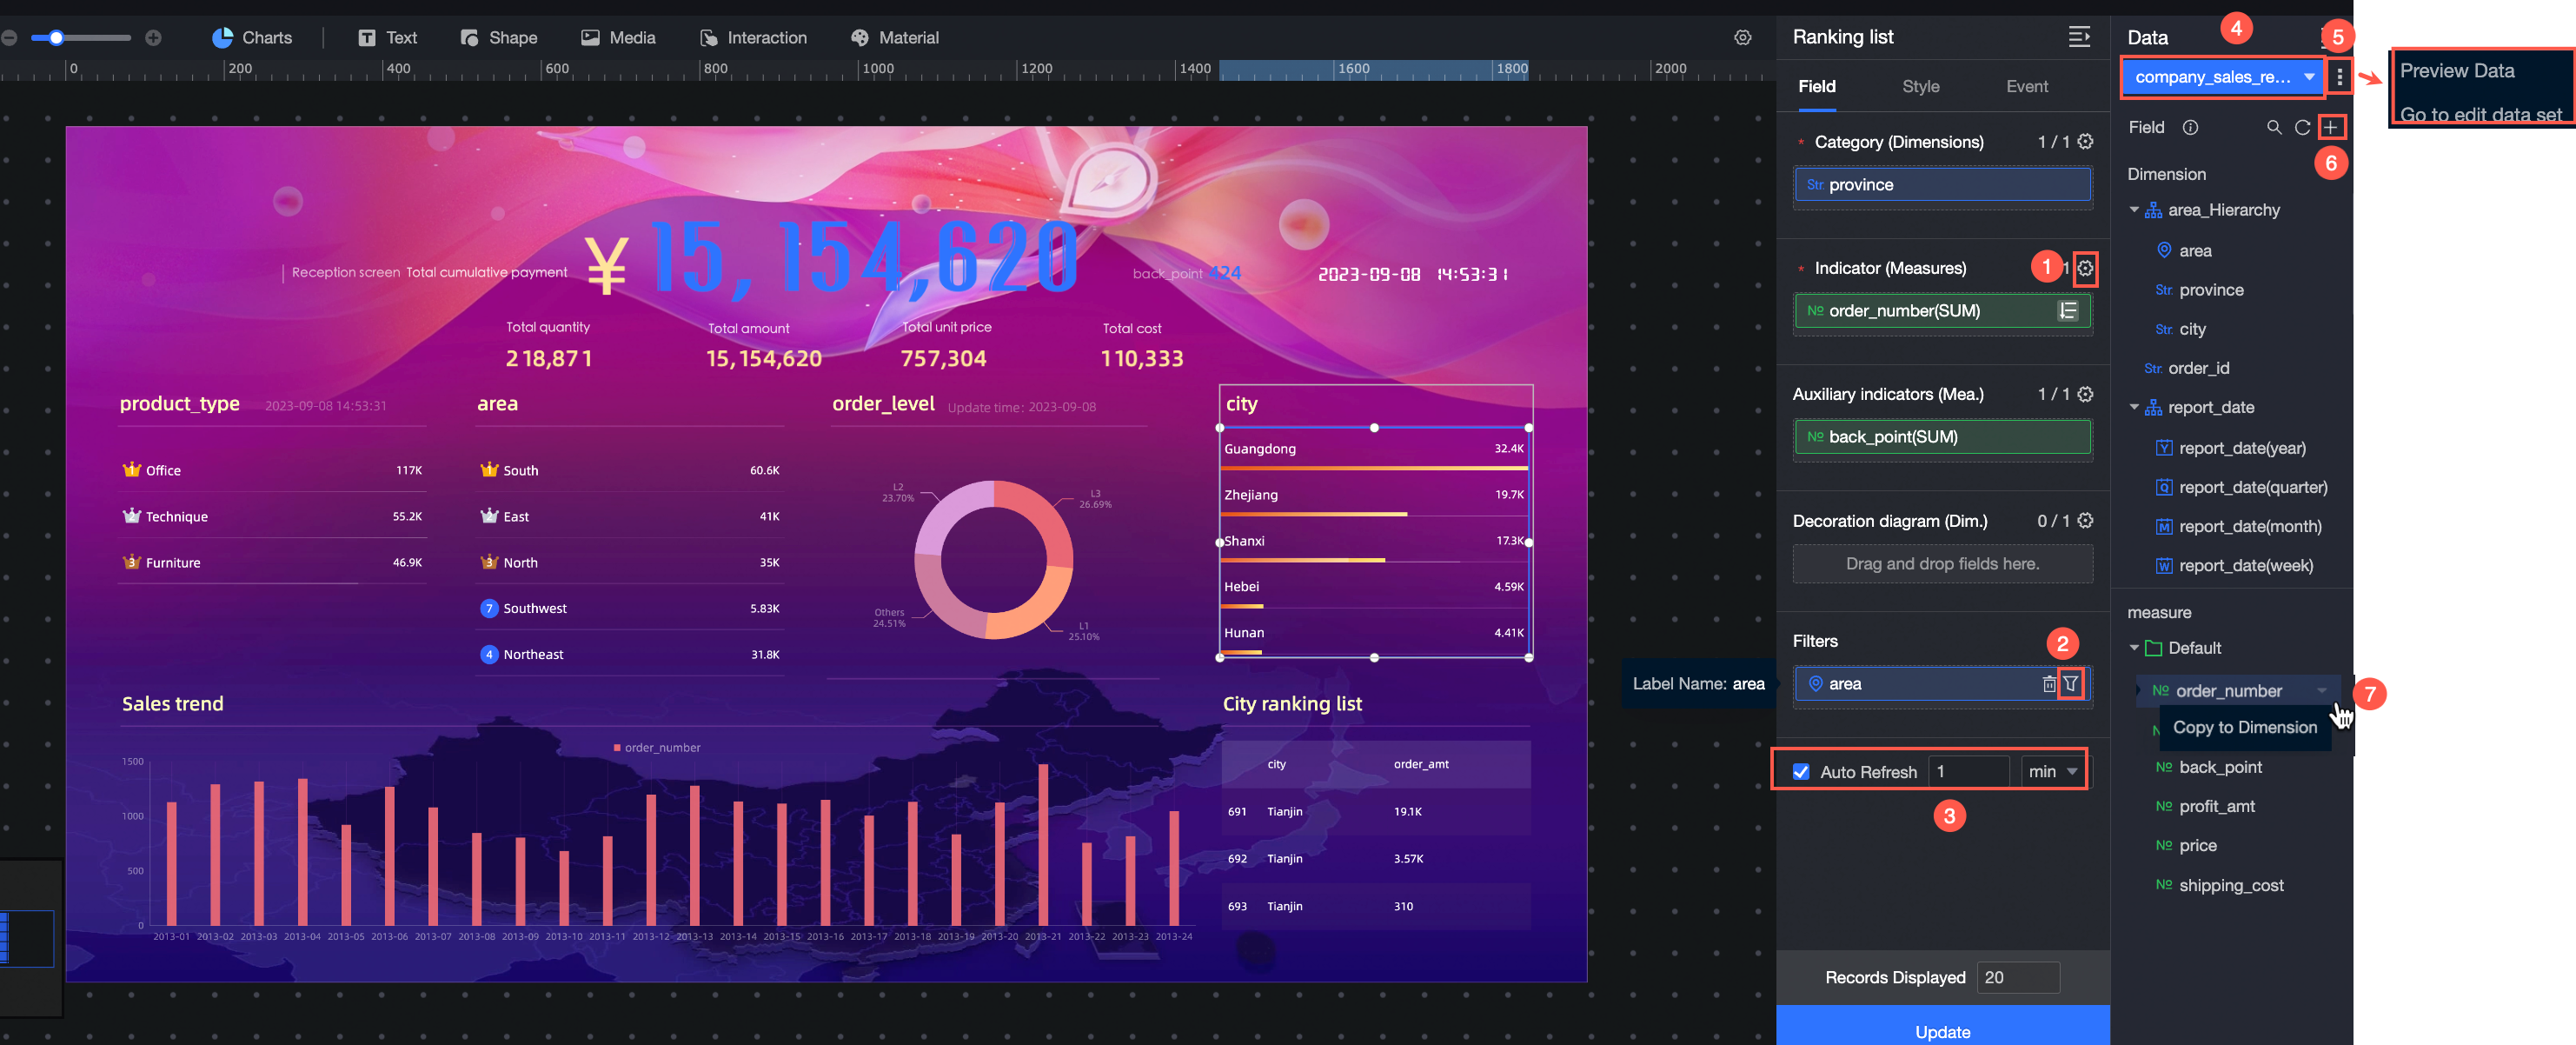 For more actions, see Configure Chart Data.