A multi-layer map combines multiple map layers to show the distribution of complex geographic data. This topic describes how to add data and configure styles for a multi-layer map.
Prerequisites
You have created a data visualization screen. For more information, see Create a data visualization screen.
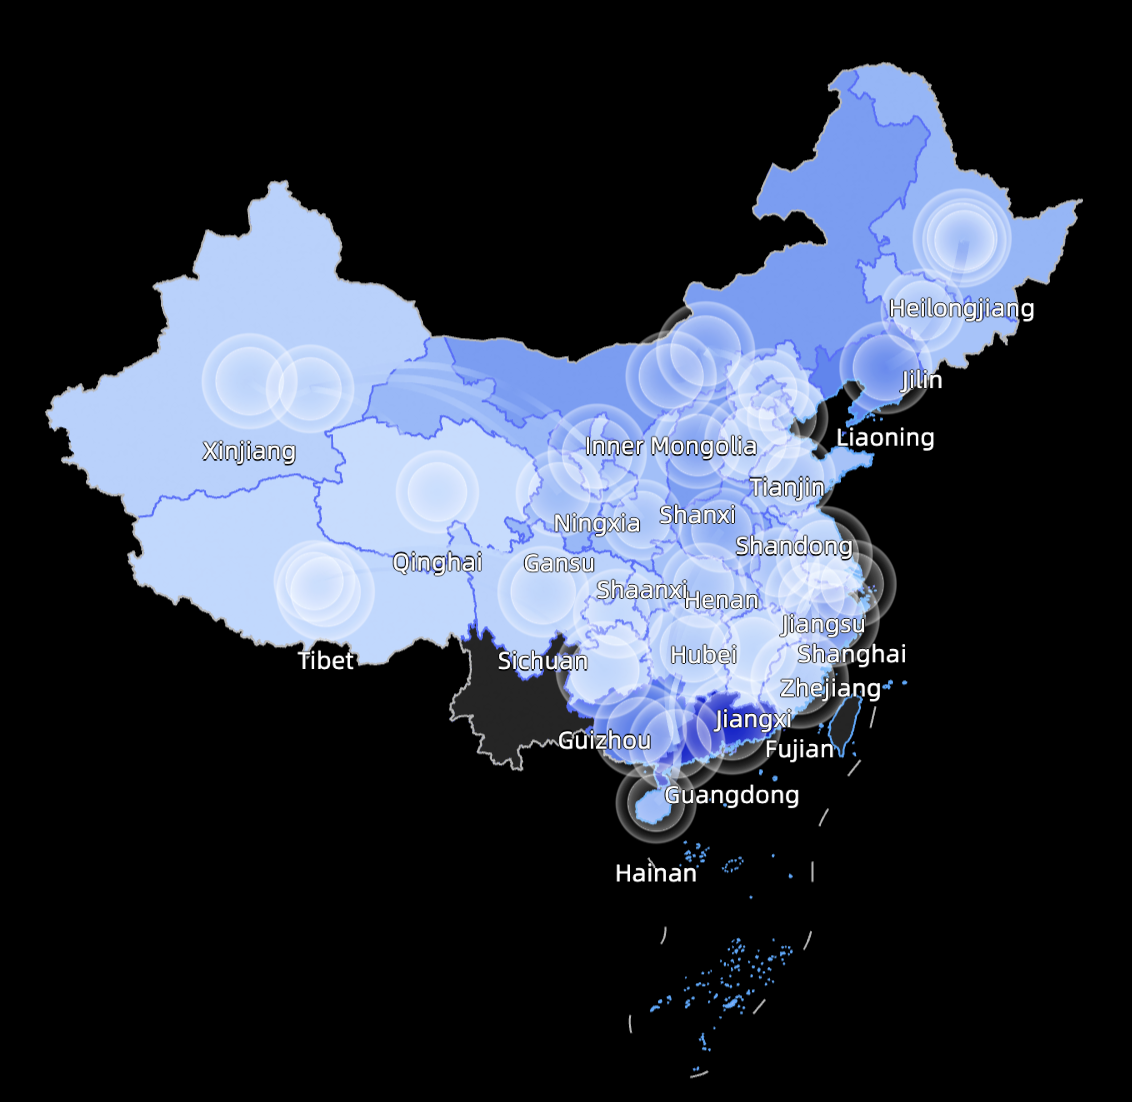
Preview
Configure chart fields
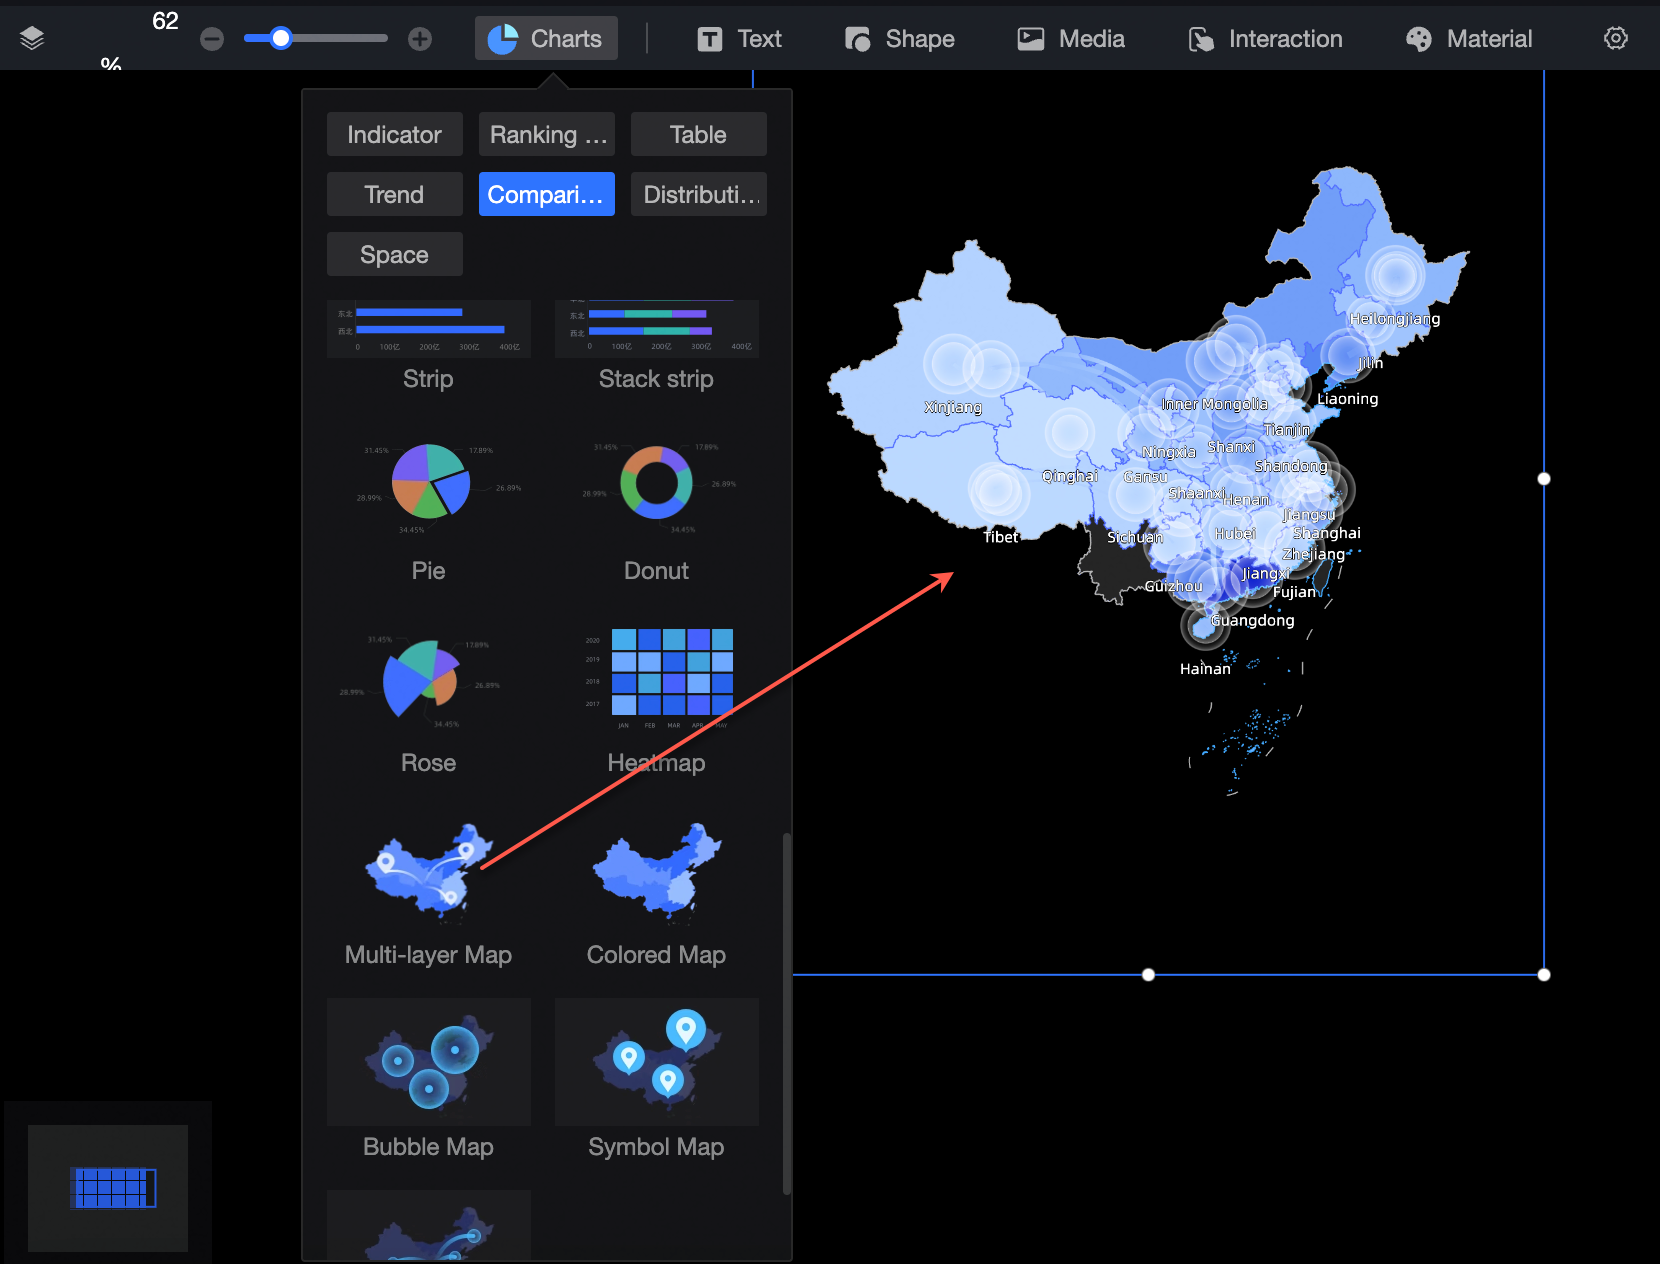
In the Charts area of the widget library, find the Multi-layer Map widget and drag it to the canvas.
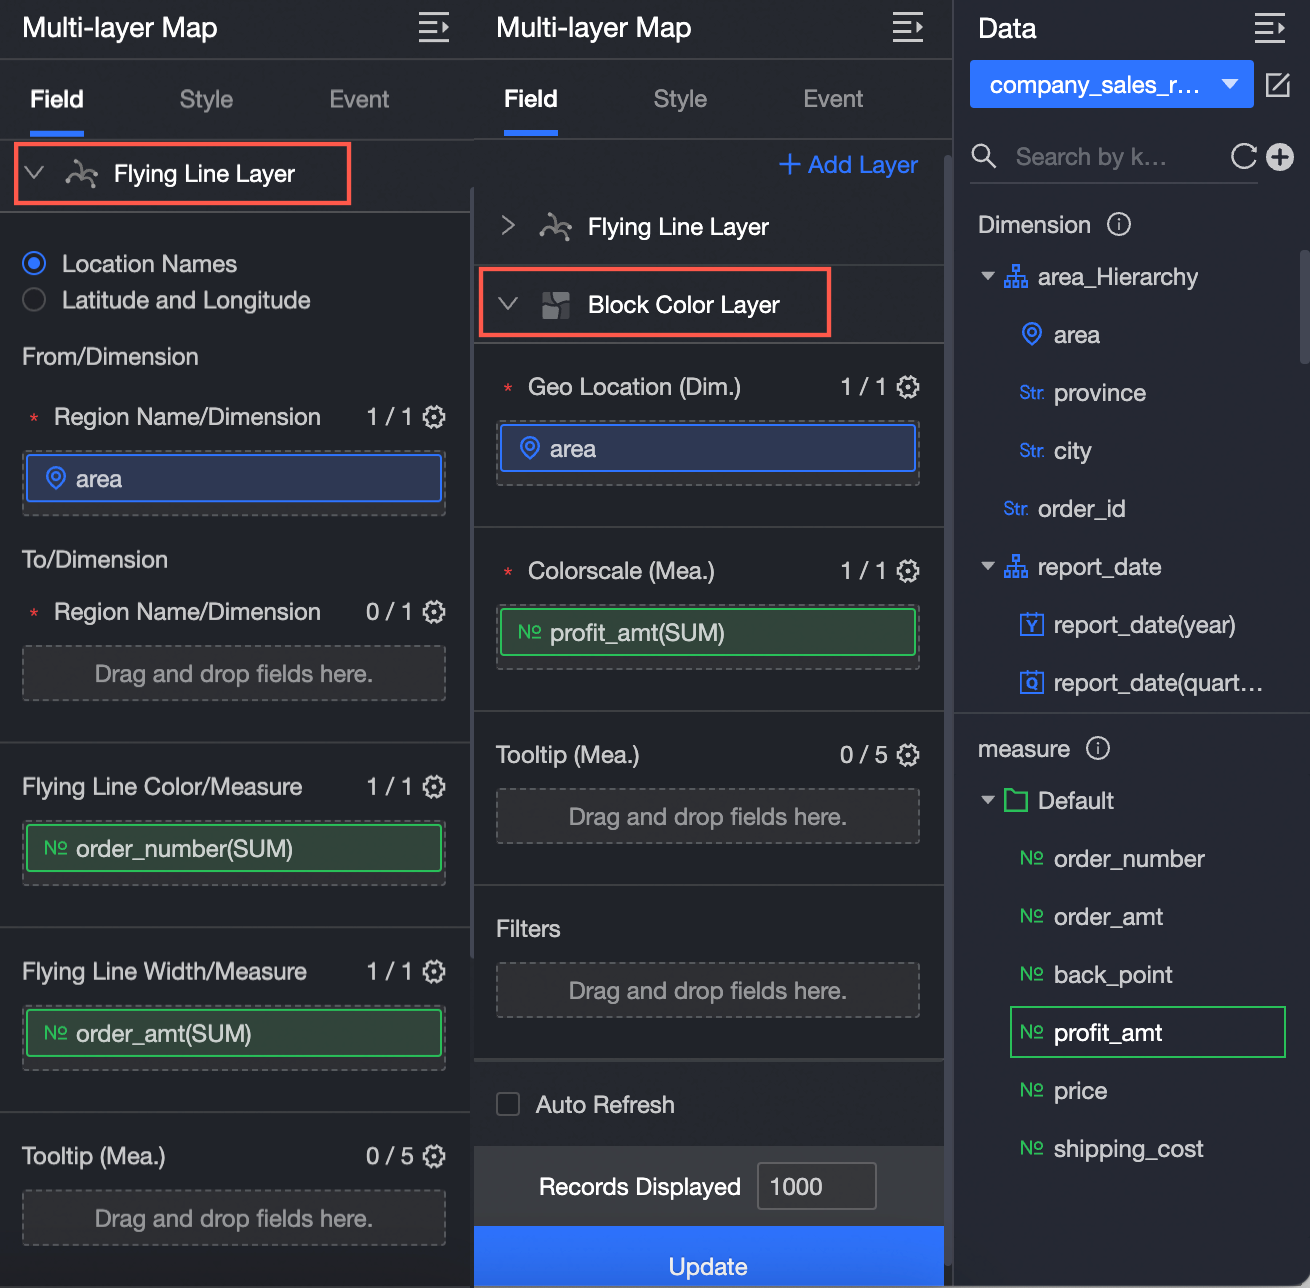
By default, a color layer and a flying routes layer are created. On the Fields tab, click Add Layer in the upper-right corner to add more map layers.
NoteA map can have a minimum of 1 and a maximum of 5 layers.
A map supports only one area color layer.
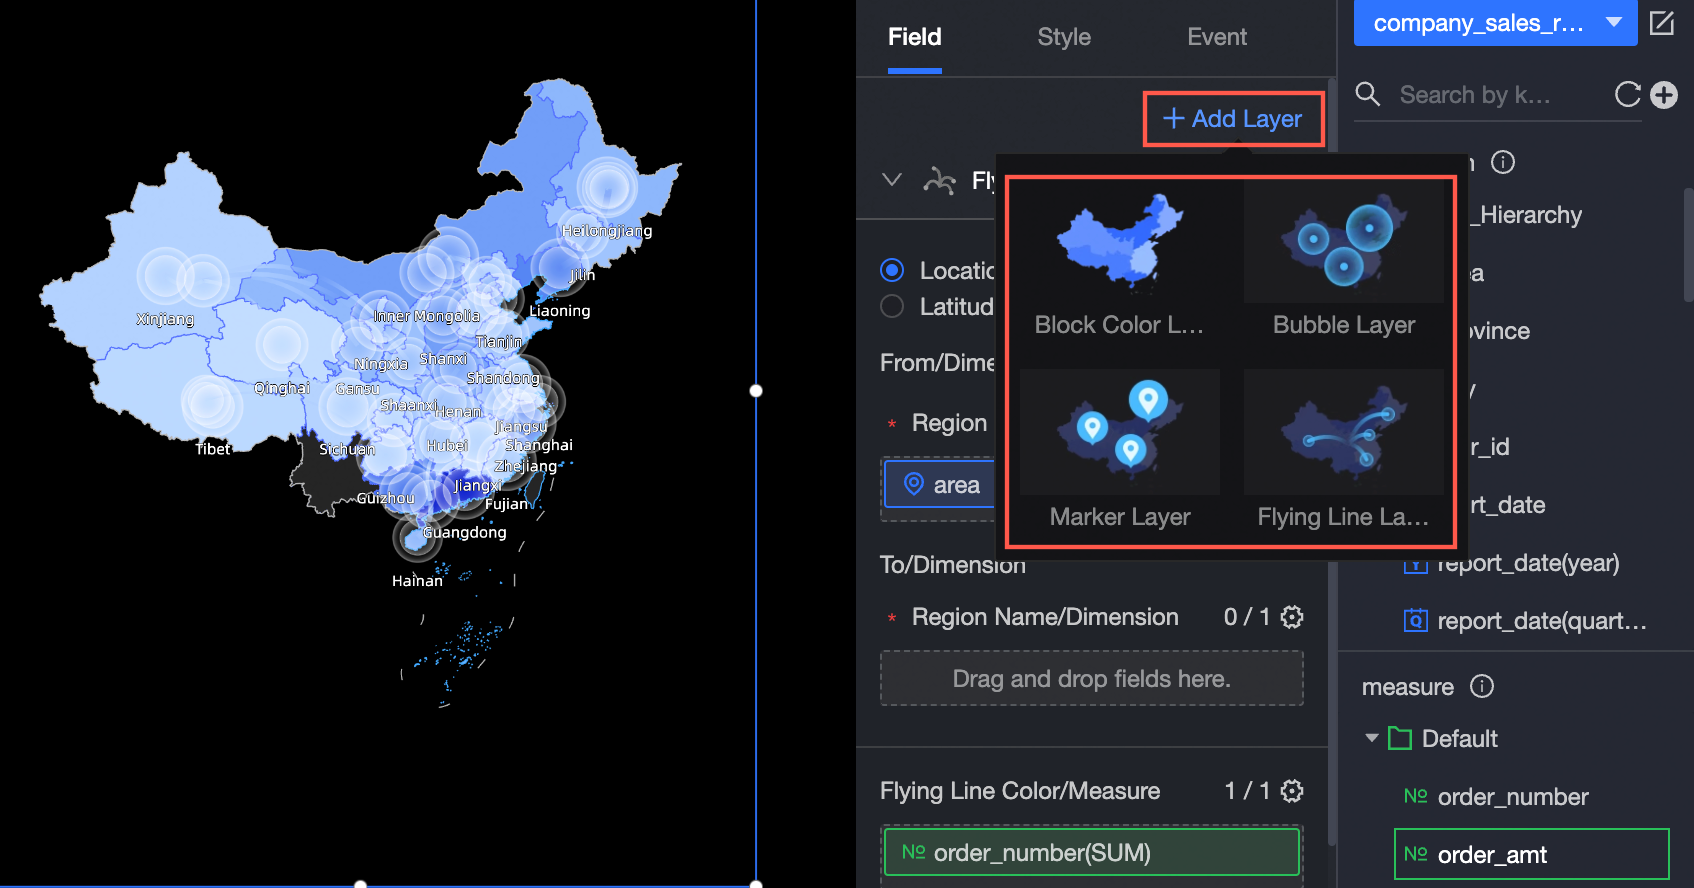
After adding the layers, configure the fields for each layer by selecting the required dimension and measure fields. For example, you can configure the default color and flying routes layers as follows:
For more information about configuring the fields for a flying routes layer, see Flying Routes Map.
For more information about configuring the fields for an area color layer, see Colored Map.
For more information about configuring the fields for a bubble layer, see Bubble Map.
For more information about configuring the fields for a symbol layer, see Symbol Map.
You can also perform the following data operations:
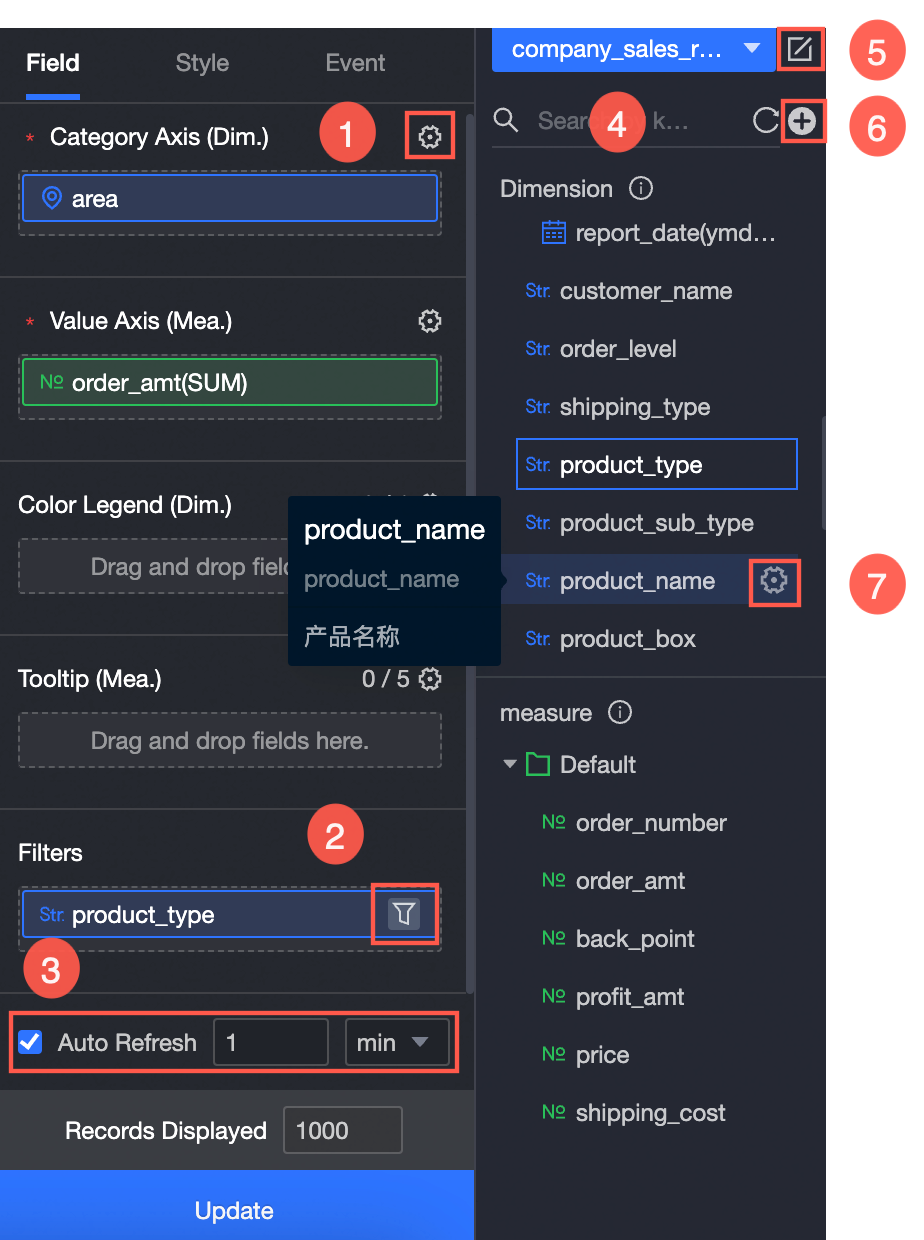
Configure field formats in batches (①). For more information, see Batch configure field styles.
Set filters for fields (②). For more information, see Filter data.
Enable auto-refresh for the data (③). For more information, see Refresh data on a schedule.
Switch datasets (④). For more information, see Switch datasets.
Edit a dataset (⑤). For more information, see Edit a dataset.
Process data by creating a calculated field or a new grouped dimension (⑥). For more information, see Create a calculated field and Create a new grouped dimension.
Copy and transform a field (⑦). For more information, see Copy and transform a field.
Configure chart styles
The style settings include options for individual layers and general map settings.
Sublayer Area
In the configuration pane, you can configure the following settings for each layer:
Layer
Sub-layer configuration item
Description
Area color layer
Area style
Color Scale Configuration: Set Data Mapping Range. You can select Continuous Range, Equal Interval, or Custom Range.
Color Settings: Select a color style for the area blocks.
Transparency: You can drag to resize.
Data labels
Show Data Labels: Select whether to show data labels and the content to display.
Label Display Mode: You can select Smart Display or Show All. Smart Display is suitable for scenarios with many place names.
Text Style: Configure the text style for the Area Name, Longitude and Latitude, and Measure data labels.
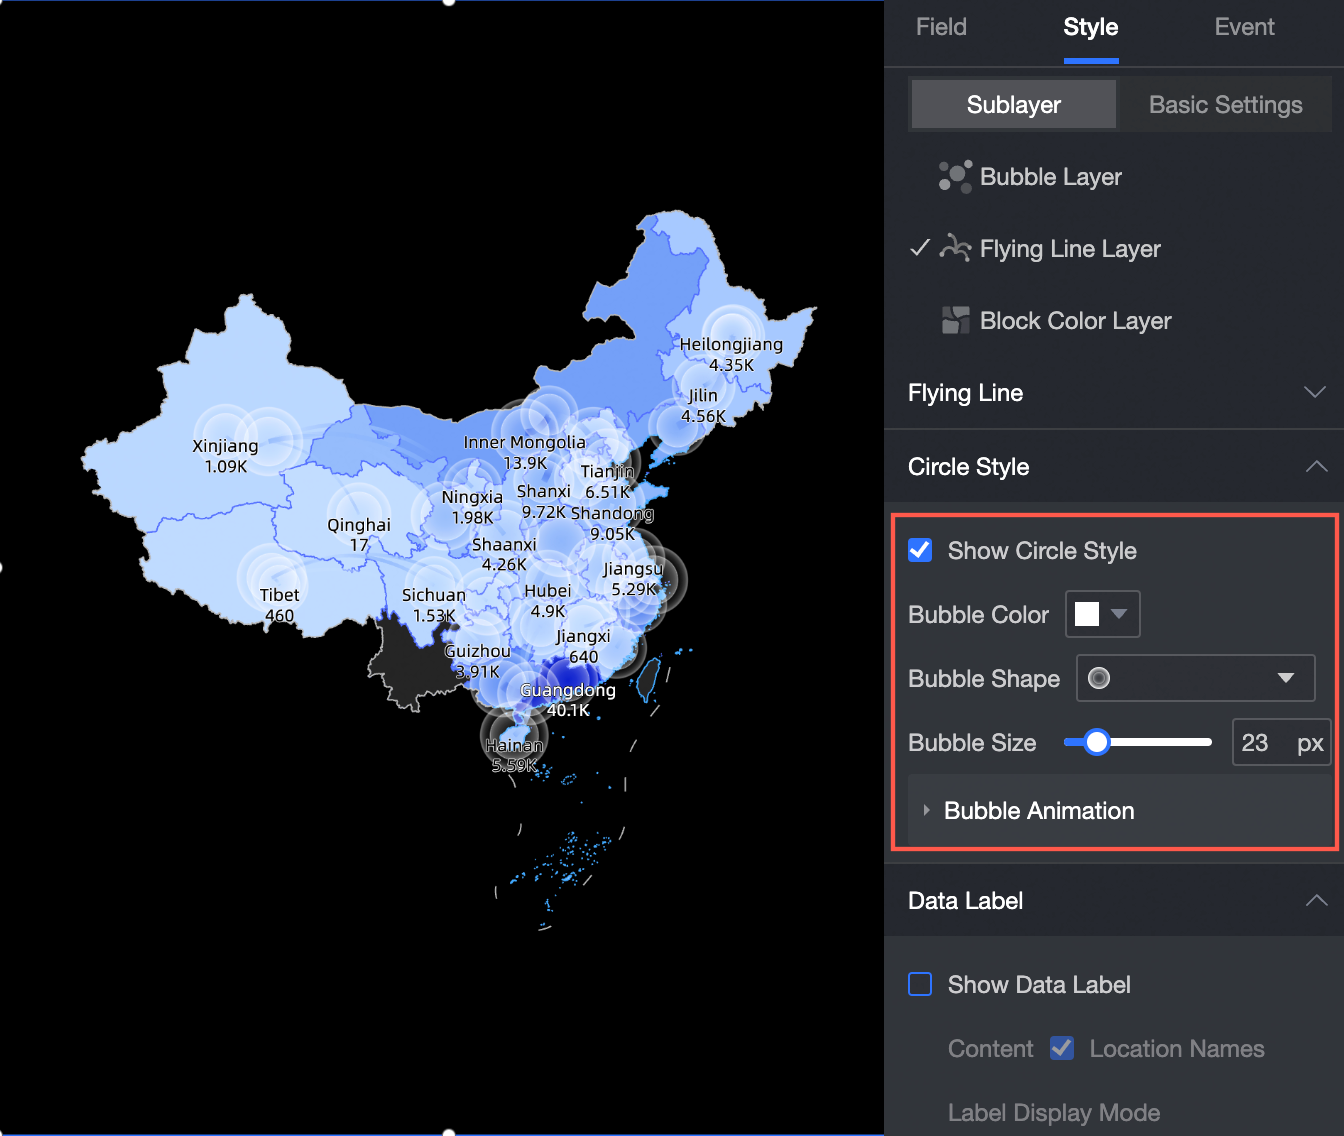
Bubble layer
Bubbles
Bubble Color: Configure Data Mapping Range, Color, Opacity, and Number of Ranges.
NoteYou can configure the Data Mapping Range for a measure, including the Mapping Method and Number of Ranges, only when Bubble Color/Measure is configured in the Fields pane.
Bubble Shape: Select a bubble shape.
Bubble Size: Drag the pointer to change the bubble size.
Bubble Animation: After you enable bubble animation, you can set Animation Type (Breathing/Wave), Animation Speed, Diffusion Range, and Number of Ripples.
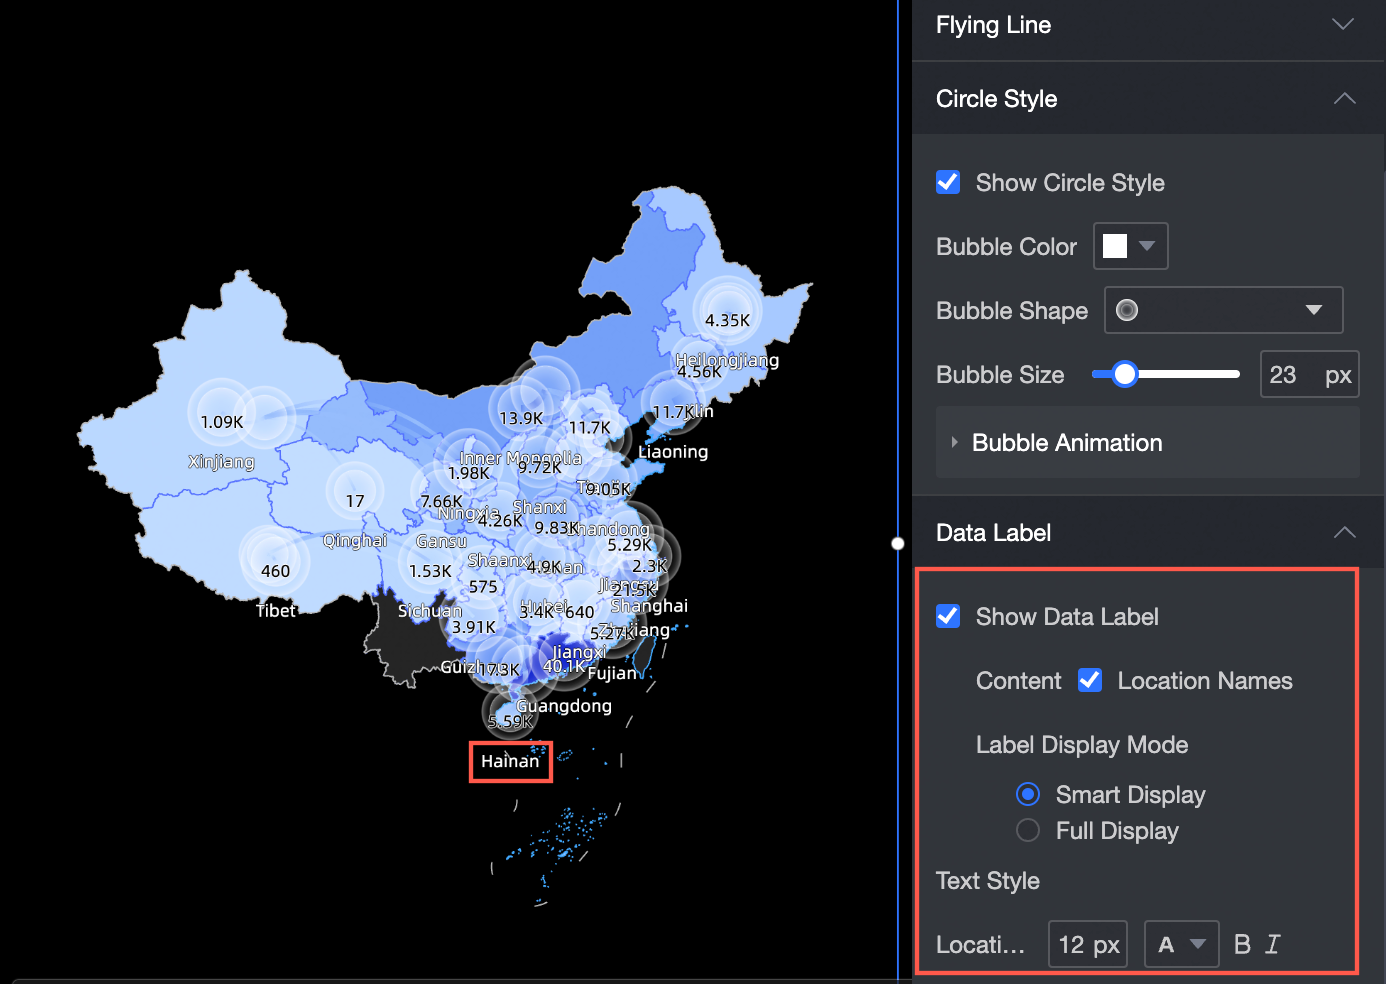
Data labels
Show Data Labels: Select whether to show data labels and the content to display.
Label Display Mode: You can select Smart Display or Show All. Smart Display is suitable for scenarios with many place names.
Text Style: Configure the text style for the Area Name, Longitude and Latitude, and Measure data labels.
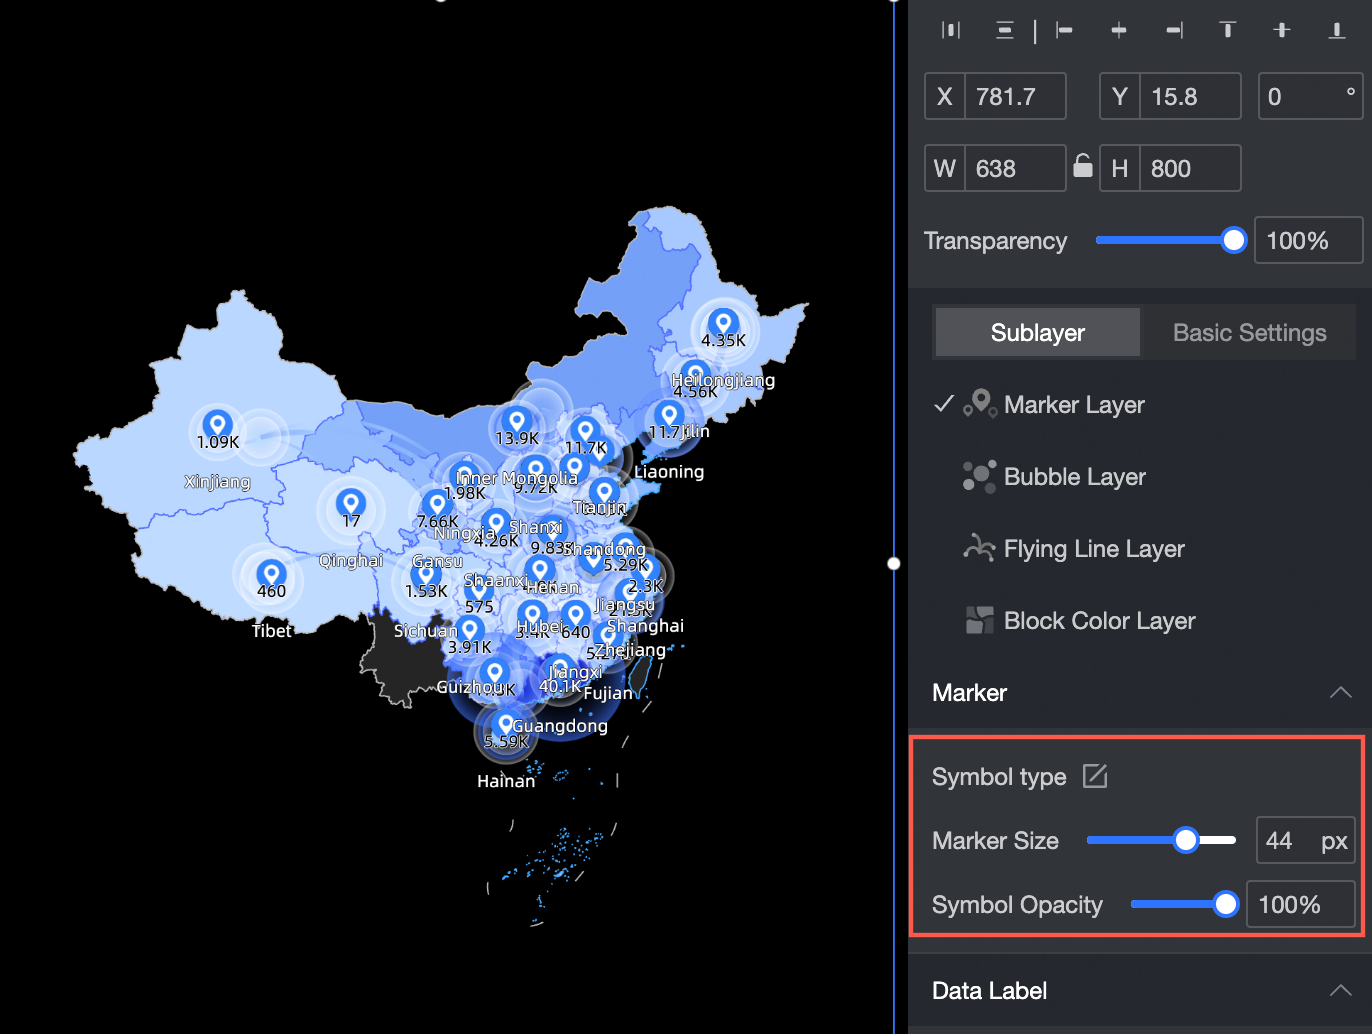
Symbol layer
Symbols
Symbol Type: Manually modify the symbol styles that are automatically generated based on dimensions.
Symbol Size: Drag the pointer to change the symbol size.
Symbol Opacity: Drag the pointer to adjust the opacity.
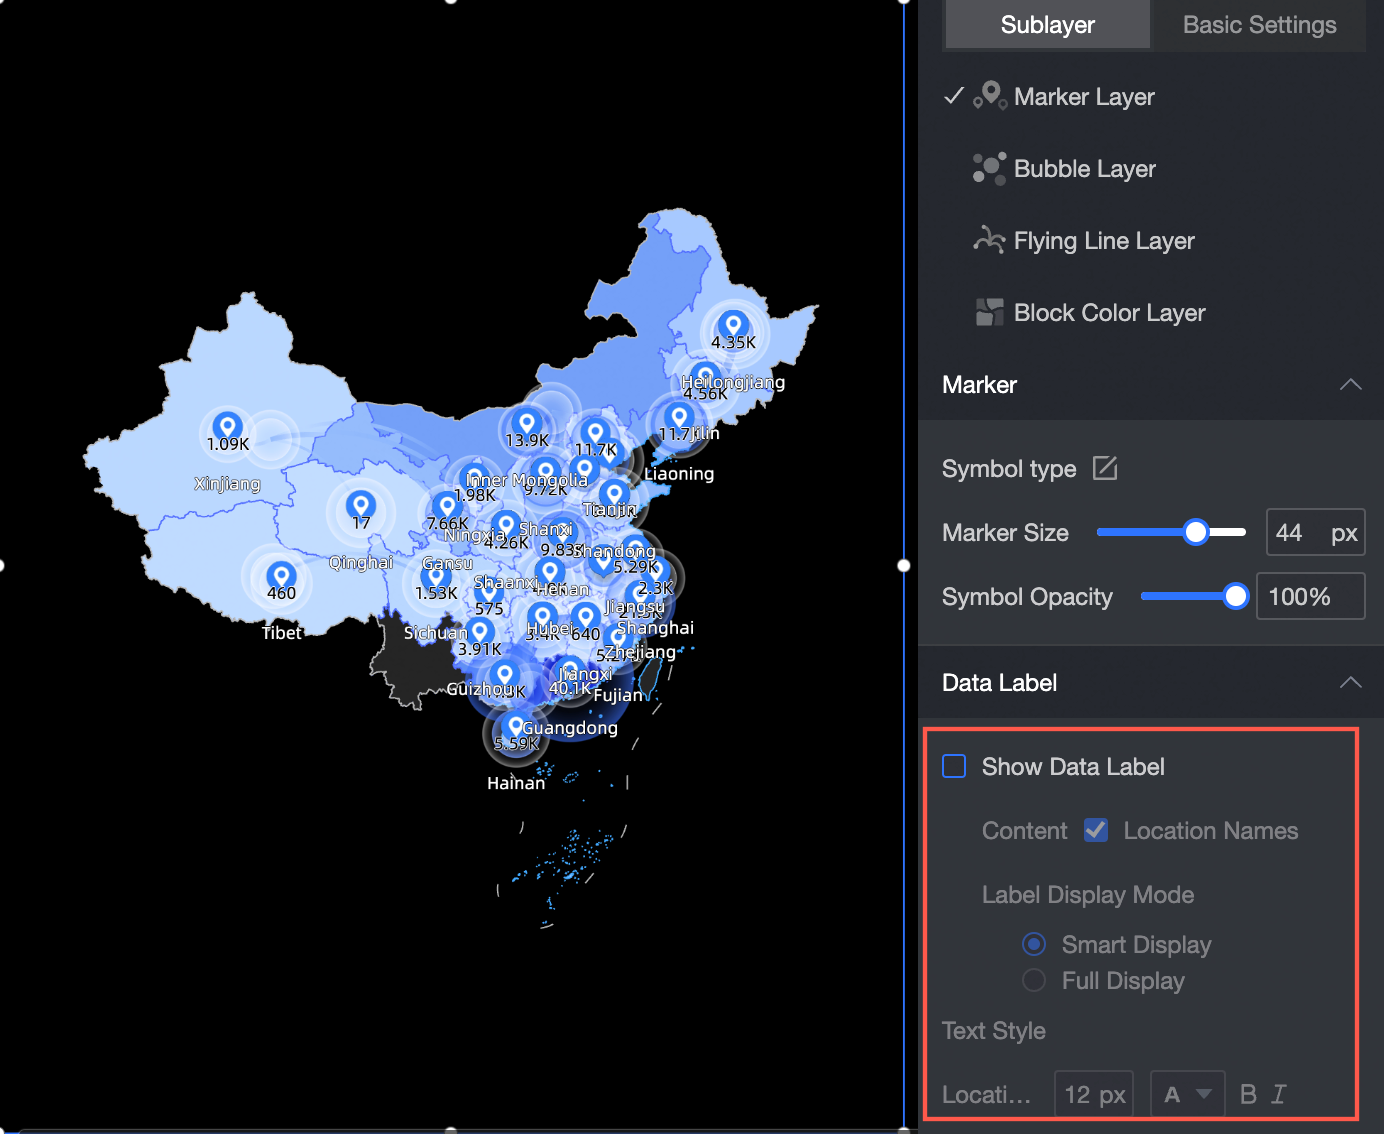
Data labels
Show Data Labels: Select whether to show data labels and the content to display.
Label Display Mode: You can select Smart Display or Show All. Smart Display is suitable for scenarios with many place names.
Text Style: Configure the text style for the Area Name, Longitude and Latitude, and Measure data labels.
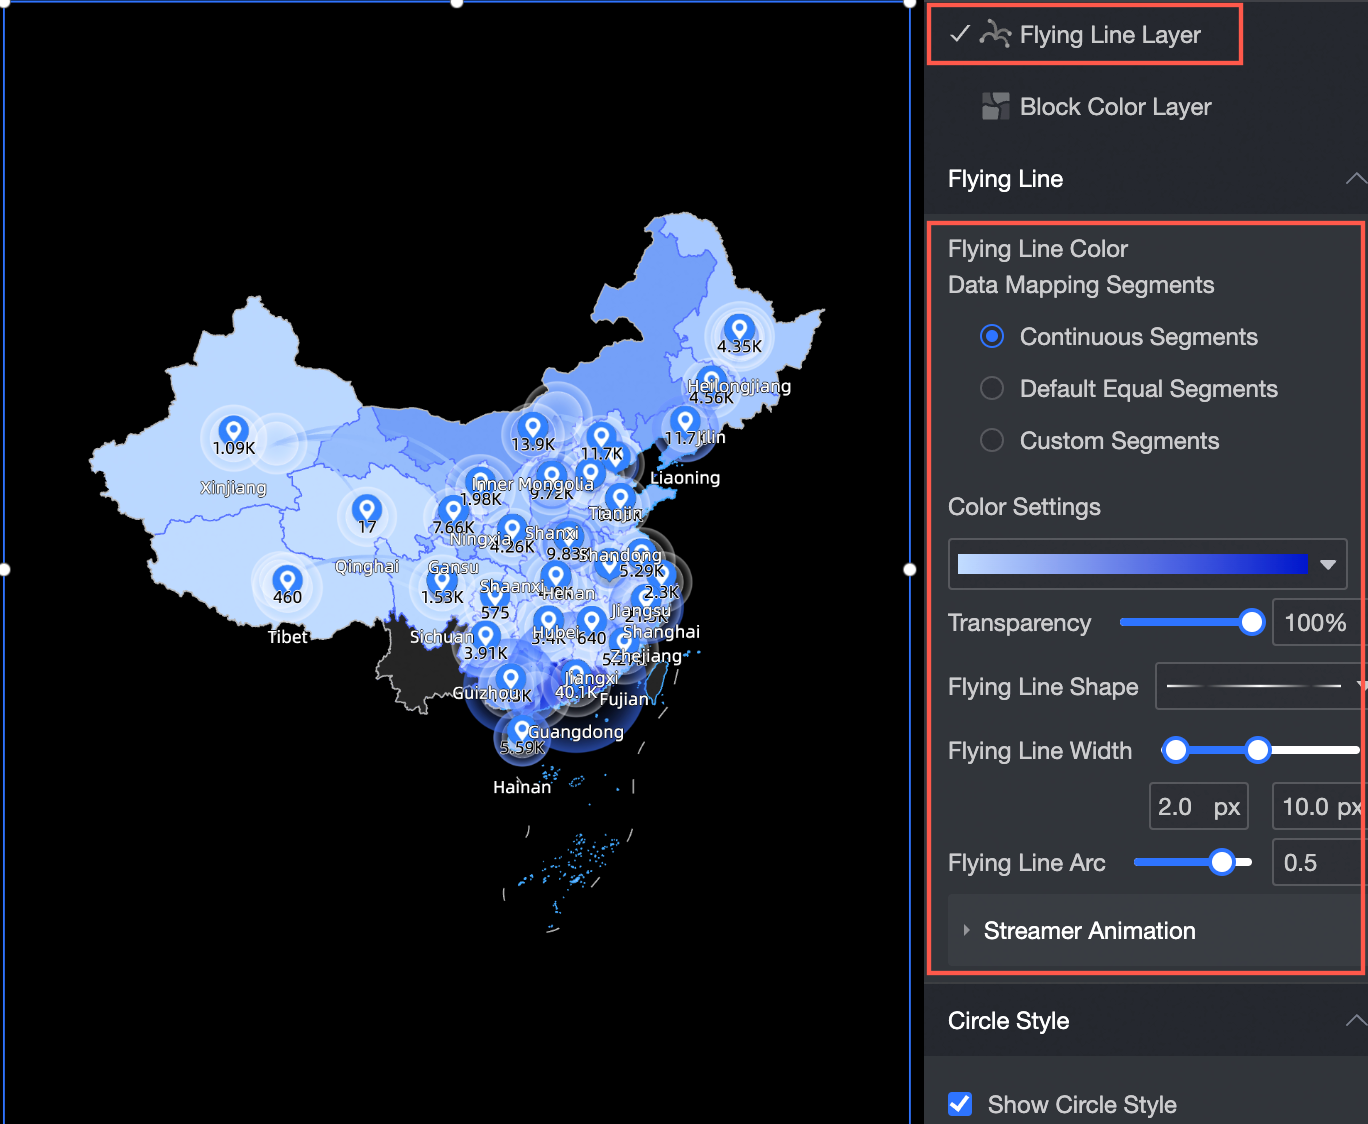
Flying routes layer
Flying routes
Route Color: Configure Data Mapping Range, Color, Opacity, and Number of Ranges.
Route Shape: Select a route shape.
Route Thickness: Set the route thickness.
Route Curvature: Set the route curvature.
Streaming Light Effect: Enable or disable the animation. If you enable it, you can set the animation Duration and Interval.
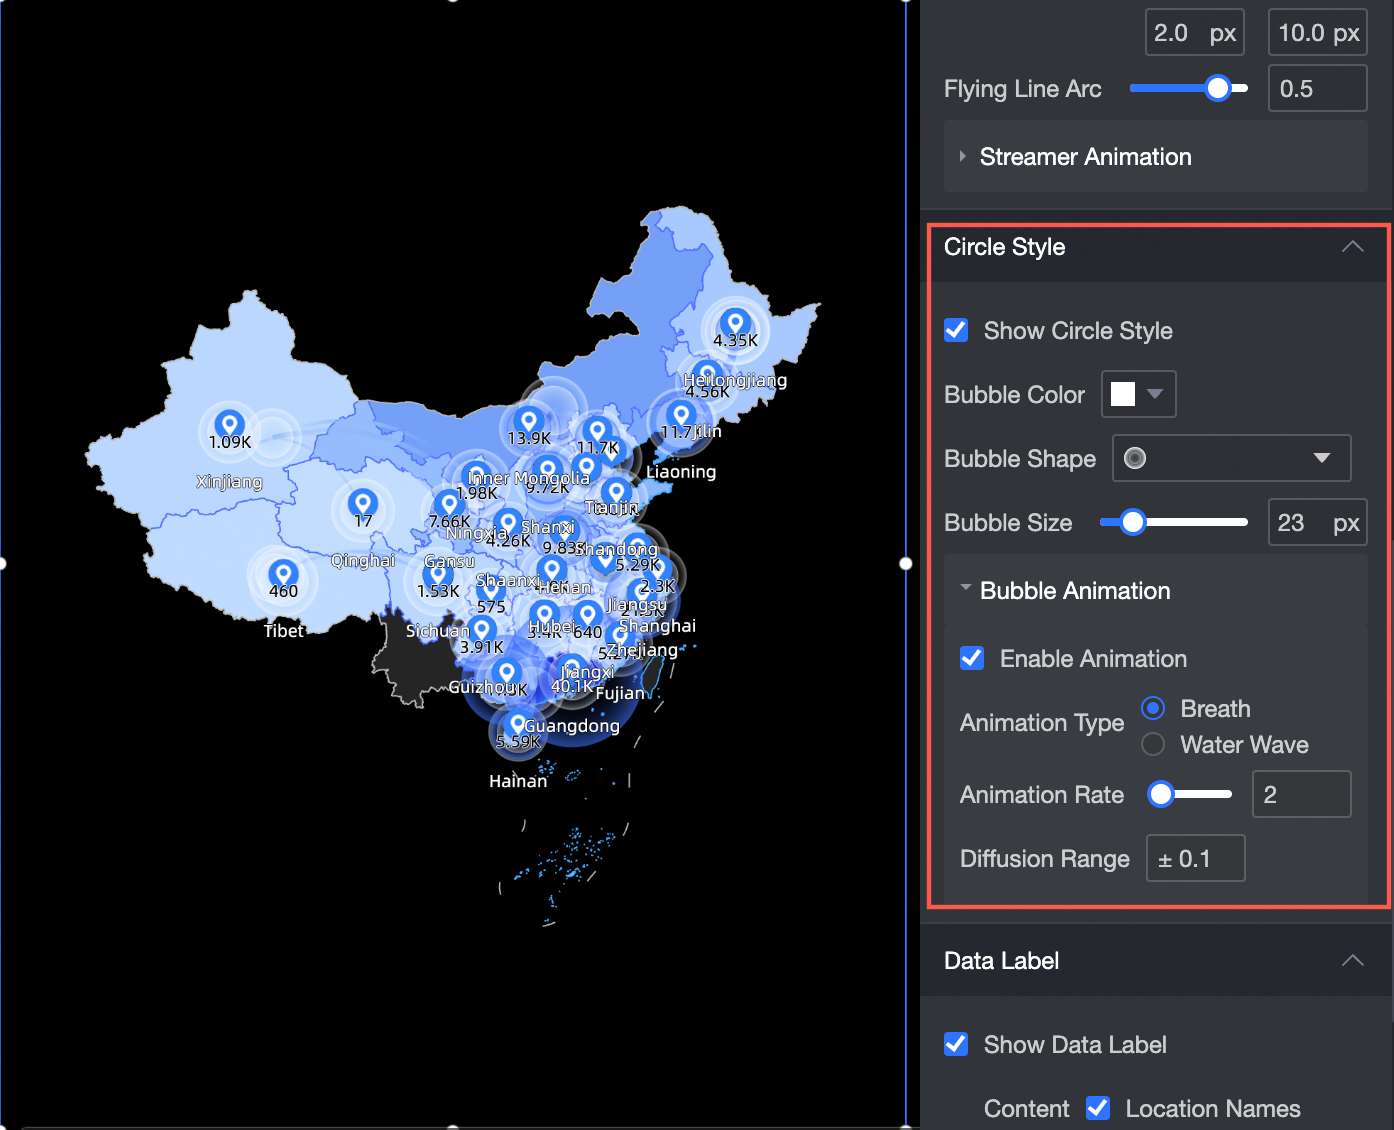
Destination bubbles
Show Destination Bubbles: Select whether to show destination bubbles. If you enable this option, you can configure the bubble Color, Shape, Size, and Animation.
Bubble Animation: After you enable bubble animation, you can set the bubble Animation Type (Breathing/Wave), Animation Speed, Diffusion Range, and Number of Ripples.
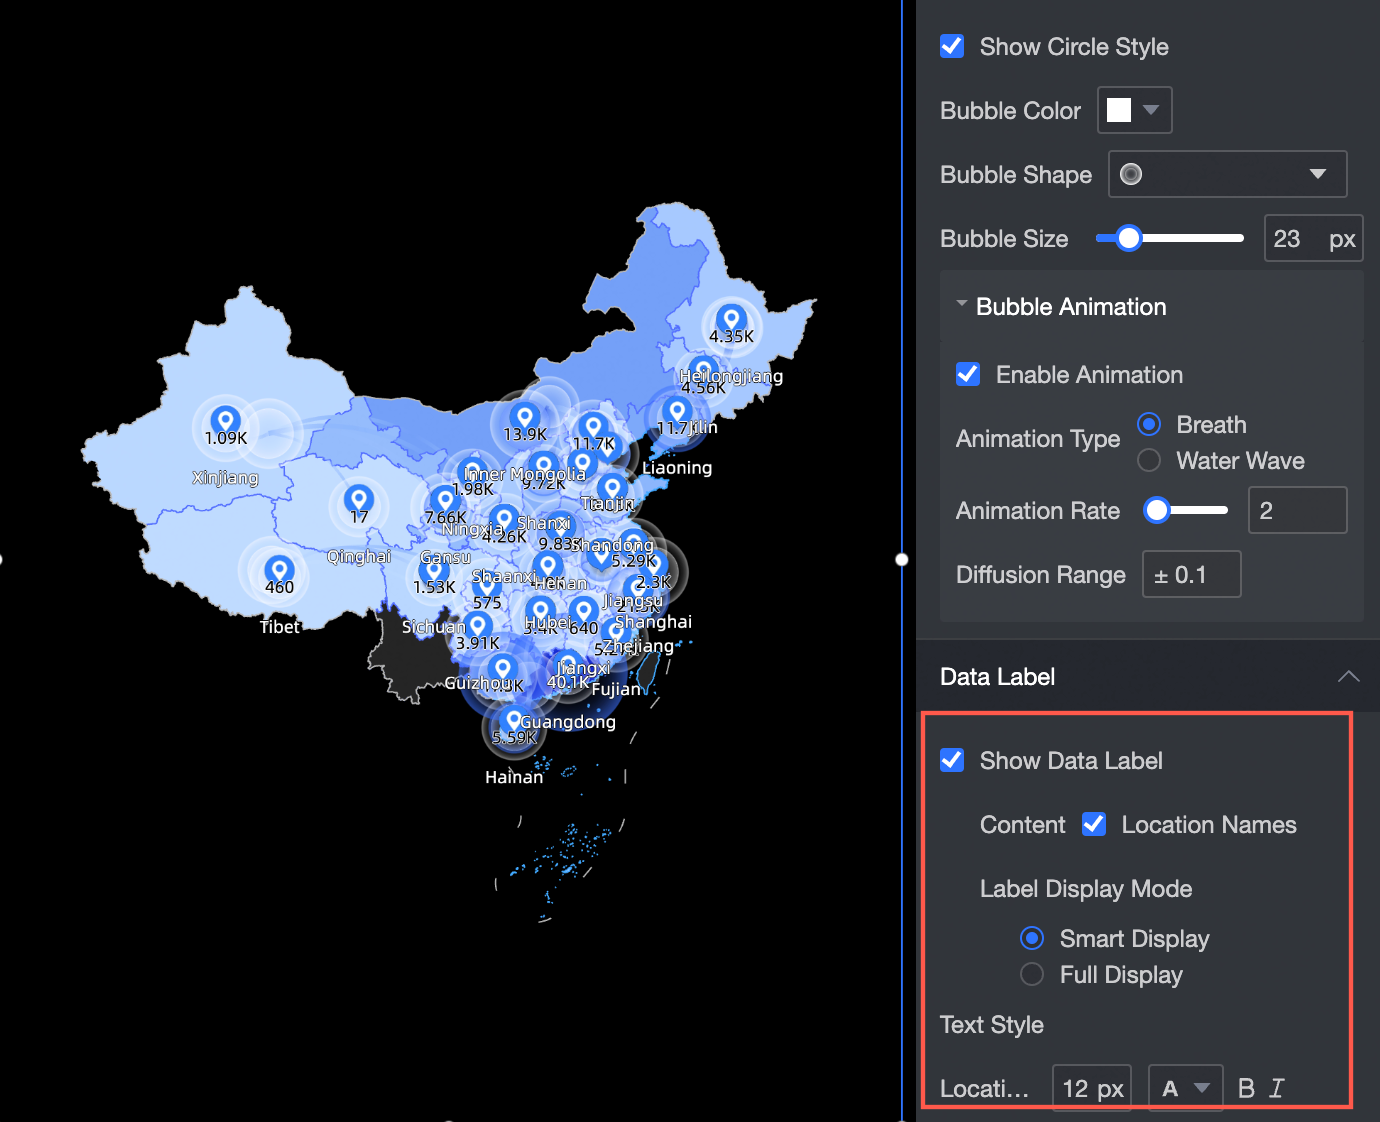
Data labels
Show Data Labels: Select whether to show data labels and the content to display.
Label Display Mode: You can select Smart Display or Show All. Smart Display is suitable for scenarios with many place names.
Text Style: Configure the text style for the data labels.
General settings
In the configuration pane, you can configure the following general settings:
Setting
Description
Geographic area
Display Range: Select Auto or Custom.
NoteAuto: The display range is automatically adjusted based on the data range. Custom: You can manually set the display range. In interactive analysis scenarios, the display range is always automatically adjusted.
The custom display range supports continents and countries worldwide, along with regions, provinces, and cities in China.

You can also select Manually Adjust. If you enable this option, the current centroid and scaling value are automatically generated and can be manually modified.

Outline and Fill: Configure the background color of the area and the color of the outline.
NoteOutlines are not supported for some areas.

Enable Dragging: If you enable this option, you can drag the map in the preview.
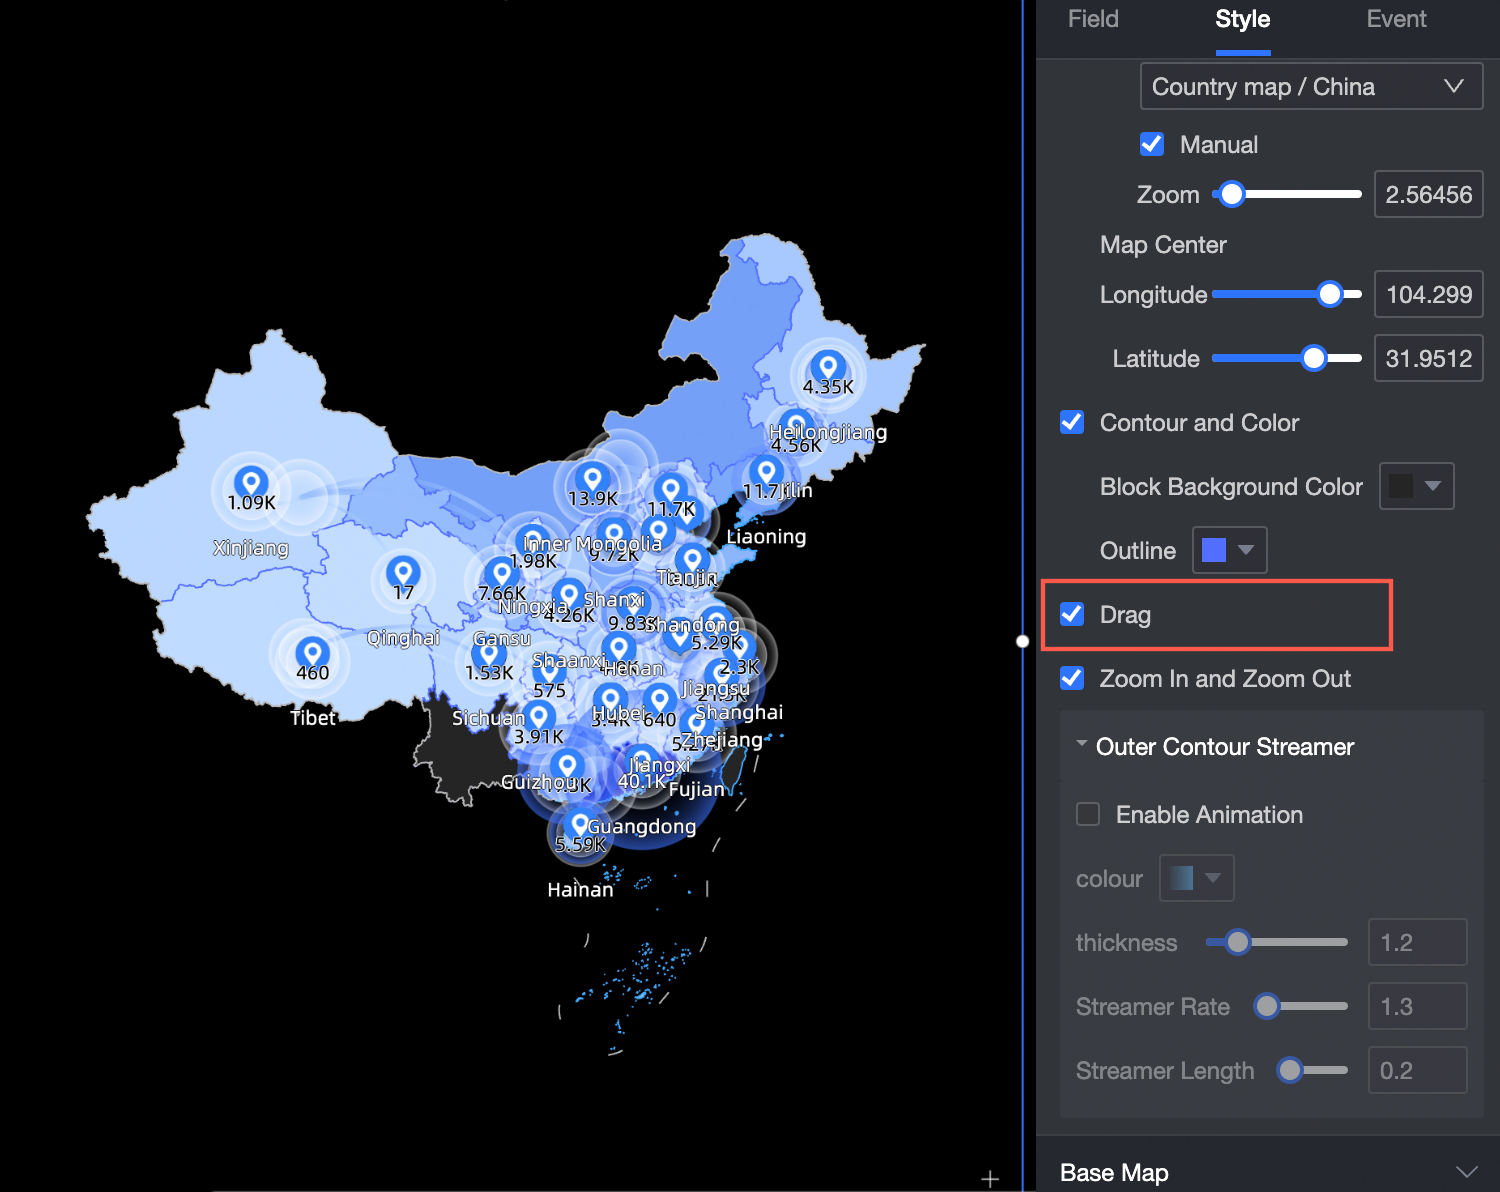
Enable Scaling: If you enable this option, you can zoom in or out on the map in the preview.
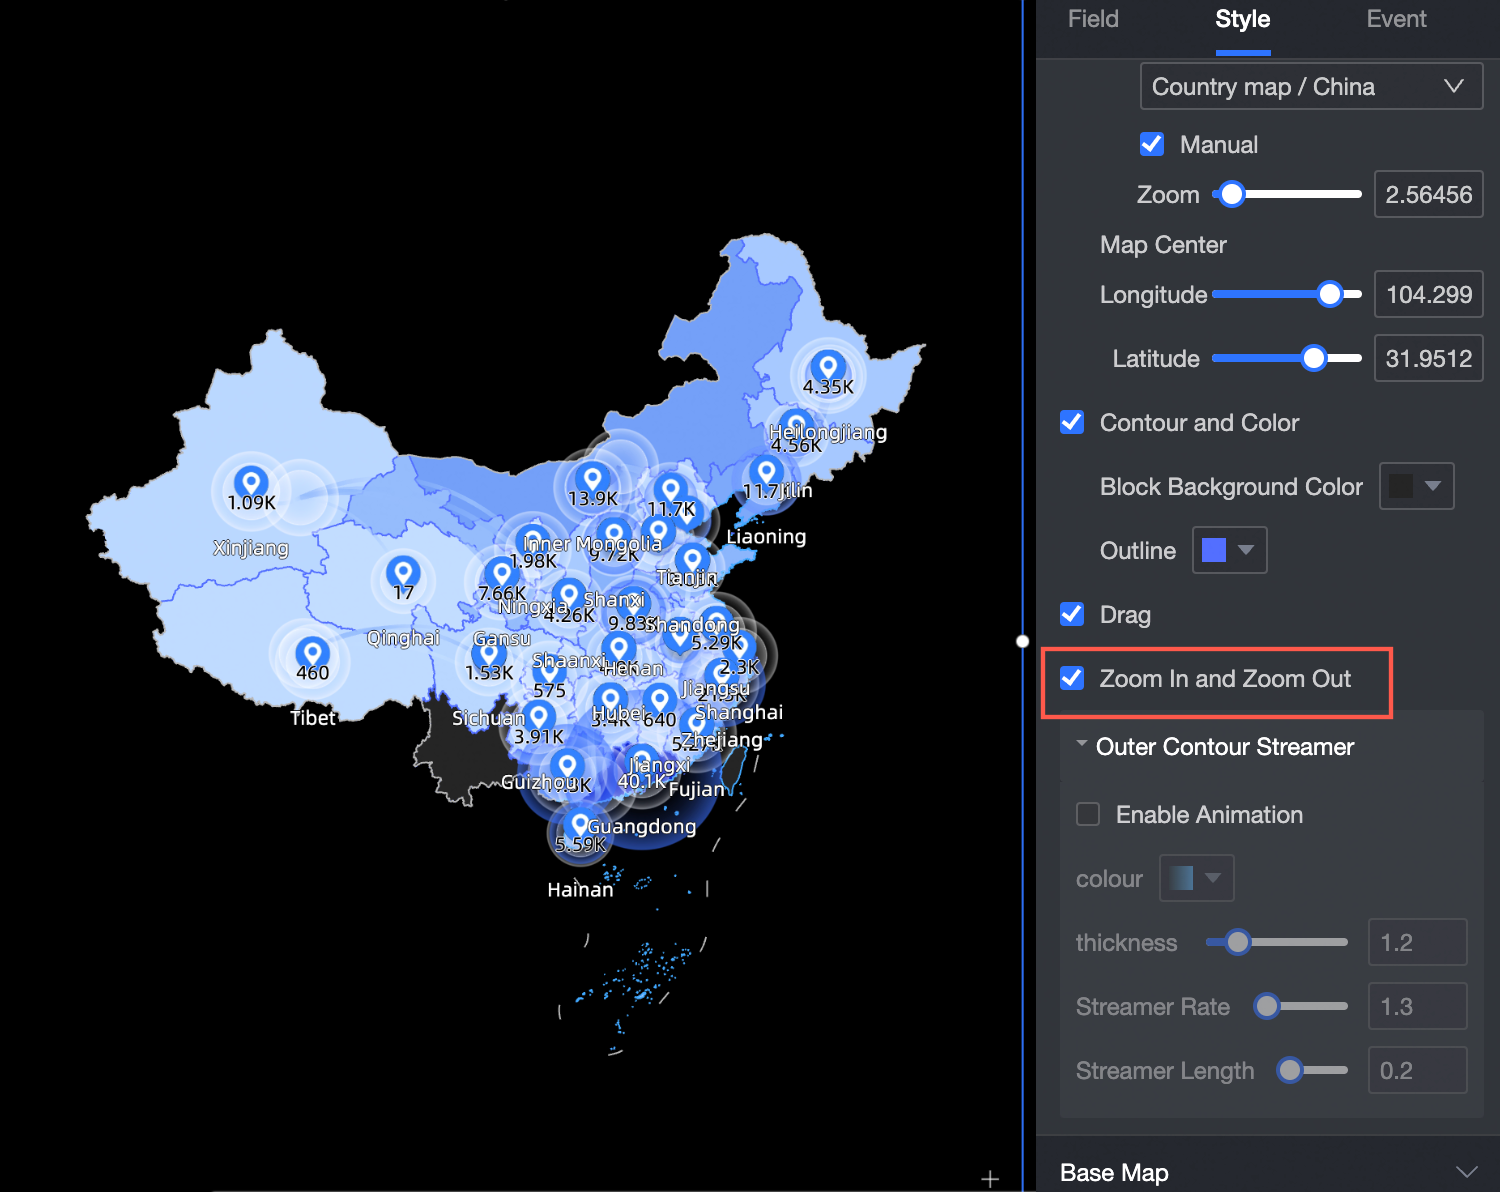
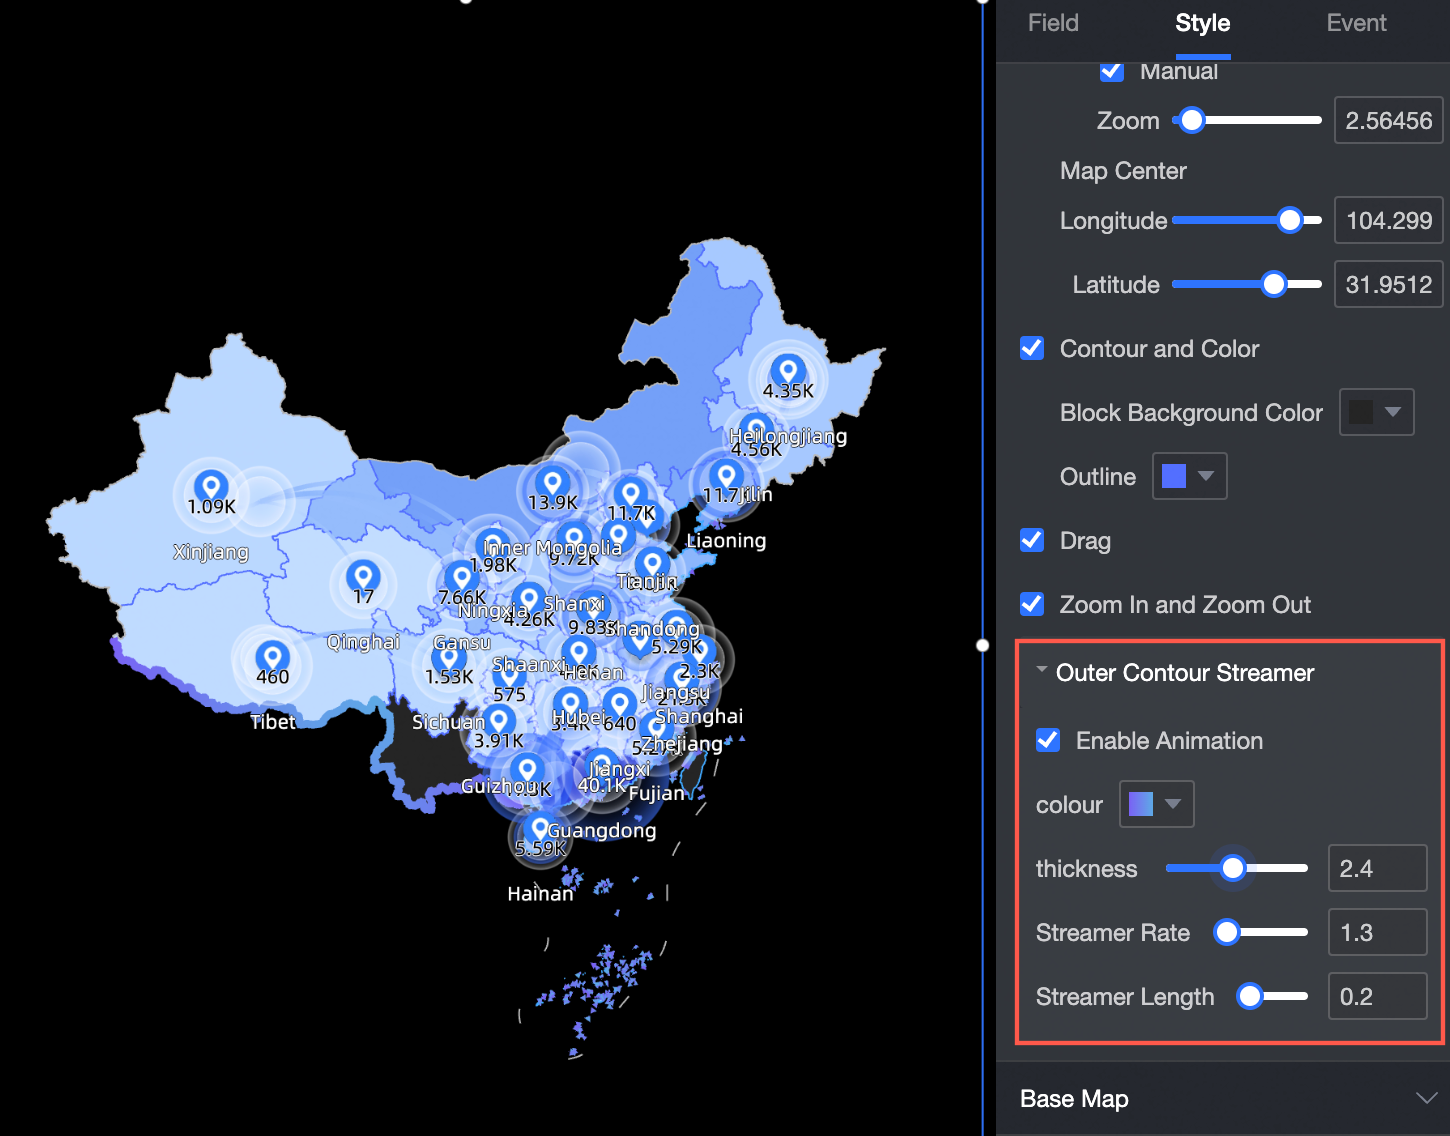
Outer Outline Streaming Light: Enable or disable this effect. If enabled, you can configure the Streaming Light Color (Solid/Gradient), Thickness, Speed, and Length.
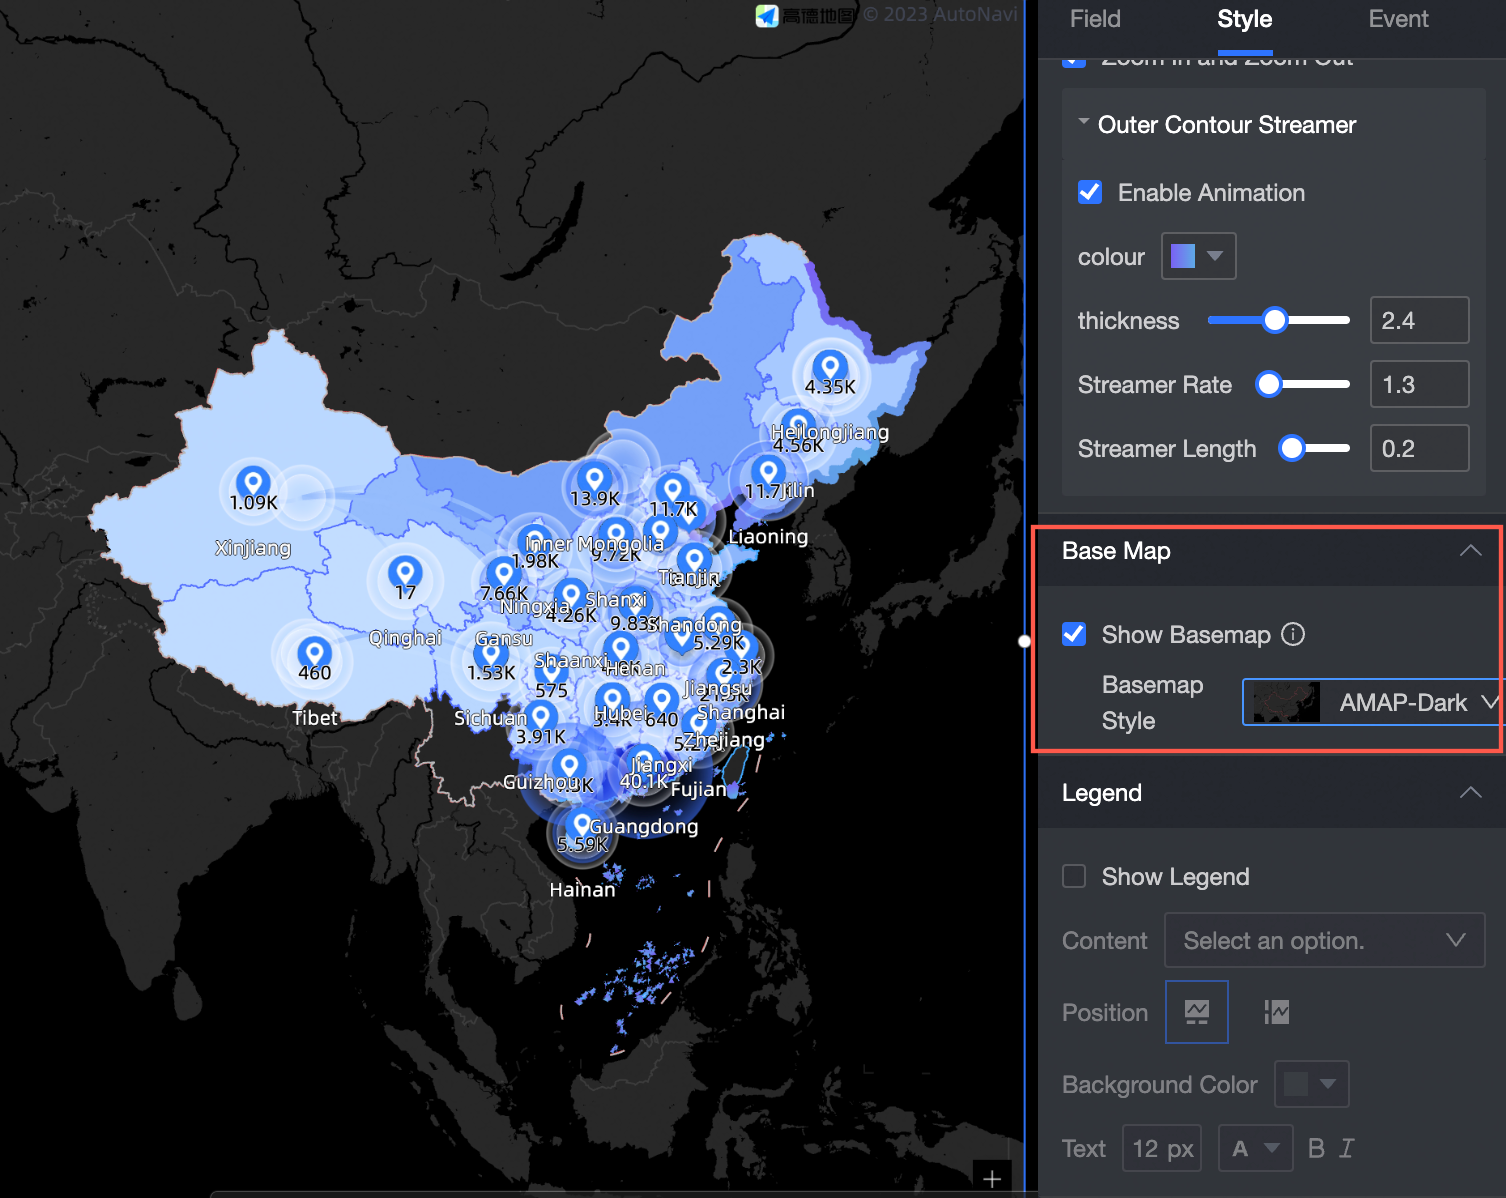
Basemap
Show Basemap: Select whether to show the basemap.
Basemap Style: If the basemap is enabled, select a style for it.
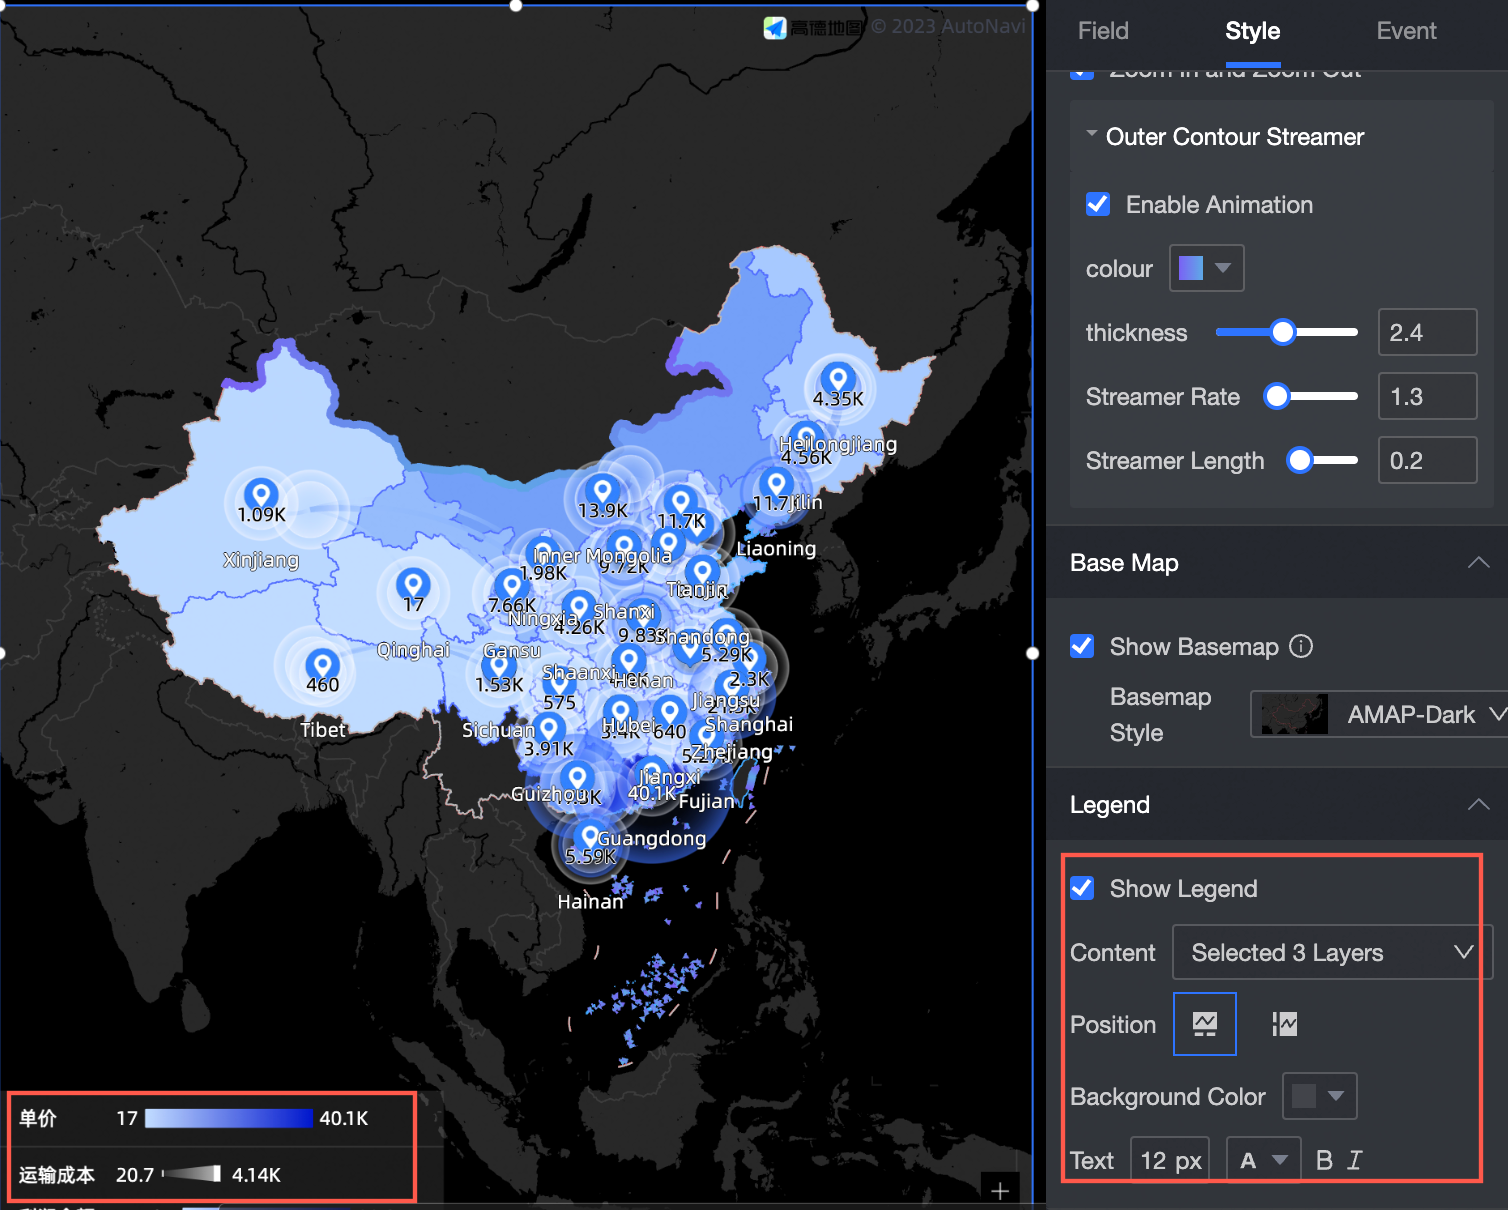
Legend
Show Legend: Select whether to show the legend. You can also specify which Layer and Content to display.
Legend Position: Place the legend at the Bottom or on the Left.
Background Color: Set the background color for the legend.
Text: Set the text style for the legend.
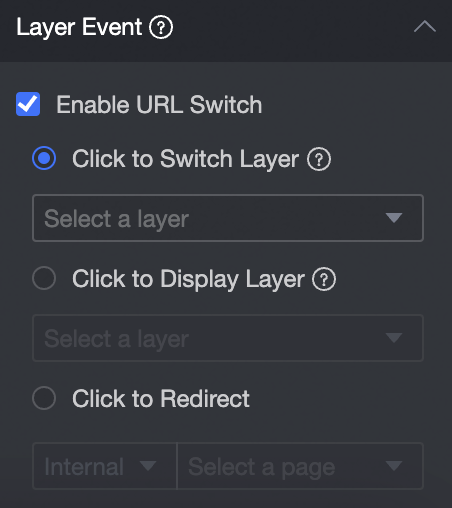
Configure chart events
Configuration item | Name | Configuration | Description |
Layer event | Enable URL Redirect |
| For a layer event, you can select Enable URL Redirect, Pop up Layer on Click, or Go to Page on Click. For more information about the settings, see Configure click events. |