Application Real-Time Monitoring Service (ARMS) provides multiple sub-services. To meet different requirements, each sub-service provides multiple editions, such as the Basic Edition and Pro Edition. This topic compares the features of different editions of the Application Monitoring sub-service.
Application Monitoring Basic Edition and Browser Monitoring Basic Edition have stopped activation, and will no longer provide technical support from March 31, 2024. For more information, see [Billing changes] Discontinuation of Application Monitoring Basic Edition and Browser Monitoring Basic Edition activation.
Application Monitoring is an application performance monitoring tool. It combines the industry-leading theoretical models of distributed application monitoring and tracing with the practices of Alibaba Group. This sub-service provides more comprehensive, real-time application monitoring services. For more information about the billing of each edition, visit the ARMS pricing page.
Feature | Basic Edition | Pro Edition |
Application overview | ||
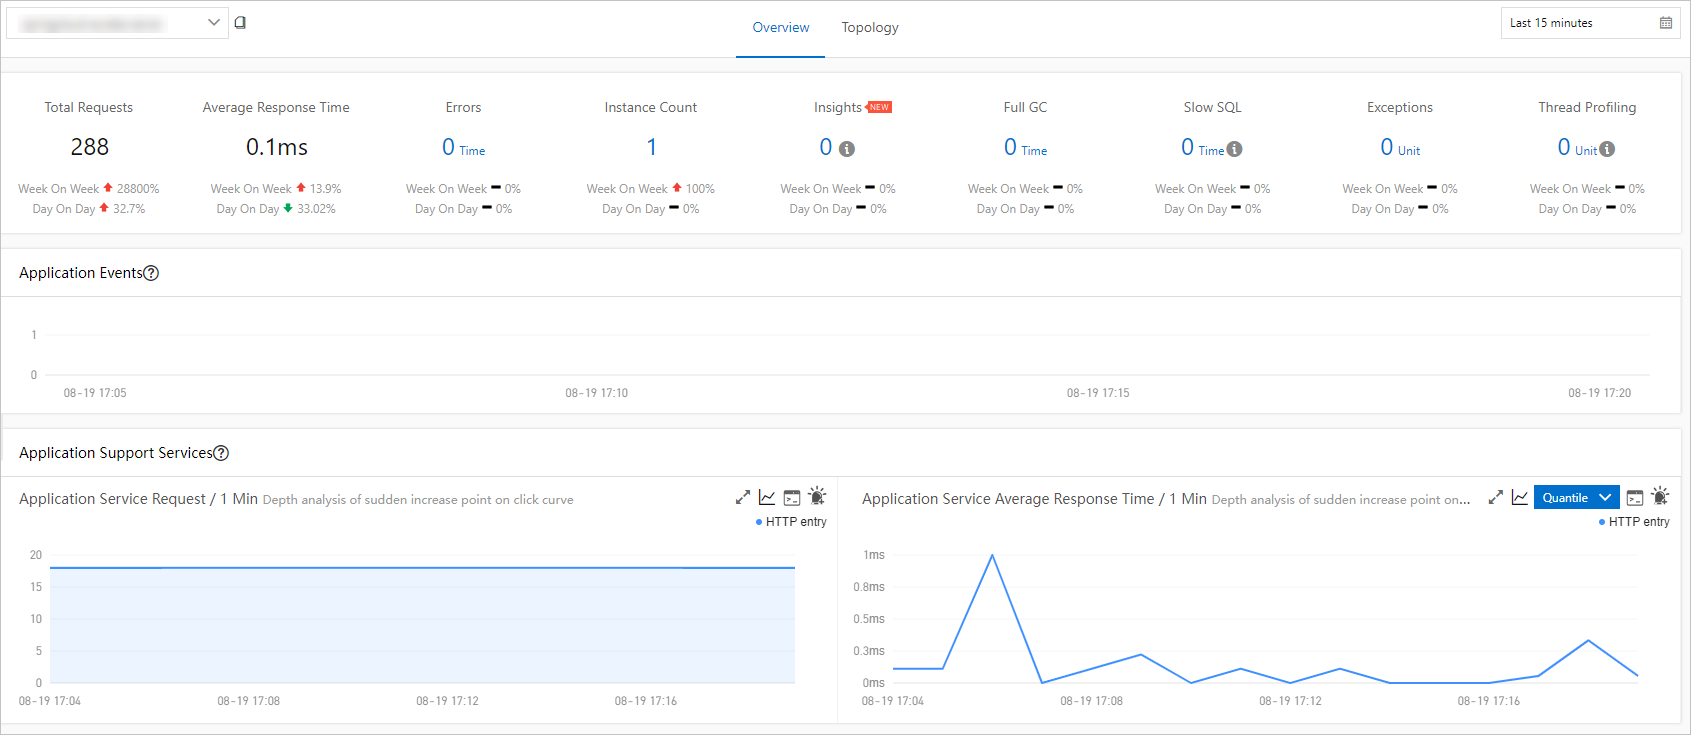
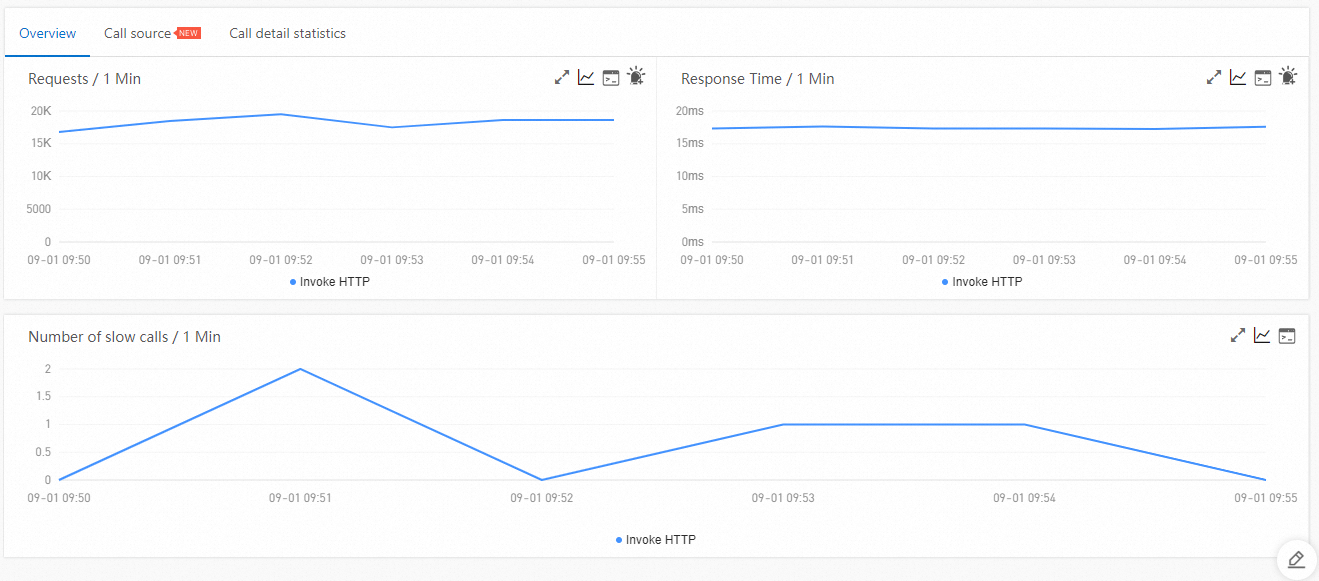
Displays application statistics, such as the total number of requests, average response time, and the number of real-time instances. It also displays time series charts such as the number of service requests and the service response time. The application overview feature allows you to view the overall performance of applications. |
|
|
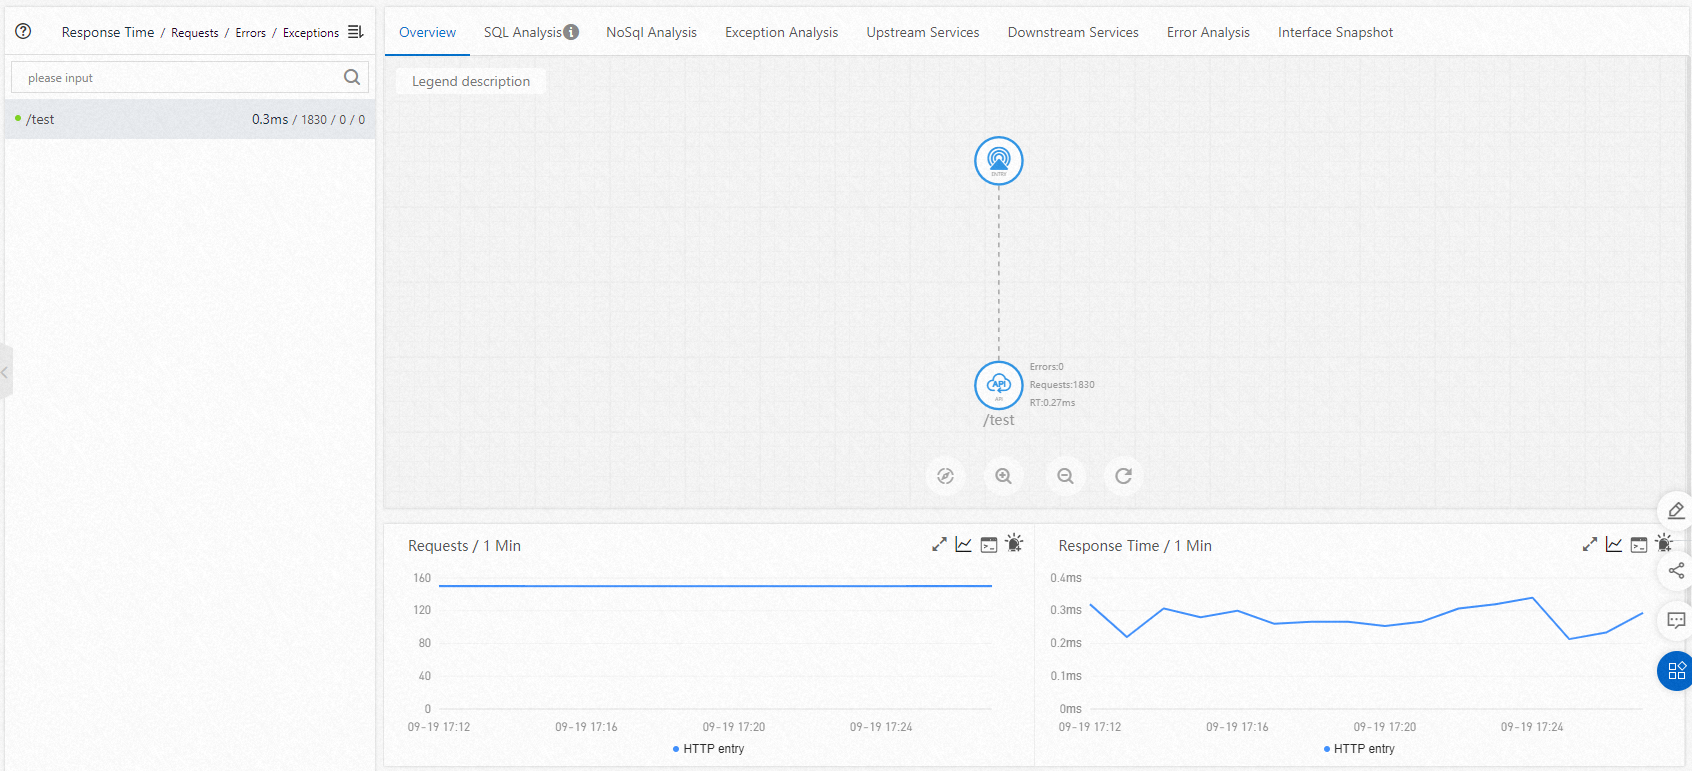
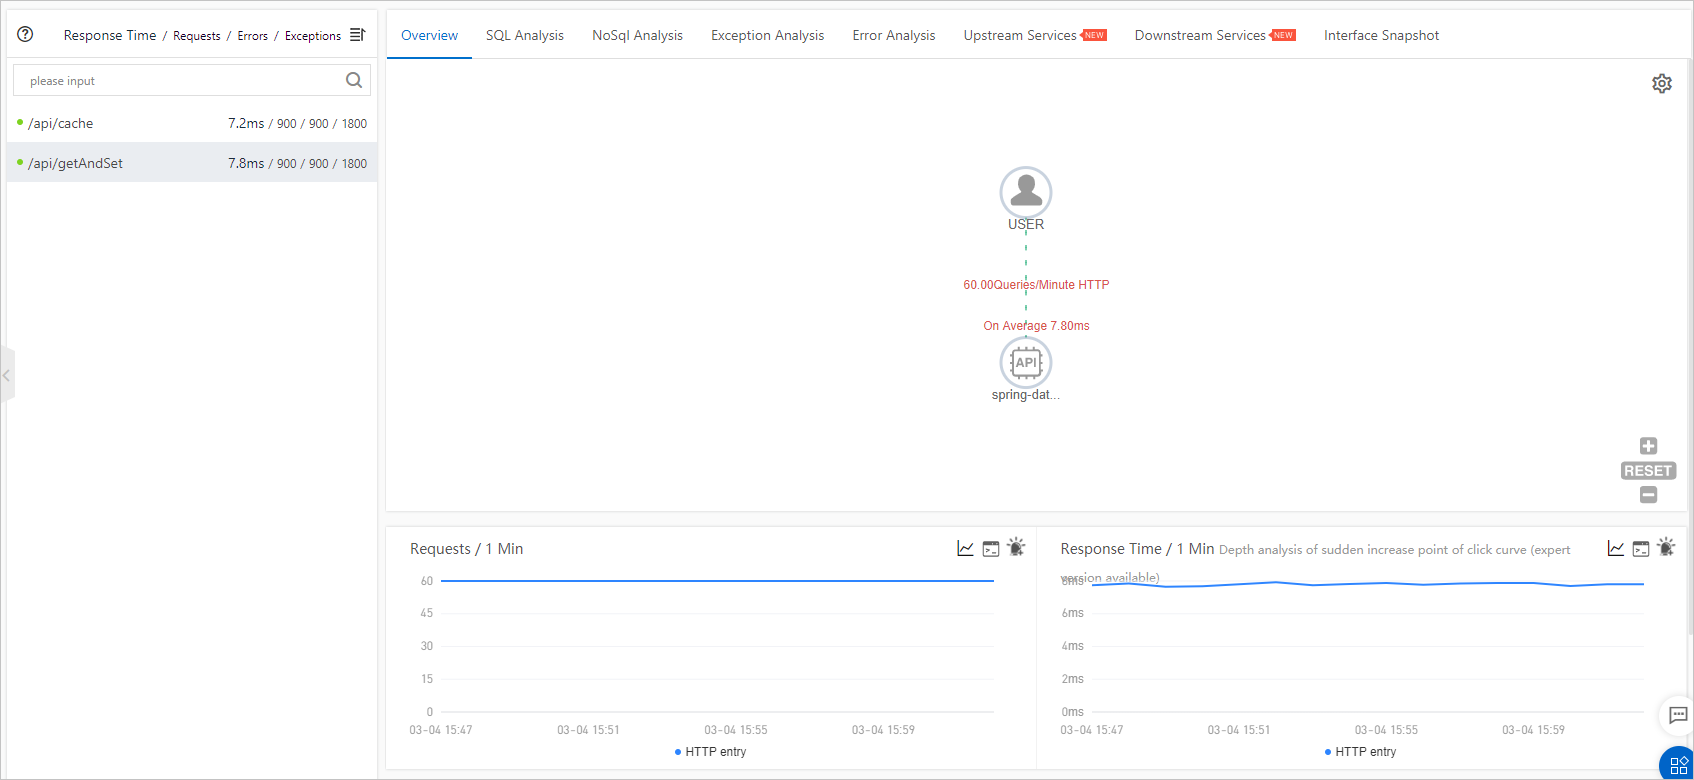
Automatically identifies the call relationships between applications or between APIs, and generates a real-time topological graph. |
|
|
Application details | ||
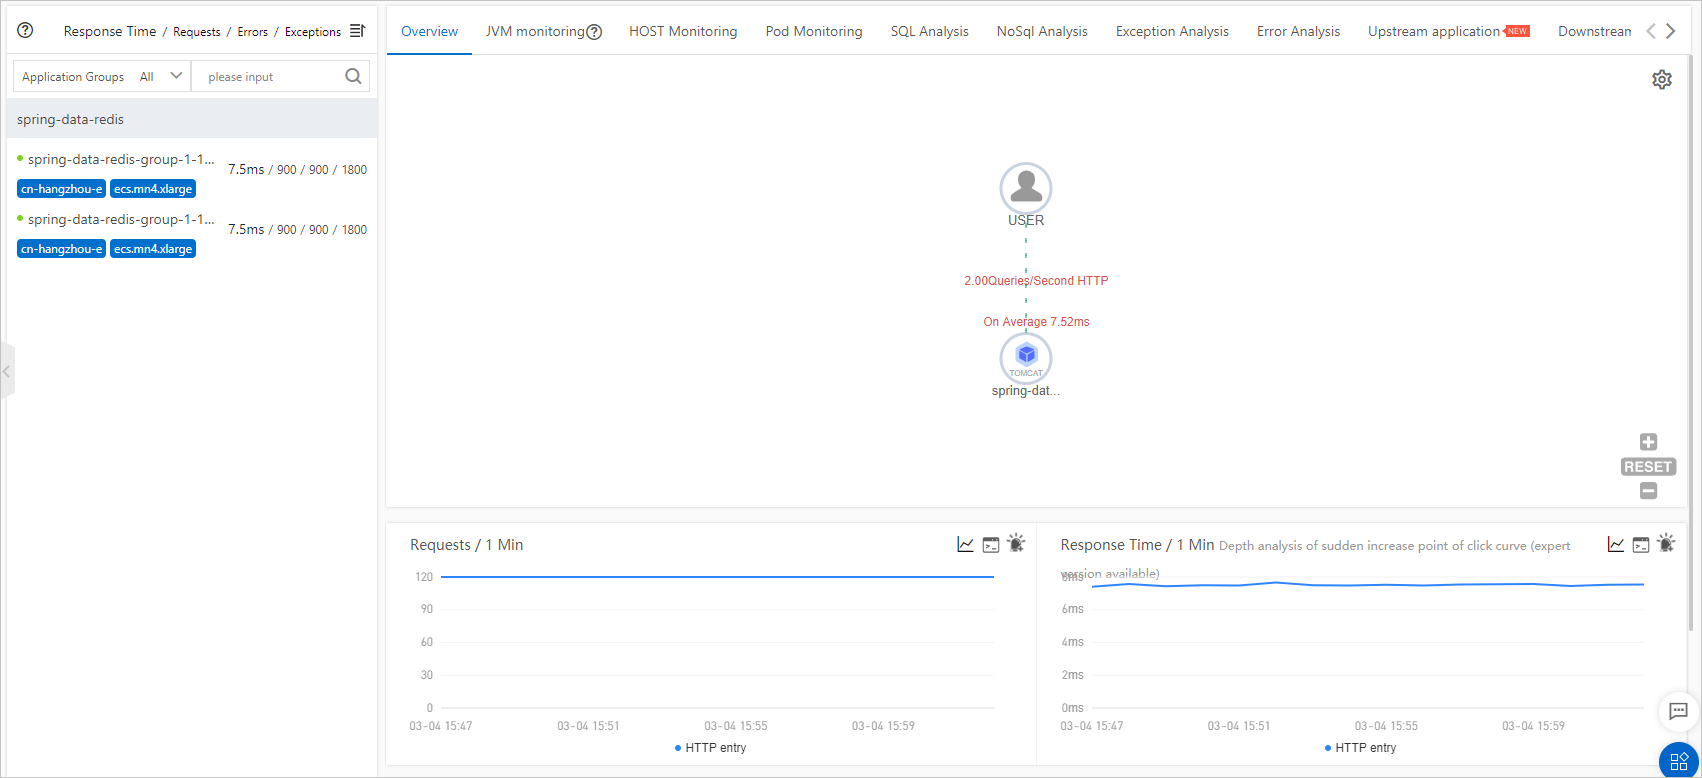
Overview Automatically identifies the call relationships between applications or between APIs, and generates a real-time topological graph. |
|
|
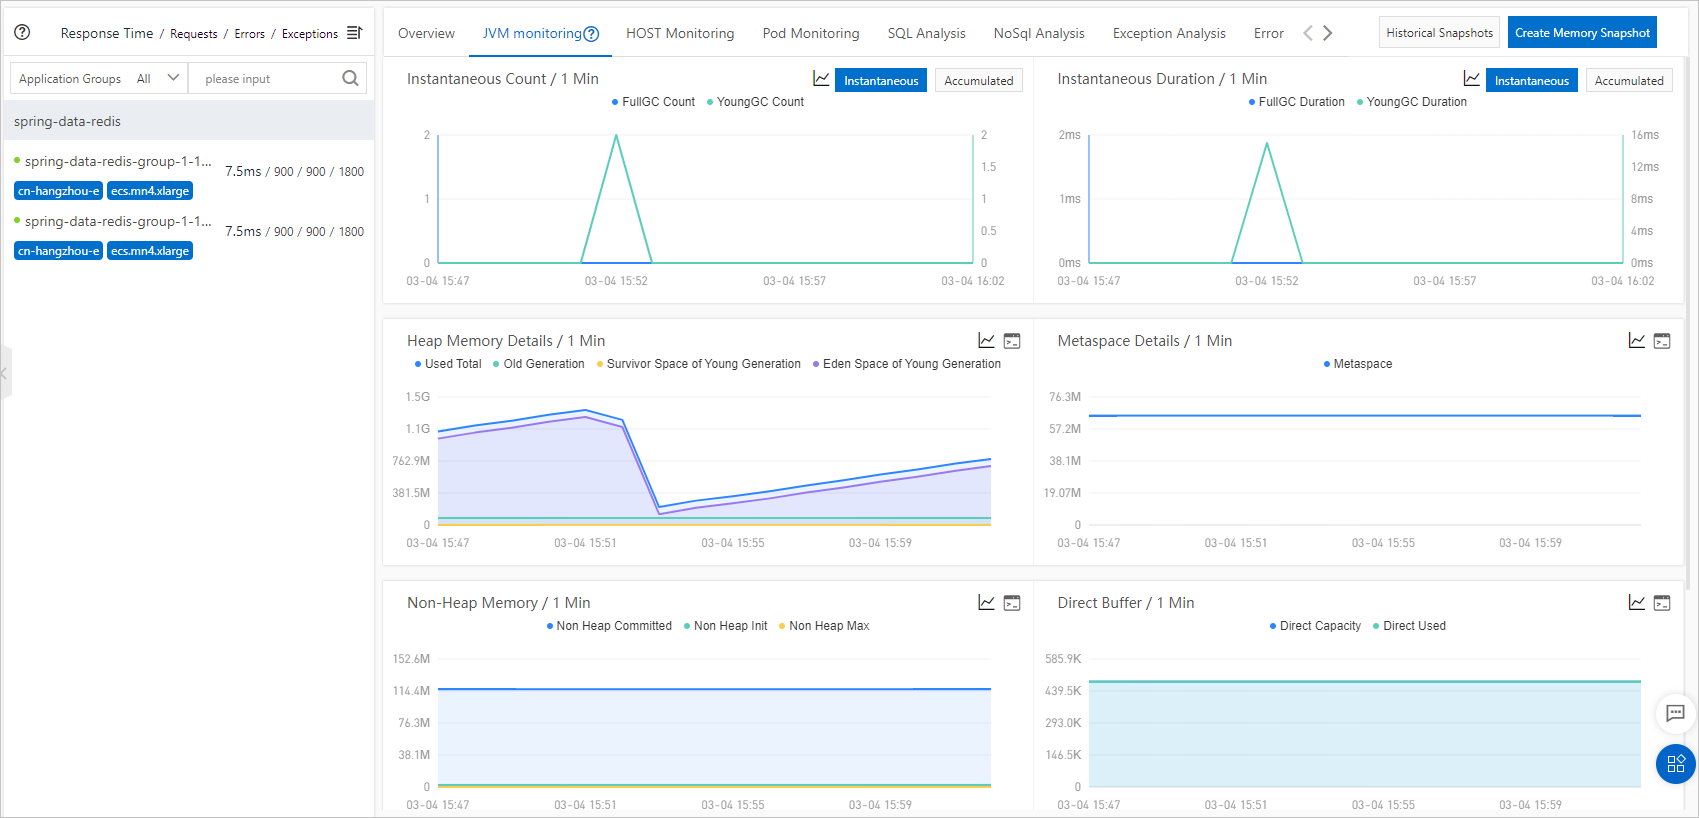
Monitors heap memory metrics, non-heap memory metrics, direct buffer metrics, memory-mapped buffer metrics, garbage collection (GC) details, and the number of JVM threads. |
|
|
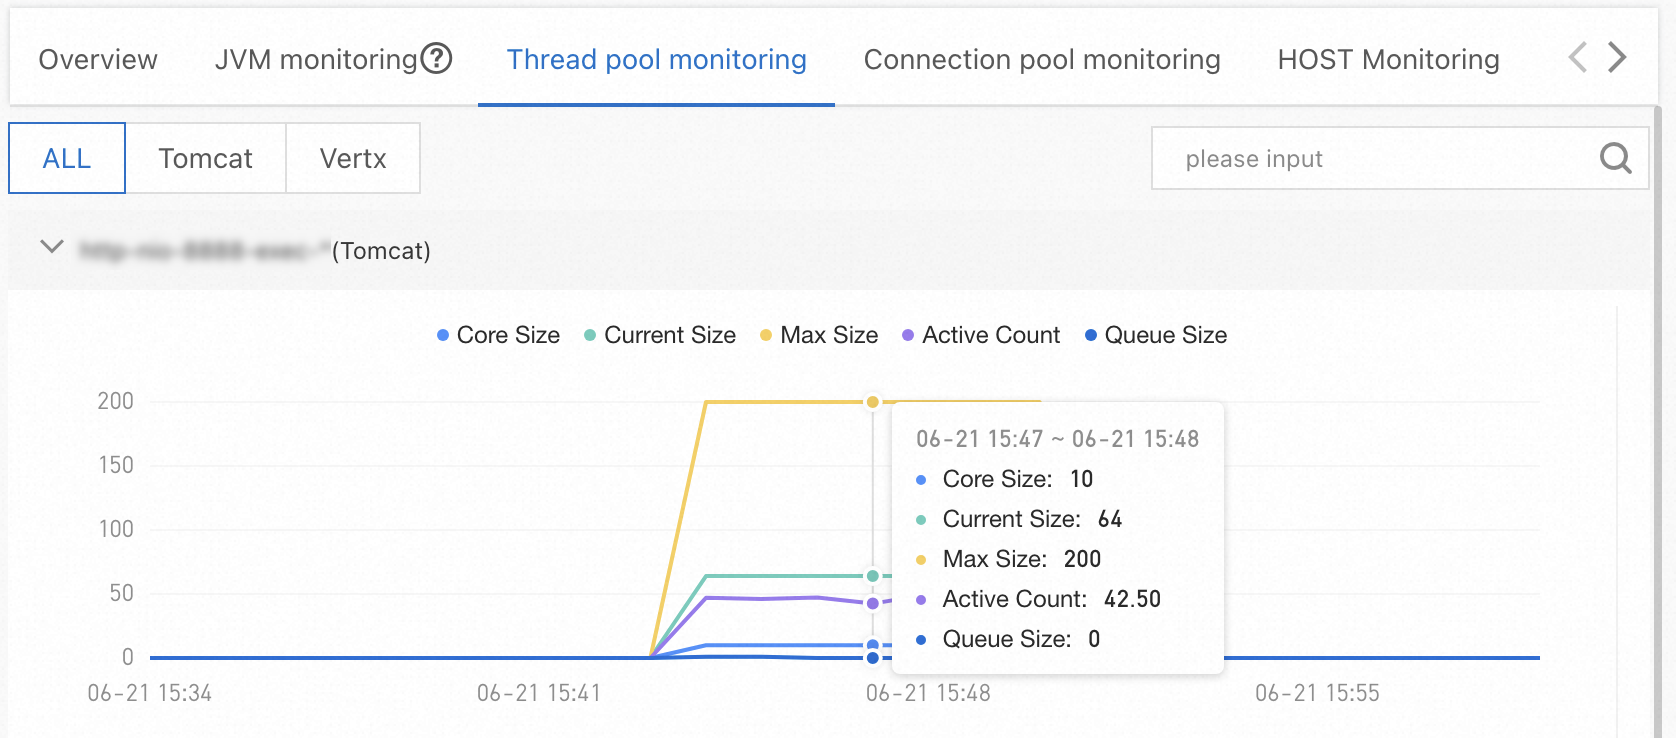
Thread pool and connection pool monitoring Monitors thread pool metrics such as the number of core threads, number of existing threads, maximum number of allowed threads, number of active threads, number of submitted tasks, and maximum number of tasks allowed in a task queue. |
|
|
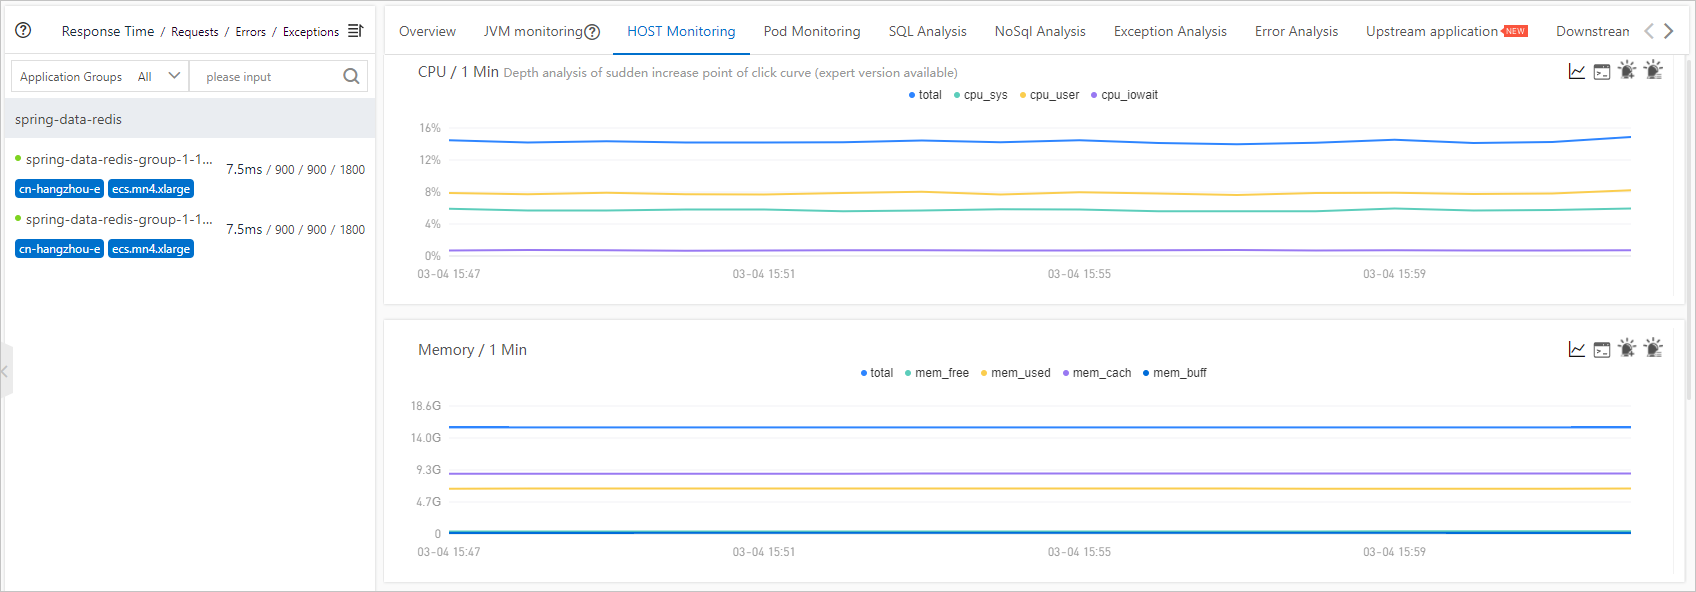
Monitors host metrics such as CPU, memory, disk, load, network traffic, and network packets. |
|
|
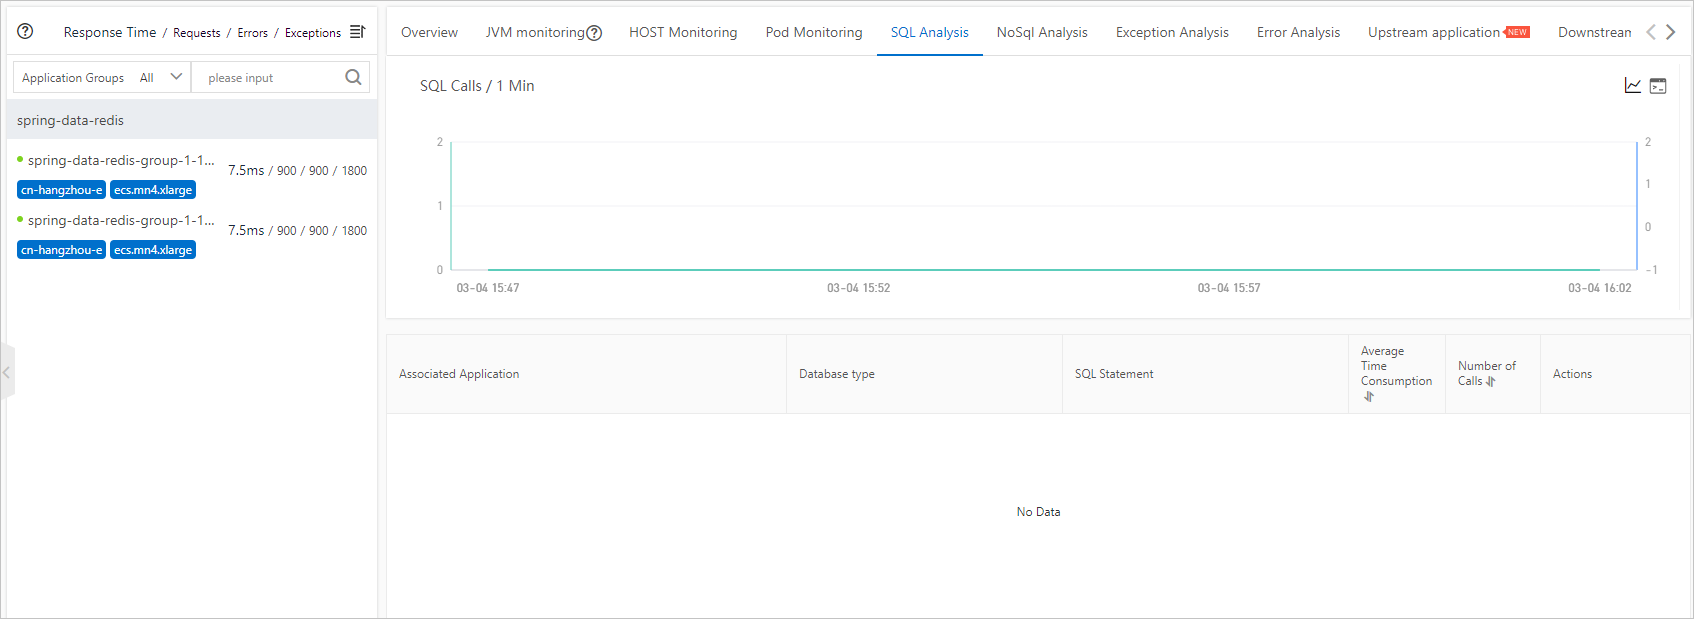
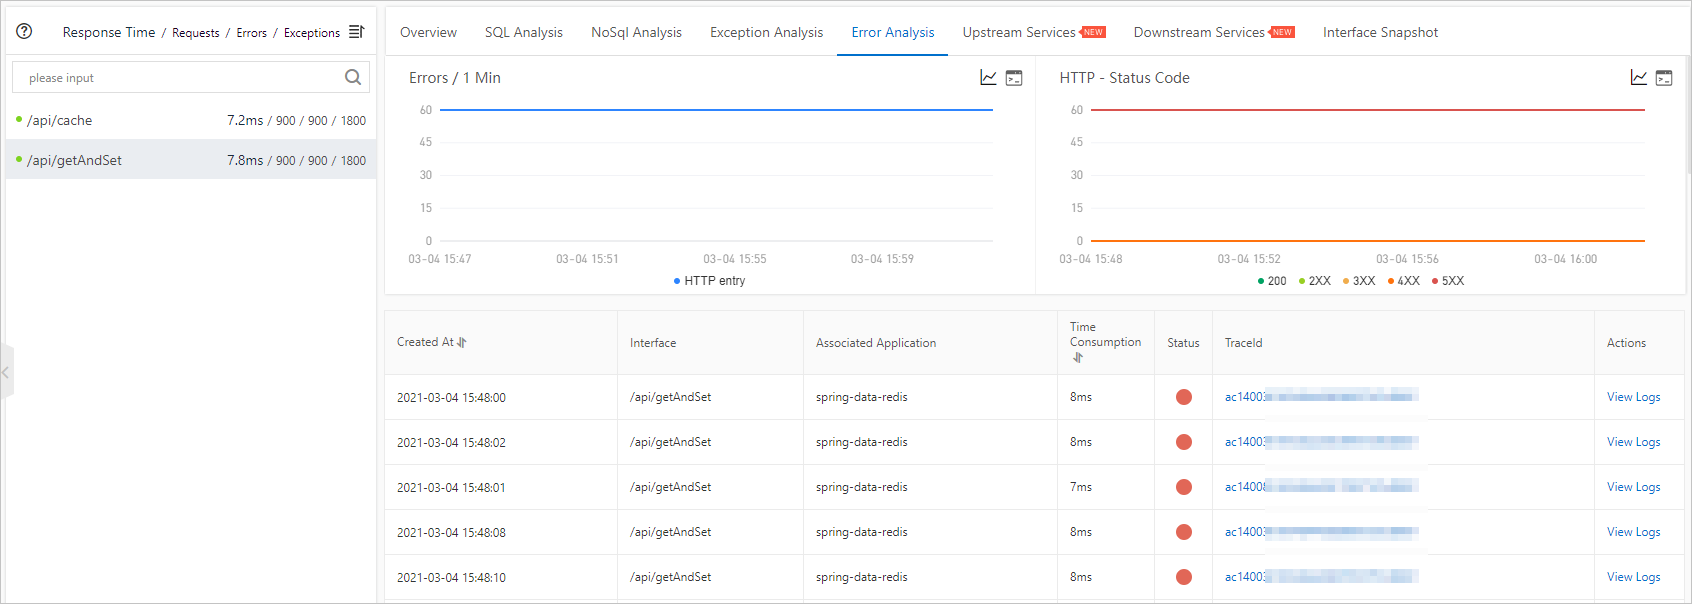
SQL analysis, NoSQL analysis, exception analysis, and error analysis Displays and analyzes SQL statements, exceptions, and errors with respect to dimensions such as the application, instance, and API. |
|
|
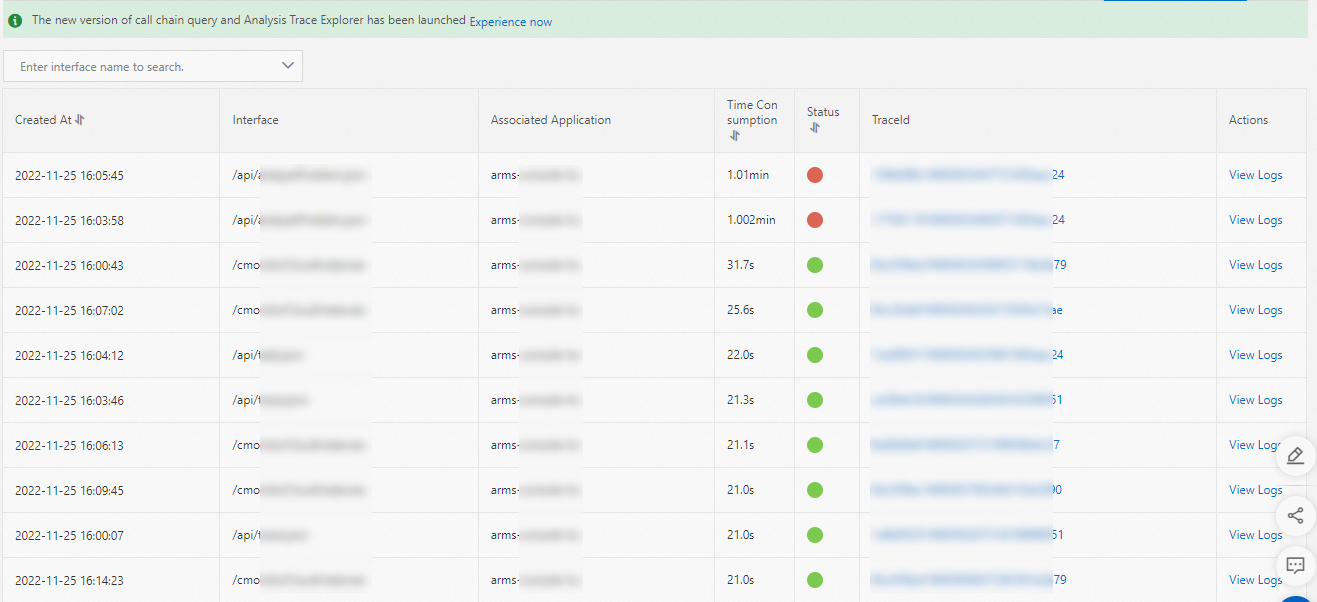
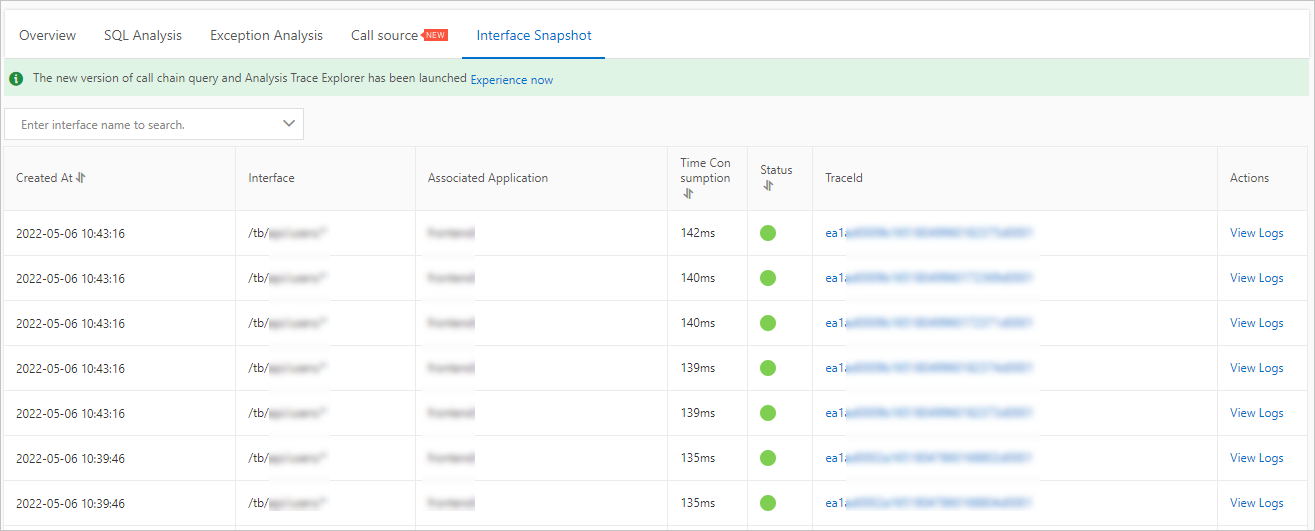
Displays the information about each API call, including duration, status, and the time when the call is made. |
|
|
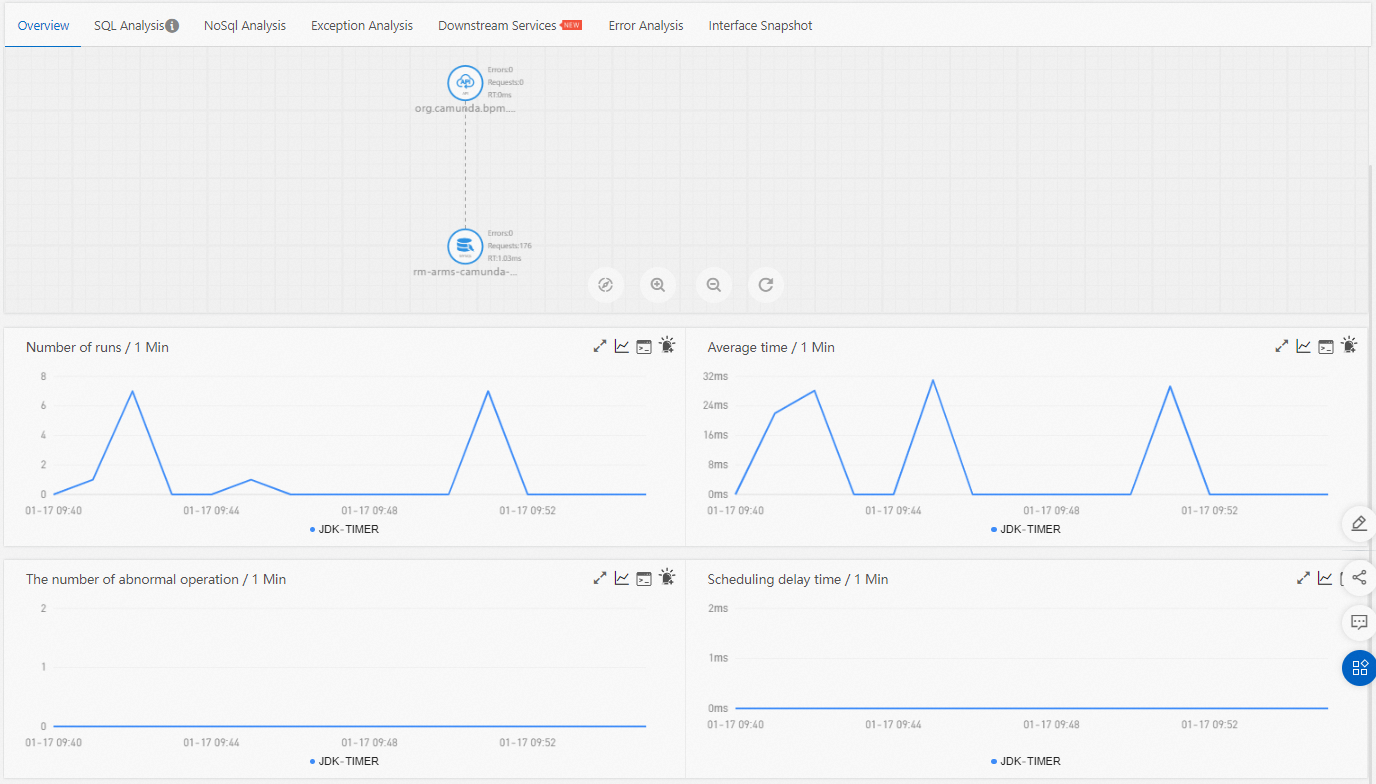
Displays the details of a scheduled application monitoring task, including task overview, analysis of SQL requests and NoSQL requests, exception analysis, error analysis, downstream services, and traces.
|
|
|
API calls | ||
Overview Automatically identifies the call relationships between applications or between APIs, and generates a real-time topological graph. |
|
|
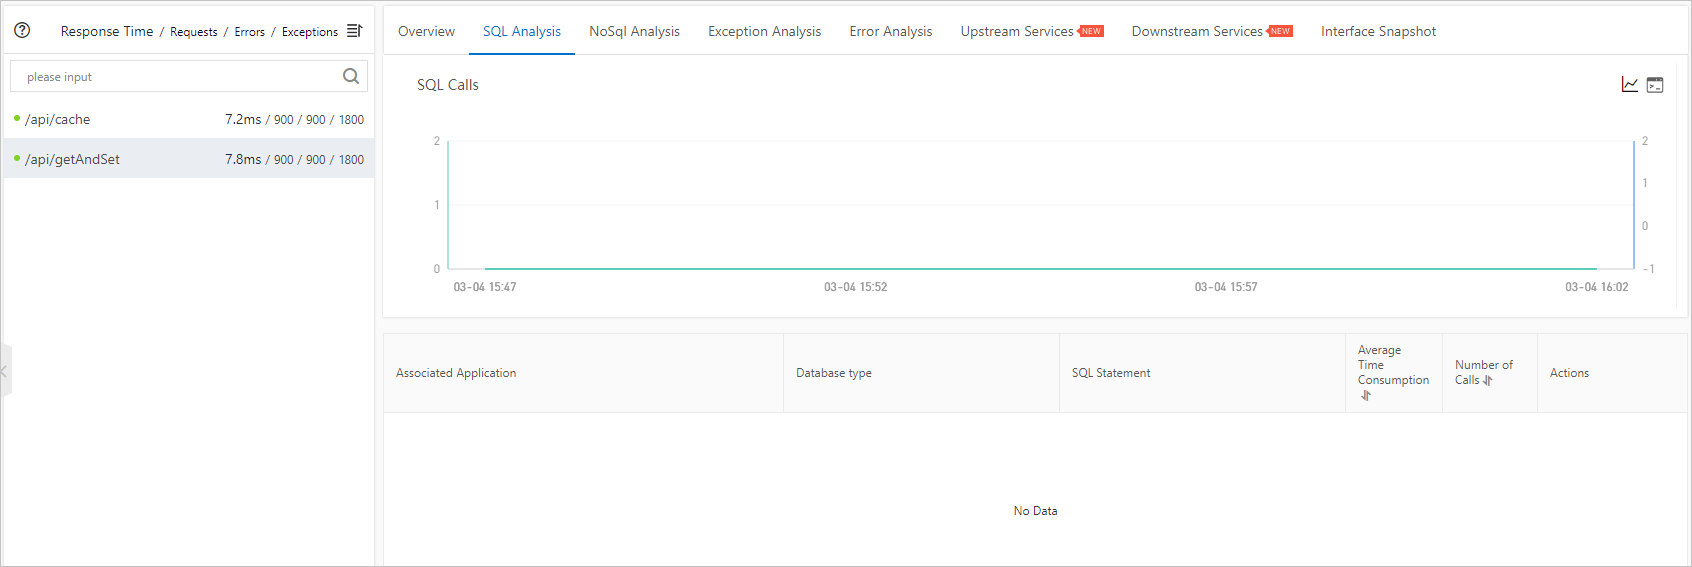
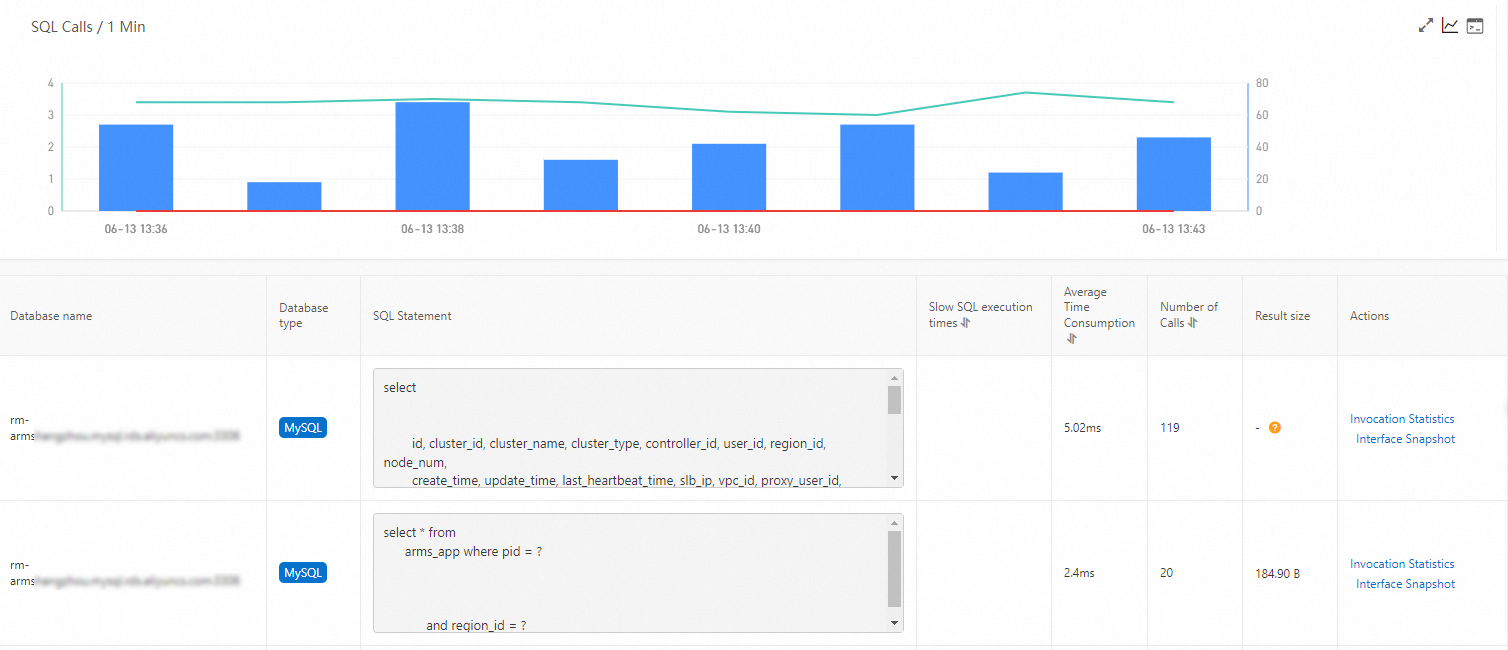
SQL analysis and NoSQL analysis Analyzes SQL statements with respect to dimensions such as the application, instance, and API. This allows you to diagnose the causes of slow calls. |
|
|
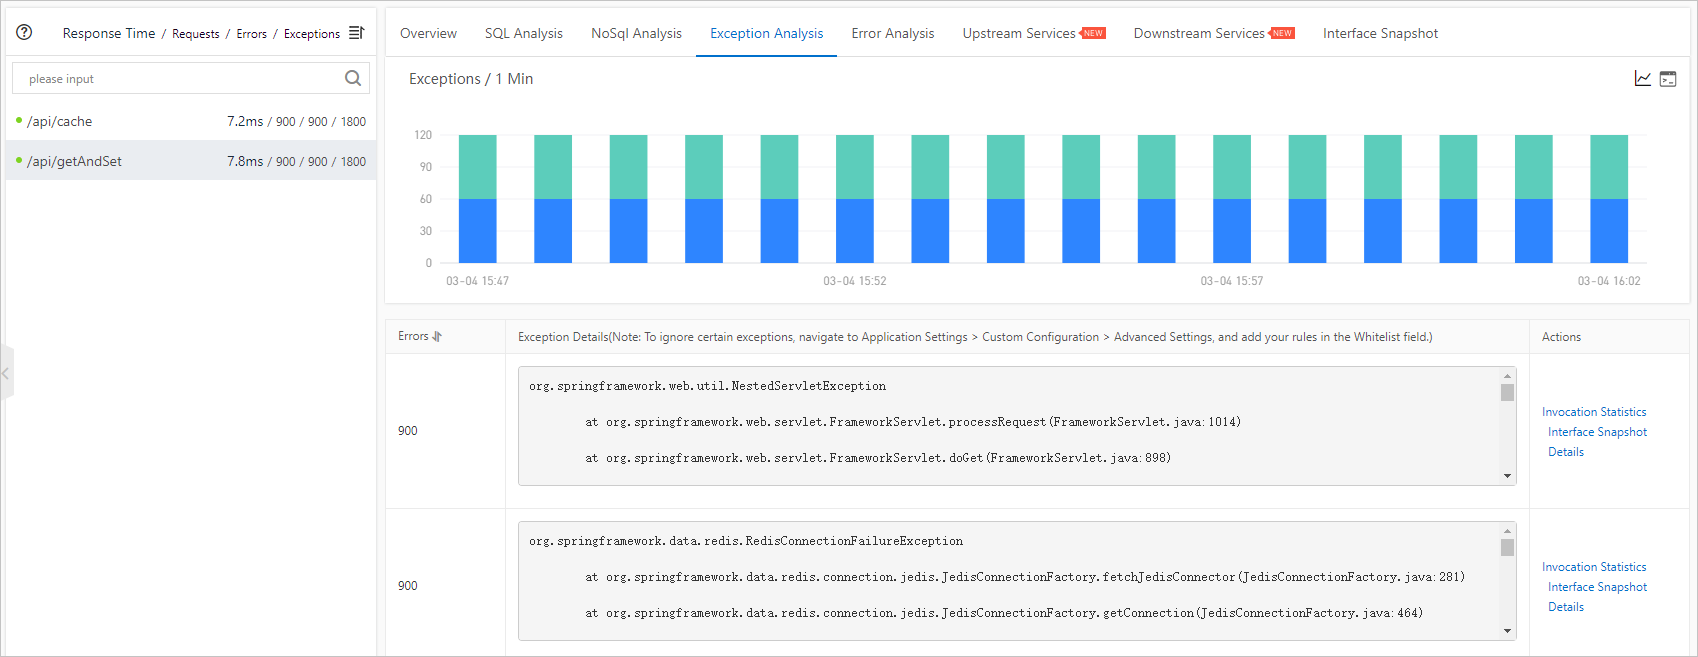
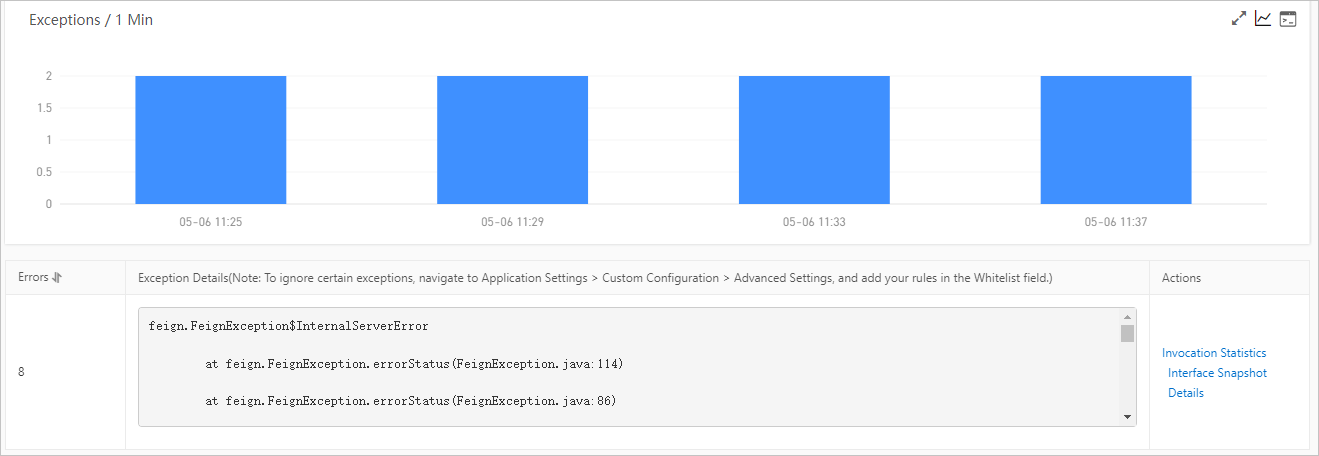
Analyzes the drill-down information of exceptions with respect to dimensions such as the application, instance, and API. |
|
|
Displays the statistics of application errors and HTTP status codes. |
|
|
Upstream services and downstream services Displays the statistics of the APIs and their call performance metrics. These statistics include the number of requests, response time, and number of errors. |
|
|
Displays the parameter details of each API, the number of trace calls generated based on the parameter details, and the response time of each trace. |
|
|
Manages, stores, analyzes, and displays event data that is generated by cloud services in a centralized manner. |
|
|
Database calls | ||
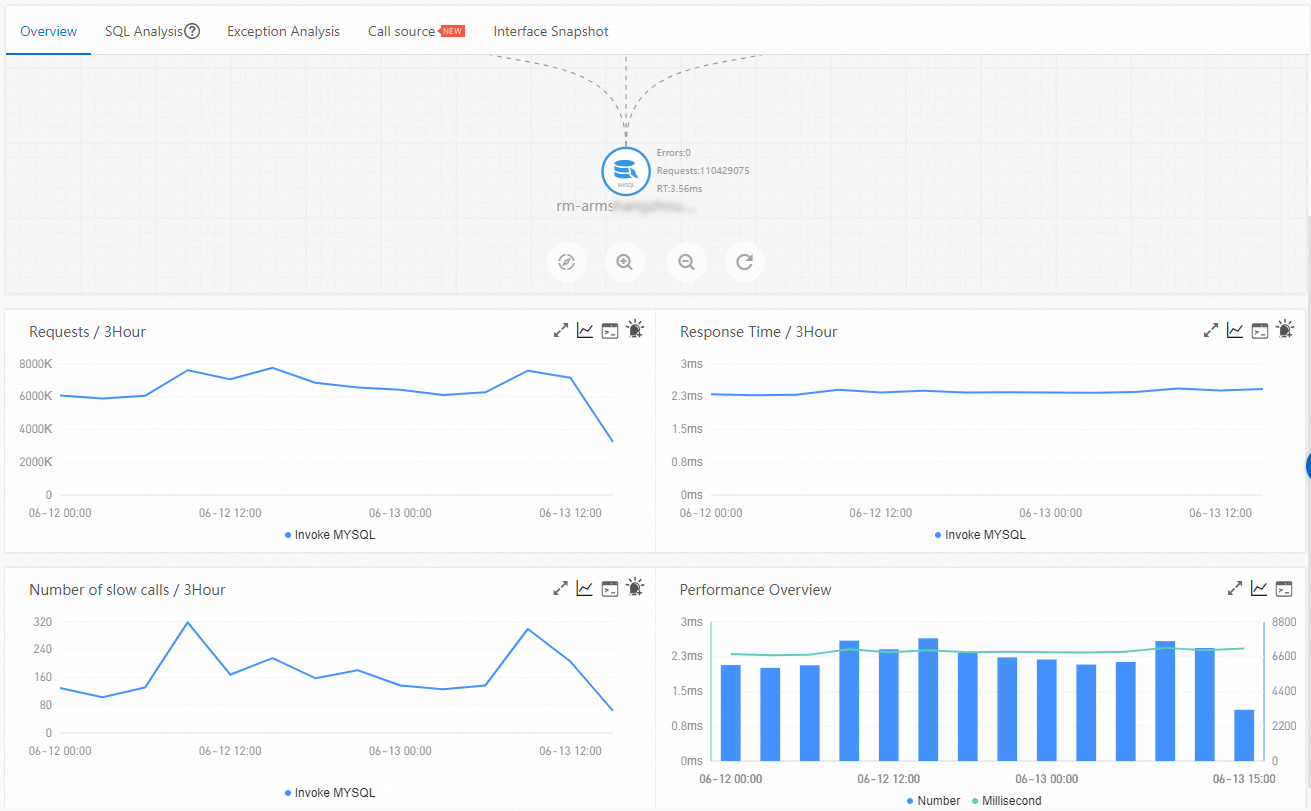
Automatically identifies the call relationships between applications and databases, and generates a real-time topological graph. |
|
|
Analyzes SQL statements with respect to dimensions such as the application, instance, and API. This allows you to diagnose the causes of slow calls. |
|
|
Analyzes the drill-down information of exceptions with respect to dimensions such as the application, instance, and API. |
|
|
Displays the APIs that are used to call databases.
|
|
|
Displays all traces of each database. |
|
|
Other monitoring features | ||
Displays the statistics of metrics such as the number of external requests, response time, number of errors, and HTTP status codes. |
|
|
Displays the statuses of topic publishing and subscription of ApsaraMQ for RocketMQ. |
|
|
Application diagnostics | ||
Displays the number of occurrences, name, related API, and summary of each exception in an aggregated manner. |
|
|
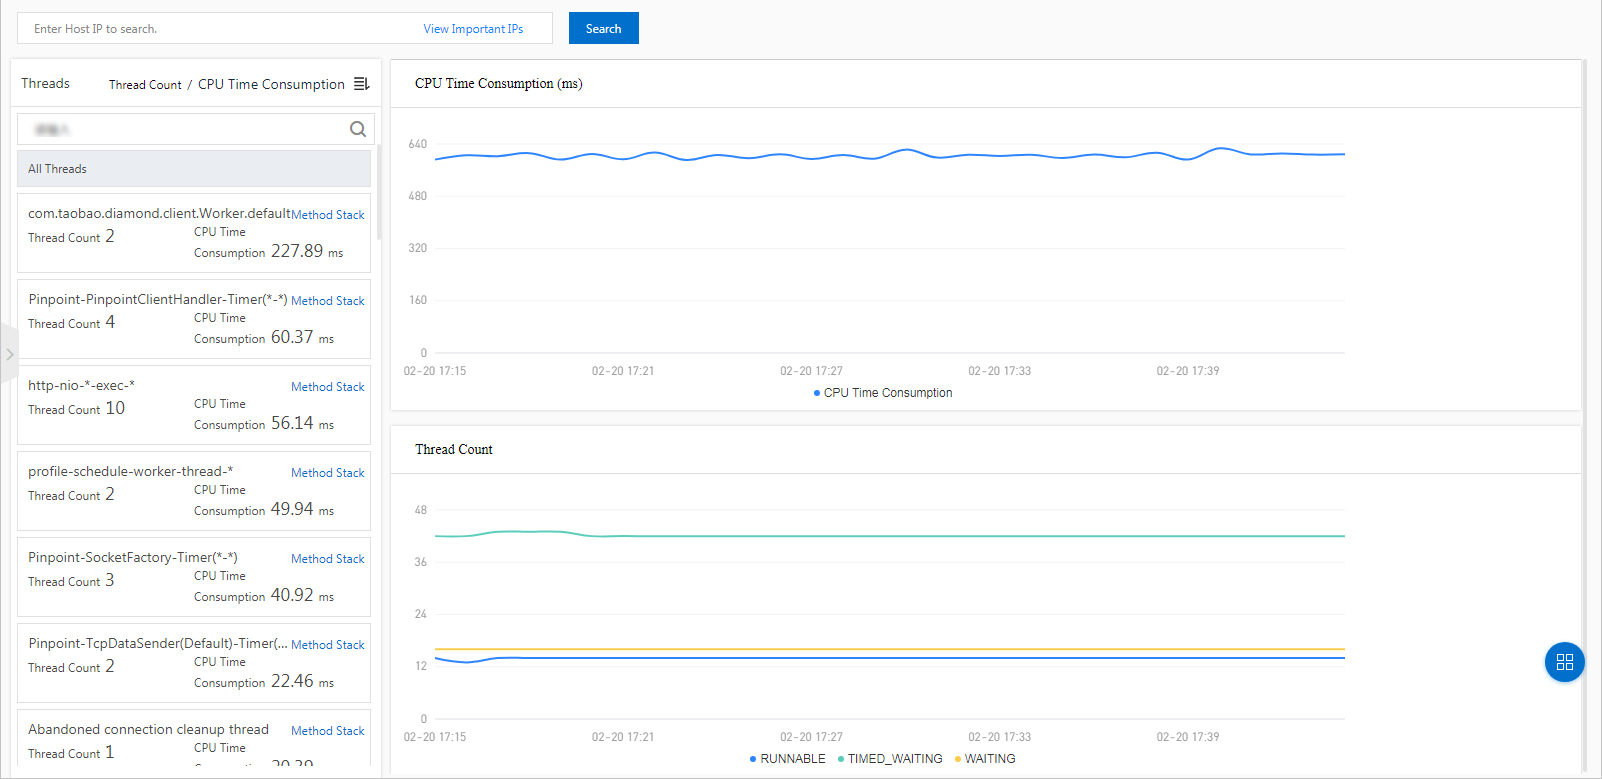
Displays the thread-specific statistics of CPU time consumption and the number of threads for each type. This feature records and aggregates the method stacks of threads every 5 minutes to simulate the code execution process. |
|
|
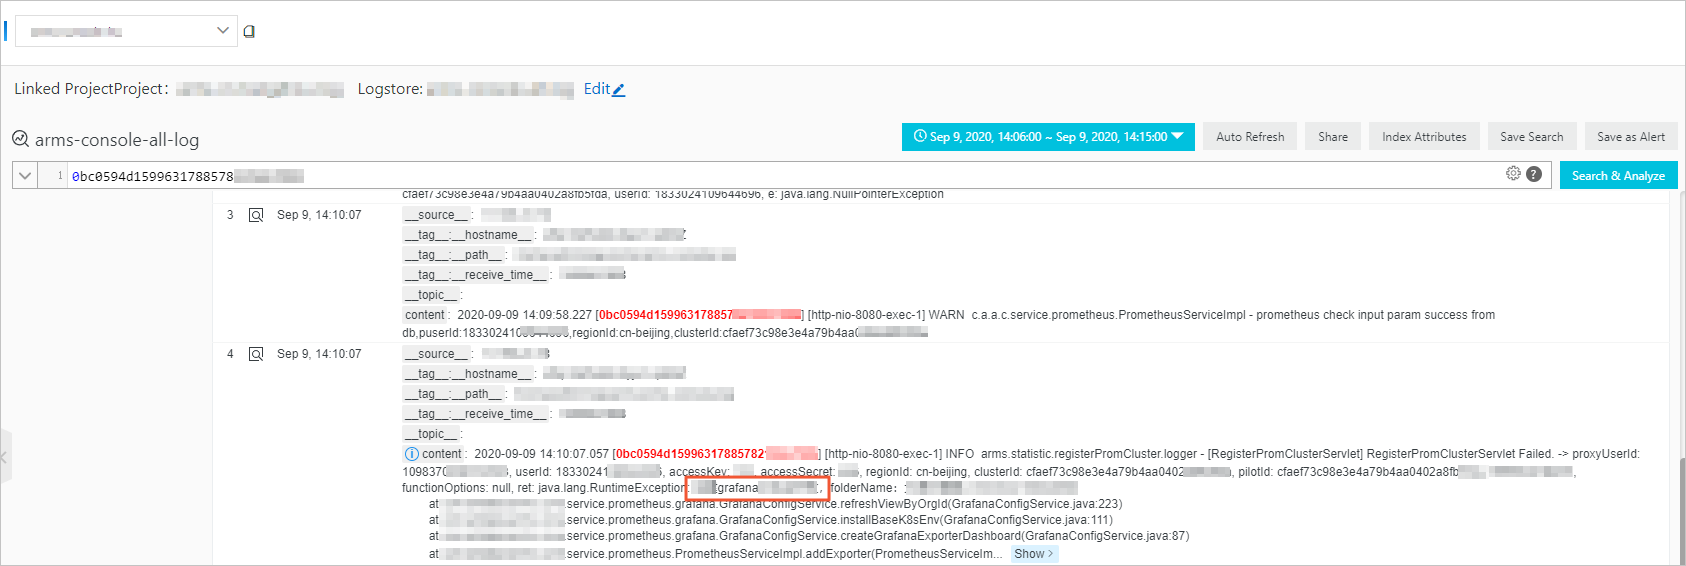
Log analysis (Simple Log Service) Analyzes logs to accurately identify the exceptions of your application.
|
|
|
Helps developers diagnose issues in the production environment of Java applications. Arthas utilizes bytecode enhancement to allow developers to check the application status without restarting running Java virtual machine (JVM) processes. |
|
|
Application settings | ||
Agent installation and application deletion Provides multiple methods to install the agent and allows you to easily delete applications. |
|
|
Trace sampling rate and agent switch configurations Allows you to set the trace sampling rate, agent switch, thresholds, and filtering rules for invalid API calls. |
|
|
Trace ID association with business logs Associates trace IDs with the business logs of an application. This way, when an error occurs in your application, you can access the business logs associated with trace IDs to troubleshoot the error. |
|
|
Trace query | ||
Query of distributed traces and local method stacks Allows you to query and view the distributed trace and local call method stack with respect to dimensions such as the call type, response time, application name, IP address, and API. |
|
|
Alerts and dashboards | ||
Application Monitoring alert rules Allows you to configure alert rules based on the metrics of Application Monitoring. |
|
|
Creation of custom Grafana dashboards based on Application Monitoring metrics Allows you to configure interactive dashboards based on specific requirements for Application Monitoring. |
|
|
Supported agents | ||
Support for multiple third-party Java components and frameworks Supports Tomcat, Jetty, Spring Boot, Dubbo, High-Speed Service Framework (HSF), HttpClient, MySQL, Oracle, and all Alibaba Cloud middleware services. |
|
|
API calls | ||
List of operations by function Allows you to obtain application monitoring results by calling API operations. |
|
|
Retention policy for monitoring data | ||
Displays the retention period of time series data, such as transactions per second (TPS) and response time, that is generated when you call applications to perform query and statistical operations. | 3 days | 90 days |
Displays the retention period of detailed data, such as distributed call stacks, that is generated when you call applications to perform query and diagnostic operations. | 1 day | 30 days |
Activation | Activate Basic Edition | Activate |
