You can integrate an Application Monitoring data source of Application Real-Time Monitoring Service (ARMS) and the dashboard into a workspace of Alibaba Cloud Managed Service for Grafana, and re-create a custom dashboard in the workspace based on your business requirements.
Prerequisites
The ARMS agent is installed for your application. For more information, see Application Monitoring overview.
A workspace is created. For more information, see Create and manage a Grafana workspace.
Managed Service for Grafana Pro Edition or Advanced Edition is used. Workspaces of Managed Service for Grafana Shared Edition do not support dashboard editing. To create a custom dashboard, you must first create a workspace in the Pro Edition or Advanced Edition. For more information about the billing rules of workspaces in each edition, see Billing rules.
Background information
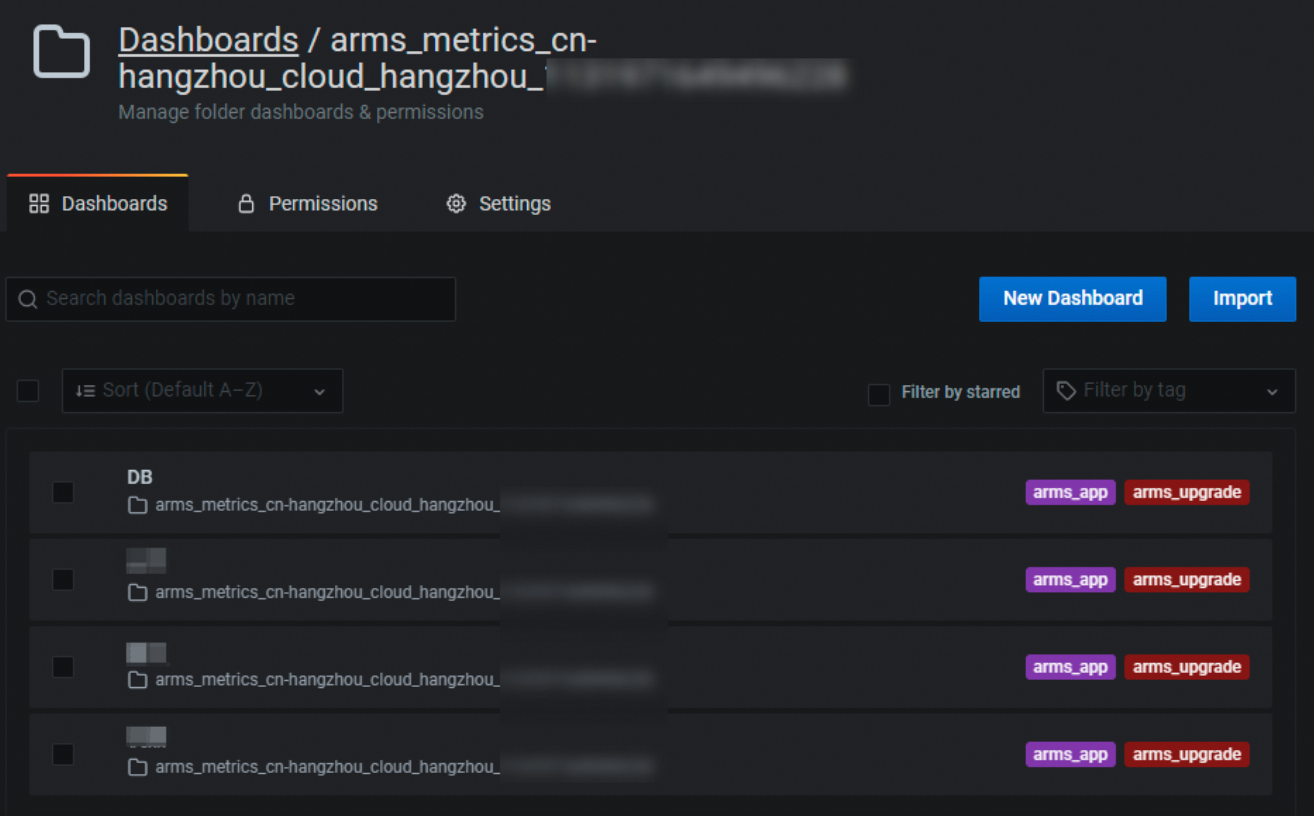
Application Monitoring automatically creates a free Prometheus instance in the region where your application is deployed. As shown in the following figure, all metrics of your application monitored in the China (Hangzhou) region are stored in the Prometheus instance named arms_metrics_cn-hangzhou_cloud_hangzhou. For more information, see Use Managed Service for Prometheus to obtain application monitoring data.

In some scenarios, Application Monitoring metrics are required. Examples:
You want to re-create a dashboard based on the Application Monitoring metrics.
In daily O&M, you want to combine the Application Monitoring metrics with the metrics of other data sources to create a dedicated dashboard.
In the beginning of peak hours, you want to combine the Application Monitoring metrics with the metrics of upstream services or downstream services to create a dedicated dashboard.
Step 1: Integrate an Application Monitoring data source
Log on to the ARMS console.
In the left-side navigation pane, choose . On the Workspace Management page, click the workspace ID.
On the Workspace Information page, click Application Monitoring Service in the Cloud Service Integration section. Find the Prometheus instance in the destination region and click Integrations in the Actions column.
In the message that appears, click OK.
After the synchronization is complete, click Folder in the Actions column.
On the Dashboards tab of the page that appears, click a dashboard name to view the preset Application Monitoring dashboard.

Step 2: Create a custom dashboard
If the preset dashboard cannot meet your requirements, you can modify the dashboard or create a new dashboard.
In this example, Grafana 10.0.X is used. For other versions, the procedure is similar.
Add a panel: Click the
 icon in the upper-right corner.
Create a dashboard: In the left-side navigation pane, choose
 > Dashboard. On the New dashboard page, click Add an empty panel.
In the Query section of the Edit Panel page, select the data source that you synchronized in Step 1.
ImportantMake sure that data is available in the current data source.
In the A section, enter a query statement.
Method 1:
In Code mode, enter a PromQL statement on the right side of Metrics browser. For more information about PromQL statements, see Prometheus documentation.

Method 2
In Builder mode, select a metric from the Metric drop-down list, such as
arms_jvm_threads_count, to query the number of JVM threads. For information about the metrics supported by Application Monitoring, see Application monitoring metrics.In the Label filters section, specify a label and a value.

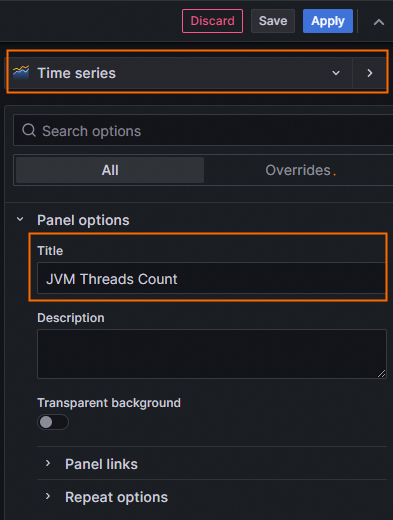
On the right-side Panel tab, set the title of the panel and select chart types.
NoteYou can select multiple chart types for a metric to obtain charts with different granularities.

In the upper-right corner of the dashboard, click Apply.
References
You can configure alerting for one or more interfaces. This way, alert notifications are sent to the O&M team when exceptions occur. For more information, see Alert rules.
For information about how to import Application Monitoring data from Managed Service for Prometheus to a local Grafana system, see Integrate Prometheus monitoring data with a local Grafana system.