This topic describes how to view the exception analysis of an application.
Prerequisite
Your application is monitored by Application Monitoring. For more information, see Application Monitoring overview.
Go to the Exceptions Diagnosis page
Log on to the ARMS console. In the left-side navigation pane, choose .
On the Application List page, select a region in the top navigation bar and click the name of the application that you want to manage.
NoteIcons displayed in the Language column indicate languages in which applications are written.
 : Java application
 : Go application
 : Python application
Hyphen (-): application monitored in Managed Service for OpenTelemetry.
In the left-side navigation pane, choose .
On the page that appears, set the time range and click the exception that you want to view.

Number of exceptions
The Exceptions section displays the number of times the exception is thrown during the specified time range.
In the Exceptions section, you can:
Move the cursor over the statistics chart to view the details.
Select a time range to view the statistics for the specified range.
List of operations that throw an exception
This list displays the information about the operations that throw an exception, including the operation name, exception summary, number of times that an exception is thrown, and proportion of the exception in each operation.
In the list, you can:
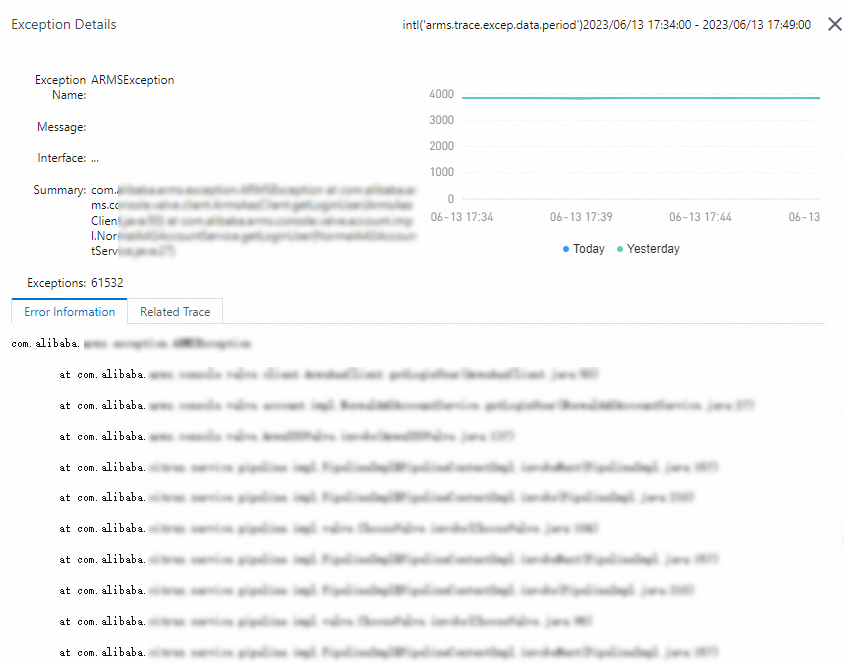
Click the name of an exception in the Exception Name column to view its details.
On the Error Information tab of the Exception Details panel, you can view the information about the exception stack.

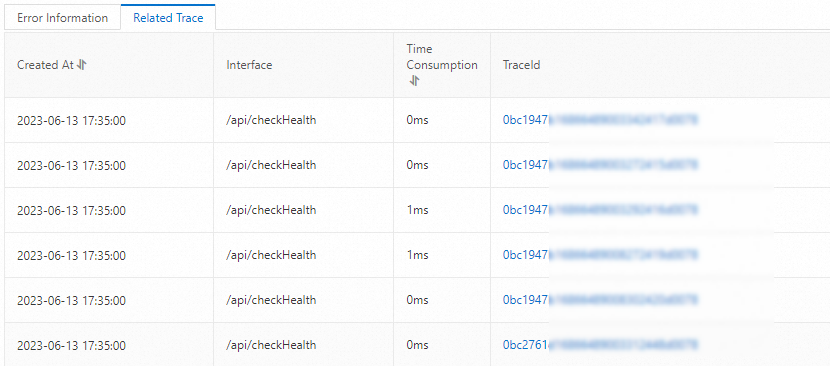
On the Related Trace tab of the Exception Details panel, you can view the information about the exceptions that are captured in the selected operation.

You can also click a trace ID in the TraceId column to view the trace of an exception.
For more information about how to analyze traces, see Trace analysis.
In the Interface column, click the name of an operation to view the information about operation calls. For more information, see Interfaces.