When a service exception occurs, trace data shows *where* the problem happened but not *why*. By linking your application's business logs with trace IDs, you can jump from a slow or failed trace directly to the relevant log entries and pinpoint the root cause.
The log analysis feature allows you to analyze logs collected by Simple Log Service (SLS) or Application Real-Time Monitoring Service (ARMS). This topic describes how to analyze the logs collected by SLS. After you associate a Logstore with your ARMS application, the Log Analysis page lets you search and filter logs in the context of specific traces.
How it works
Your application writes business logs to an SLS Logstore.
You enable the Link Business Logs with TraceId toggle in ARMS, select the region where the SLS project resides, and associate the project with the Logstore.
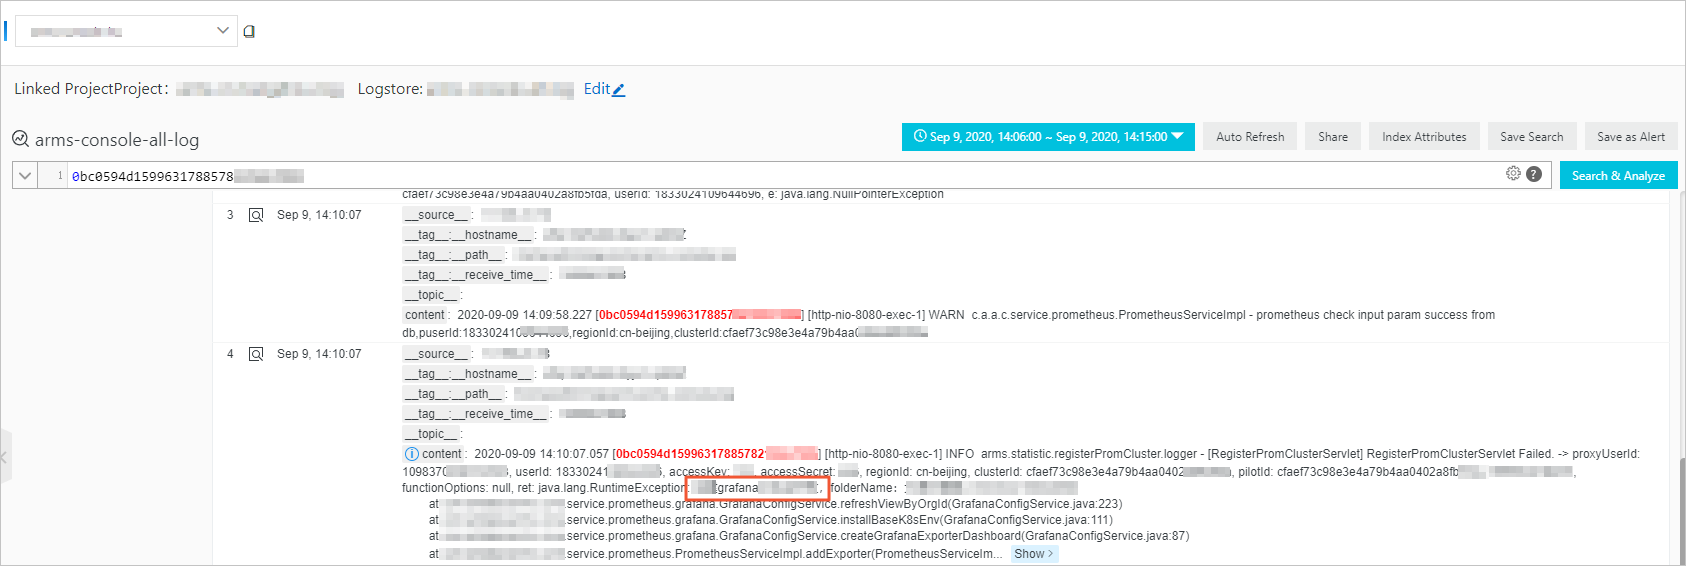
On the Log Analysis page, you search logs by keyword, trace ID, or analytic expression and view results correlated with trace data.
Prerequisites
Before you begin, make sure that you have:
An application monitored by ARMS. See Application Monitoring overview
An activated SLS instance. Log on to the Simple Log Service console to activate SLS
An SLS project
A Logstore in the project
Trace data collected and imported to SLS. See Data collection overview
Associate business logs with trace IDs
Log on to the ARMS console. In the left-side navigation pane, choose .
On the Application List page, select a region in the top navigation bar and click the application name.
NoteIf the
 icon appears in the Language column, the application is connected to Application Monitoring. A hyphen (-) indicates the application is connected to Managed Service for OpenTelemetry.
In the left-side navigation pane, click Application Settings, then click the Custom Configuration tab.
In the Log Collect Configuration section, turn on Link Business Logs with TraceId. Select the region where the SLS project resides and associate the project with the Logstore.
Click Save in the lower-left corner of the Custom Configuration tab.
Query and analyze logs
Log on to the ARMS console. In the left-side navigation pane, choose .
On the Application List page, select a region in the top navigation bar and click the application name.
NoteIf the
icon appears in the Language column, the application is connected to Application Monitoring. A hyphen (-) indicates the application is connected to Managed Service for OpenTelemetry.In the left-side navigation pane, choose .
Enter a query statement in the search box. A query uses the format
Search statement | Analytic statement. For example: For the full query syntax, see Search syntax and Function overview.Goal Query example Filter by keyword errorCombine a search with analytics error | SELECT COUNT(*) AS cntSet a time range. You can specify the start time and end time in hours or accurate to the second. You can also set a time length without specifying the start time or end time.
NoteQuery results may include logs generated up to 1 minute before or after the specified time range.
Click Search & Analyze to view the results.
What's next
Associate trace IDs with business logs -- Learn how to inject trace IDs into your Java application's log output so that each log entry is automatically linked to the originating trace.