Due to the demands of digital transformation and the influence of Internet architecture implementation, existing systems are increasingly using Microservices architectures. We are now enjoying the benefits of Microservices, such as high development efficiency, independent deployment, horizontal scaling, and failure and resource isolation. However, Microservices also cause difficulties in testing, transactions, application monitoring, and more.

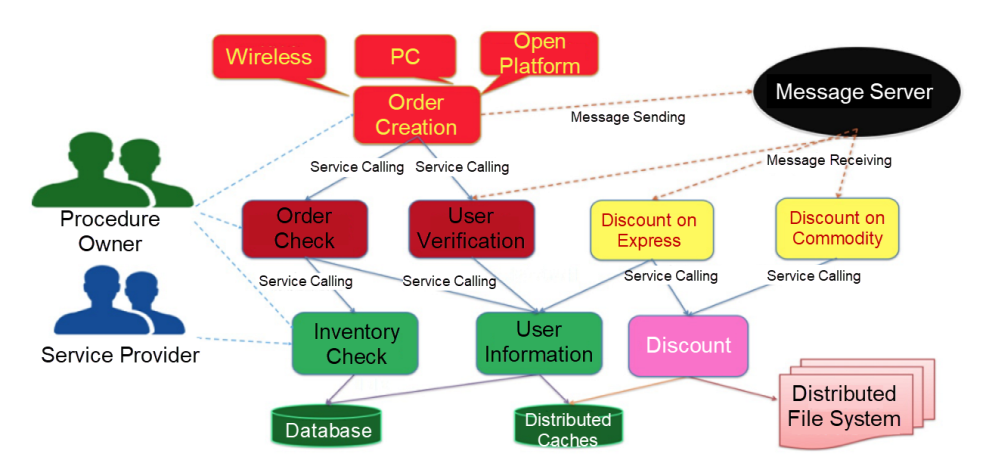
As shown in the preceding figure, in the distributed Internet architecture, the calls between applications are becoming more complex. Traditionally, development engineers take the initiative in event tracking. O&M personnel check logs on the host, combine the call chains, and monitor the application operations. The procedure is now increasingly insufficient.
Many excellent Application Performance Management (APM) tools are emerged to better monitor the performance at the application layer. They can monitor infrastructure data of application running environments, system business calls, and performance consumption. They support quick locating and problem solving in performance exceptions and failure.
These APM tools provide metric statistics and trace information of call chains.
APM tools include metrics collection and call chain collection. Metrics collection collects requests, exceptions, errors, and response time (RT) in a period of time. It also covers resource usage in the IaaS layer, such as CPU, memory, I/O, load, and network, and various JVM running parameters, such as the memory partitions and garbage collections (GC). Call chain collection collects applications, classes, and methods accessed in business requests and time consumed by each running node and method.
Common APM tools include:
Although these APM tools have different functions and implementations, their principles are nearly the same. Based on the Google Dapper paper about distributed tracing, the implementation of APM tools generally includes two parts:
1. Event tracking of applications is carried out on application running nodes to generate tracking data during business operation.

2. Corresponding processing results are persisted through log collection, data cleansing, and aggregation of APM backend services. Various visual consoles are also provided.

In the technology of call chain tracing, restoring the call chain mainly depends on two IDs:
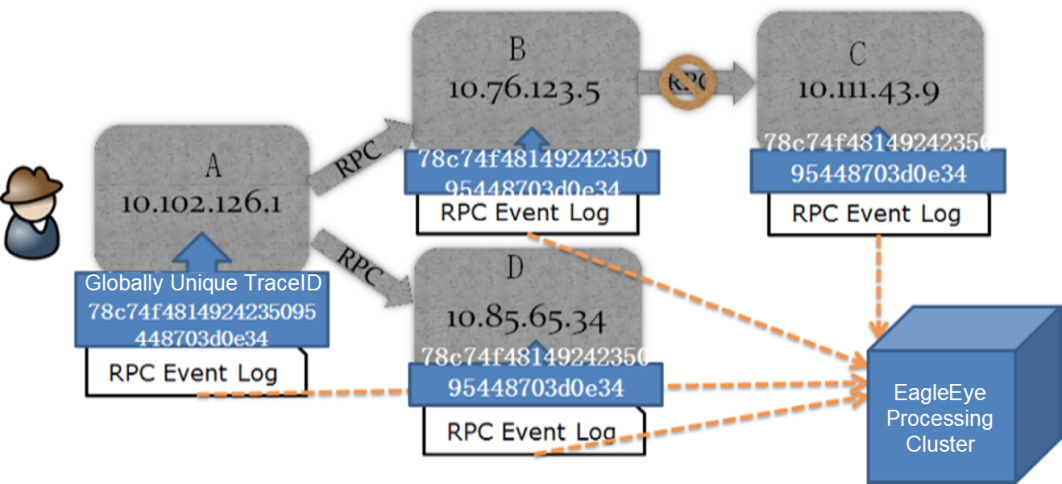
The first ID is the TraceID, which represents a business call. This is just like the payment initiated in the e-commerce system, the course selection process in online education, and package collection in the logistics system. The process from client triggering to response result returning of the business is a complete request and a business call. Each complete request will obtain the specific TraceID.
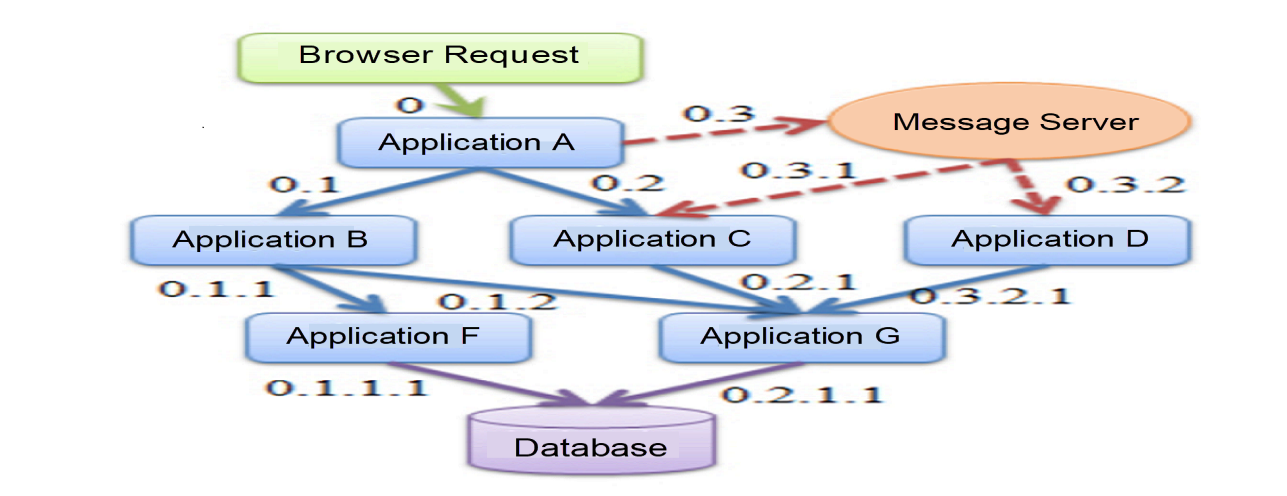
The second ID is the RpcID or SpanID. A business request may pass through many applications. Let's take an e-commerce order as an example. Firstly, the order system creates an order. Secondly, the payment system accepts the payment. Thirdly, the inventory system deducts the product inventory. Fourthly, the membership system processes the points for the buyer. Finally, the shopping cart system cleans up the shopping list. In this process, a hierarchical RpcID is set for each application that the request passes through. The RpcID can be considered to be recorded by the directory hierarchy. Even if the RpcID is called multiple times in the same business, it is the same RpcID at every entrance of the business.
If you rely on TraceID and RpcID, the entire call chain can be restored easily.

Objectively speaking, there is little difference in basic functions among excellent APM tools. For example, open-source APM was weak at automatic event tracking. Now, it has followed up with products, such as ARMS. In terms of support for asynchronous products, such as various Message Queue (MQ), open-source APM is also gradually becoming better. The features of SQL/API parameter capturing are no longer insufficient. The advantages of ARMS are listed below:
1. Metric Data Accuracy
The ARMS agent collects and analyzes metric data and call chain data separately. The corresponding metric data is not affected by the sampling rate of the call chain. Metric data is accurately uploaded to the ARMS backend after statistics of specific running nodes are completed. Some excellent APM tools sample the call chain and then produce corresponding metrics, which may lead to some inaccuracies.
2. Thread Stack Capture
The principle of Java's automatic event tracking is to strengthen the bytecode of known frameworks. Therefore, when a framework is not supported, this access information will not be recorded. ARMS can capture the entire thread stack after the call duration exceeds the specified set value. This way, the analyzed thread stack can be used for supplementary positioning.
3. Thread Analysis
Through the thread analysis tab, ARMS can view the resource usage of each thread. For example, it can know the number of threads in a thread pool, the thread that occupies the most CPU resources, the occupancy percentage of each thread, and the running status of the threads.
4. Associated Business Logs
ARMS works with traditional technologies, such as Log4j, to output business logs and corresponding TraceID simultaneously. To do so, ARMS needs to configure TraceID like configuring Thread ID. In addition, by integrating ARMS with Alibaba Cloud SLS, the ARMS page can find the associated business logs based on the TraceID of the call chain easily. Thus, it is more convenient and practical when business logs are needed for locating.
5. Intelligent Merging
For the same call, such as recursion, the loop is intelligently merged by ARMS. It also displays the number of loops and the maximum, minimum, and average execution duration.

6. Active Diagnosis
ARMS provides an active diagnosis. A specific time point can be selected to perform active diagnosis. ARMS analyzes the running status of applications during this time, summarizes the problems automatically, and produces specific reports based on Alibaba's experience. Through these reports, the positioning and optimization can be accelerated.
7. Rich Alert Rules
ARMS provides a wide range of alert rules. Relative rules can be enabled, disabled, and edited to build an alert system quickly. In alert channels, ARMS supports direct connections to DingTalk, WebHook, Email, and SMS gateways.
1. Management of On-Demand Start, Stop, and Monitoring
Through the ARMS console, we can manage the start and stop of the applications in batch. We can stop all the ARMS monitoring with one click or start monitoring for relative application. This is in line with the concept of on-demand usage on the cloud.
2. Change in Dynamic Sampling Rate
When faced with special time points or the exception rate, we can dynamically adjust the sampling rate. For example, the sample rate can be increased to capture low-frequency call chains. With the configuration management of ARMS, we can collect a more complete set of call chains very conveniently and ensure the reasonable use of the storage space by reducing the sampling rate. When changing the sampling rate, other APM tools need to reconfigure and restart the application. It is troublesome and will affect the continuity of the business. In real-world operations, users are unlikely to stop the business to change the sampling rate during business operation.
3. Switch for Parameter Binding
Many APM tools can provide the function of binding parameters. However, in most cases, a system that is sensitive to business data does not need APM tools to collect SQL/API running parameters all the time. Therefore, this function that ARMS provides in its configuration management is of great significance. When it is necessary to collect these running business parameters for problem locating and analysis, we can open the switch and turn it off after use. Thus, the business data can be prevented from leakage.
4. Easy Access
ARMS can be accessed with YAML annotations or buttons. Access from ACK, EDAS, and SAE are all supported.
5. O&M-Free and Stable Components
ARMS is a commercial product, so no O&M of all components is required for users. For those self-built open-source components, O&M is necessary for log collection, cleansing service, and storage, including cluster size, cleansing, and scale-out. If the resources are not recycled after the peaks, additional waste will occur.
Note: The unit price is different in different regions due to the regional costs. For more information, please see www.alibabacloud.com/product/arms
The following chart is a comparison between open-source APM tools and ARMS:
| Number of Client Nodes | Requests per Day | Machine Configuration | |
| Micro Customers | 50 | 30 million | 1 es (4c16G500GB hard disk) 1 colector (4c8G) |
| Small Customers | 100 | 70 million | 1 es (8c16G500GB hard disk) 1 colector (4c8G) |
| Medium-Sized Customers | 300 | 250 million | 2 es (8c16G500GB hard disk) 3 colectors (4c8G) |
| Large Customers | 500 | 500 million | 4 es (8c16G500GB ssd hard disk) 5 colectors (4c8G) |
| Super Customers | 1,000 | 1 billion | 7 es (8c16G500GB ssd hard disk) 8 colectors (4c8G) |
Note: 4c means 4 cores and 16G means 16-GB memory.
ARMS provides rich functions at the APM layer, which allows friendly O&M operations. In addition, it is efficient and cost-effective when used on-demand in containers together with resource packages. ARMS is used as a practical monitoring tool for infrastructures. It does not involve repeated works and human resource investment. Many customers choose ARMS after considering all the factors comprehensively.

212 posts | 13 followers
FollowAlibaba Cloud Native Community - March 18, 2025
Alibaba Cloud Native Community - February 2, 2026
Alibaba Cloud Native Community - February 9, 2026
Alibaba Cloud Native Community - July 22, 2022
Alibaba Cloud Native Community - July 26, 2022
Aliware - July 22, 2021

212 posts | 13 followers
Follow Microservices Engine (MSE)
MSE provides a fully managed registration and configuration center, and gateway and microservices governance capabilities.
Learn More ACK One
Provides a control plane to allow users to manage Kubernetes clusters that run based on different infrastructure resources
Learn More Container Service for Kubernetes
Alibaba Cloud Container Service for Kubernetes is a fully managed cloud container management service that supports native Kubernetes and integrates with other Alibaba Cloud products.
Learn More Container Registry
A secure image hosting platform providing containerized image lifecycle management
Learn MoreMore Posts by Alibaba Cloud Native