By Shanlie, Alibaba Cloud Solution Architect
As reported by the "Research Report on Chinese Children’s Programming Industry" and the "Analysis and Forecast Report on Chinese Children’s Programming Market for 2017-2023", programming among children is so promising that it is expected to reach up to RMB 50 billion within 3-5 years.
In today's information age, artificial intelligence has brought many changes to society. Parents in the Internet era are different from parents of the previous generations. They pay more attention to children's quality education and their competencies in artificial intelligence. Therefore, children’s programming education has developed rapidly.
Walnut Programming has taken the lead in the children’s programming education industry. It is committed to promoting programming education through science and technologies. It also aims to inspire Chinese children to learn through advanced technologies and scientific educational strategies, such as artificial intelligence and adaptive learning. Since August 2017, Walnut Programming has enjoyed rapid business development, with the number of paid students exceeding 2 million and the monthly revenue exceeding RMB 100 million within three years.
With the rapid growth of the Walnut Programming business, the system scale and complexity of core applications are also undergoing many changes. The Walnut Technical Team has been maintaining the technological advancement of the entire system architecture continuously through emerging technologies. Within three years, the Technical Team has had at least six major restructures of the overall system architecture, involving important technologies, such as microservices, containerization, and distributed database. The team has also tried to improve the elastic scalability of the system through Serverless. During the pandemic, Walnut Programming’s system architecture made it through the sudden upsurge in the system workload.
As the system architecture becomes more complex, a long-standing problem in the Internet field has also been presented to Walnut Programming, “How can we improve the observability of a distributed system?” In online programming teaching scenarios, a simple operation by users may involve multiple interactions between the frontend and backend systems and the calls between multiple microservice applications on the server, which may be affected by third-party service interfaces. Any link failure or performance bottleneck will lead to a drastic decline in user experience. As the user experience is the core element of the brand image, there are several requirements that the Walnut Technical Team has to meet during system observability construction to guarantee an excellent user experience:
It is very difficult for any Technical Team to build a distributed observability system from scratch centering on these aspects. Fortunately, there are many mature methodologies and open-source projects of distributed observability construction for reference in the industry.
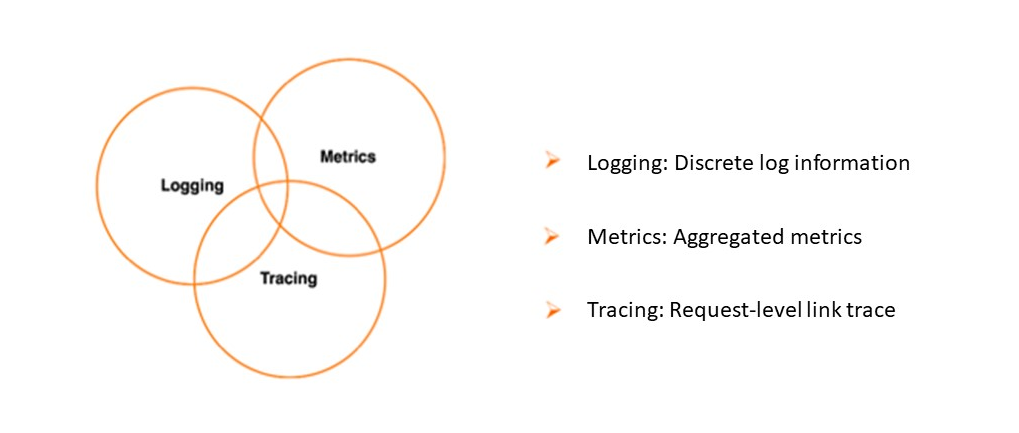
The observability widely recognized by the industry consists of three core elements: Logging (discrete log information), Metrics (aggregated indexes), and Distributed Tracing. Centering on these three core elements, many open-source projects can help developers build a distributed observability system quickly.
The Walnut technical team has established a complete distributed observation system using open-source technologies, such as Skywalking and Prometheus. It can implement full-procedure tracking for complex microservice applications on the server and perform the collection and analysis of business logs through the unified log service system. By doing so, the system stability and user experience can be improved. For any link failures of the system server or performance bottlenecks, you can notify the Technical Team immediately and locate the problem for a quick solution.
Compared with the mature server-side monitoring technology, the technical solutions for client-side monitoring are far from satisfactory in this industry. On the Internet, massive users in different regions log in using terminal devices of different manufacturers, different operating systems, and different screen resolutions through different network operators. In addition, complex third-party dependencies may occur, including CDN, third-party statistical scripts, and page nesting. When problems occur, it is difficult to determine whether the root of the problem lies in the frontend or backend if you are only relying on server-side monitoring. Even with the server-side problems ruled out, further troubleshooting is also challenged since the frontend user experience is also affected by page rendering, JavaScript execution, network quality, and the service quality of third-party interfaces.
You can enable custom tracking through frontend JavaScript to report various end user behaviors to the server in real-time for statistics to know the user experience in real-time. This idea is reasonable, but a lot of work needs to be done in business tracking, data analysis, aggregation analysis, and view presentation, which is a huge project. For most technical teams, it is unrealistic to invest in building a frontend monitoring solution like this.
The best way to build a frontend system with observability is to choose a complete solution provided by a cloud computing vendor. For years, Alibaba has formed a unified frontend monitoring solution available to all internal business departments. For the frontend applications in the form of HTML pages, whether on a PC or mobile website, the HTML5 page embedded in the mobile app can be connected to this frontend monitoring solution in a non-intrusive way.
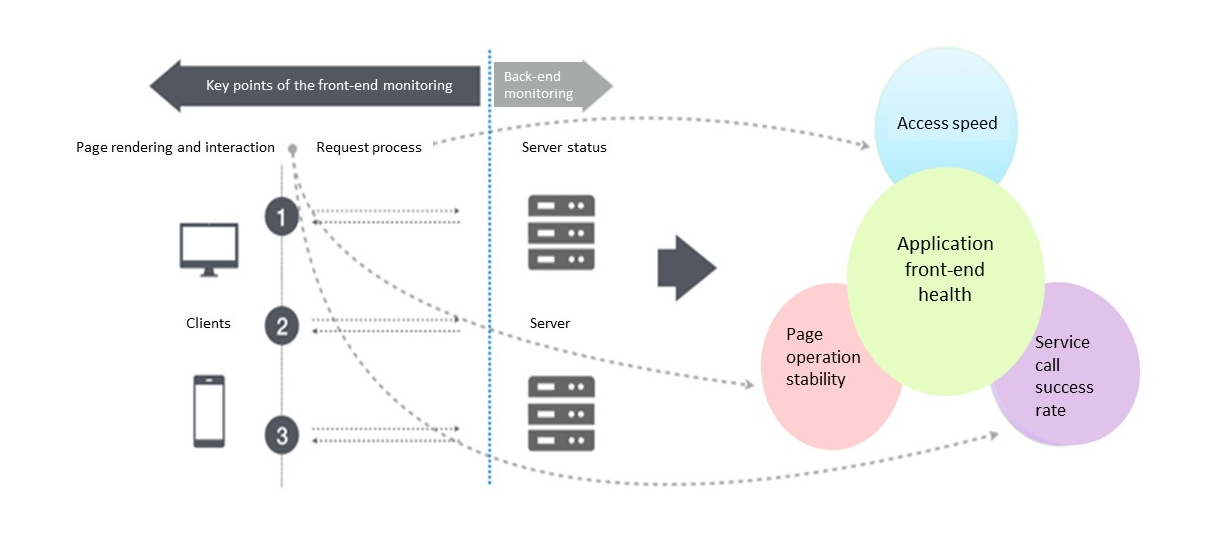
This monitoring solution is also provided externally through Alibaba Cloud. It has become an important part of the overall observability solution of Alibaba Cloud, serving external users.
There are two client-side monitoring products, including ARMS frontend monitoring and APP monitoring. ARMS front-end monitoring focuses on web-based experience data. It monitors the health of web pages, including page loading speed, page stability, and the success rate of external service calls. It helps reduce the page loading time, JS errors, and improves the user experience.

This solution can make up Walnut Programming’s weaknesses in the client-side monitoring. Therefore, the Walnut Technical Team has tried to connect the Alibaba Cloud ARMS frontend monitoring to some businesses. Not long after, the benefits brought by this solution in improving the user experience have gradually shown themselves.
One of the main reasons for Walnut Programming’s preference for ARMS frontend monitoring is that it can be accessed easily. You only need to add a statistics access script (a piece of JavaScript code) provided by ARMS to the Body of the client-side HTML page, and then the monitoring data can be reported automatically. As no active tracking work in the business layer is involved, the promotion of ARMS frontend monitoring goes smoothly among multiple business lines of Walnut Programming. Based on previous experiences, administrative measures are needed in any monitoring solutions that require active tracking in the business layer to ensure multiple R&D teams comply with established rules when writing codes. However, it is very difficult to implement in the long run. Even in full-procedure server-side monitoring, Walnut Programming has always followed the idea of business without intrusions to avoid active tracking.
Next, the R&D Team can comprehensively grasp the end-to-end health of the application from the frontend monitoring console, including PV/UV statistics, page loading speed, JavaScript execution, and API request success rate. Take the page loading speed for an example. ARMS can display the loading status of each page in real-time based on the monitoring data automatically reported by the client-side.
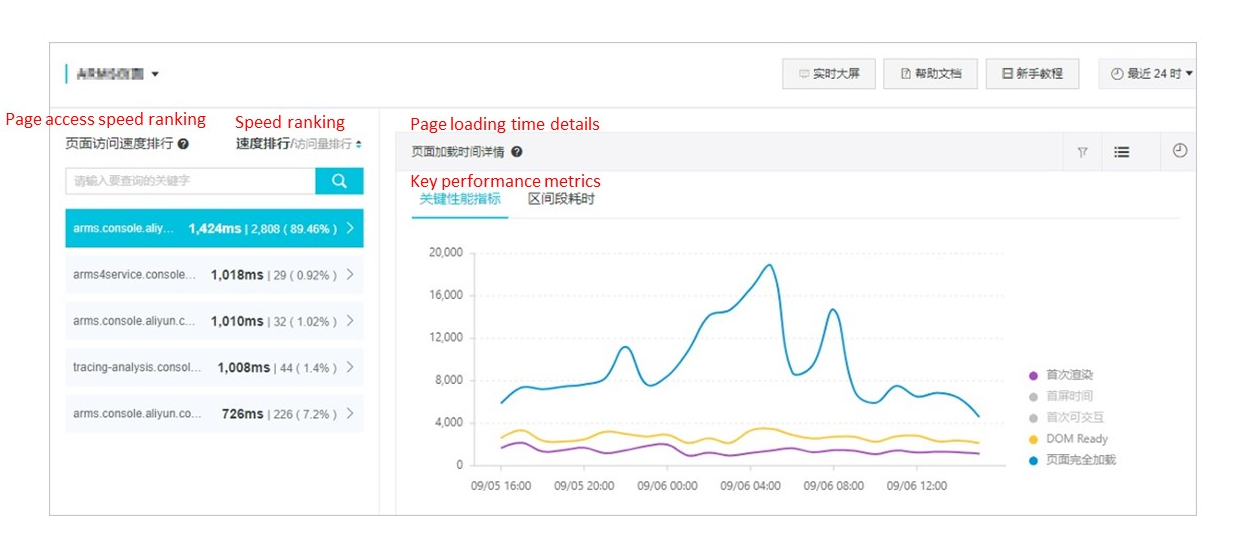
Metrics, such as first paint time, first meaningful paint, and Dom Ready are unique performance metrics of HTML pages, which follow the business metrics definition. These metrics are closely related to the health of the frontend pages and affect the interactions between each end user and the system.
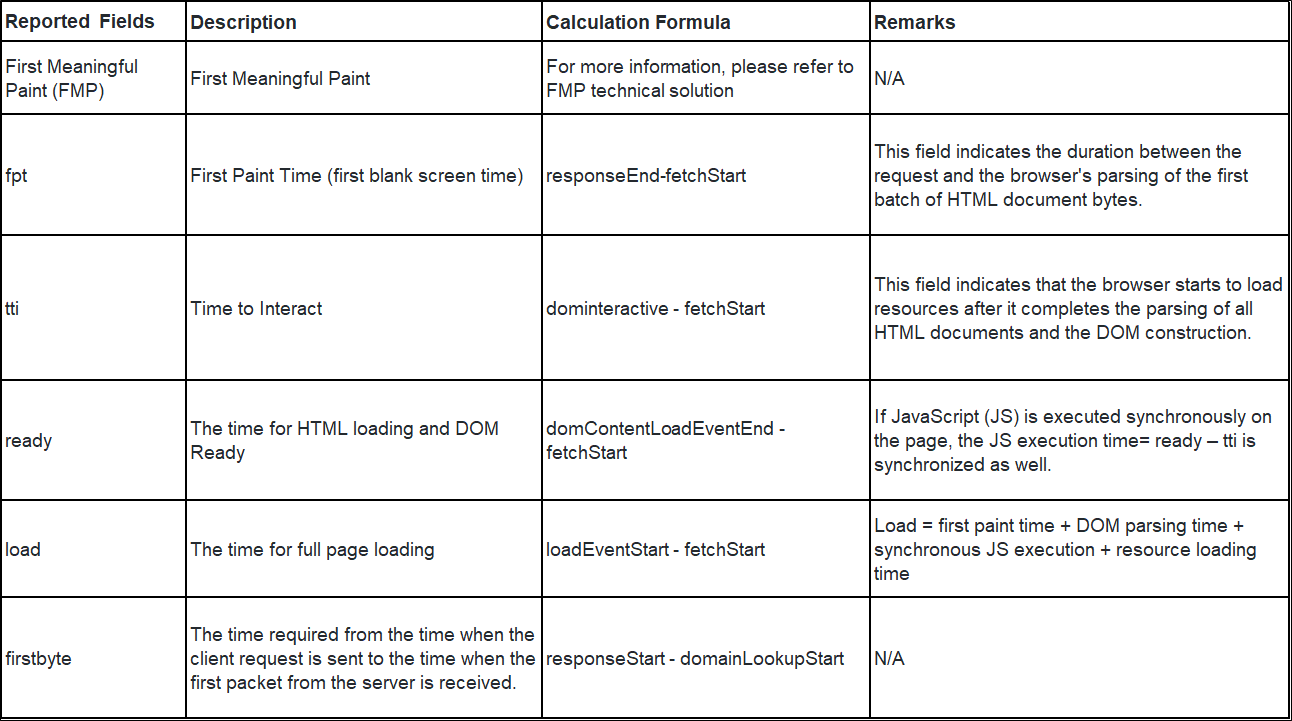
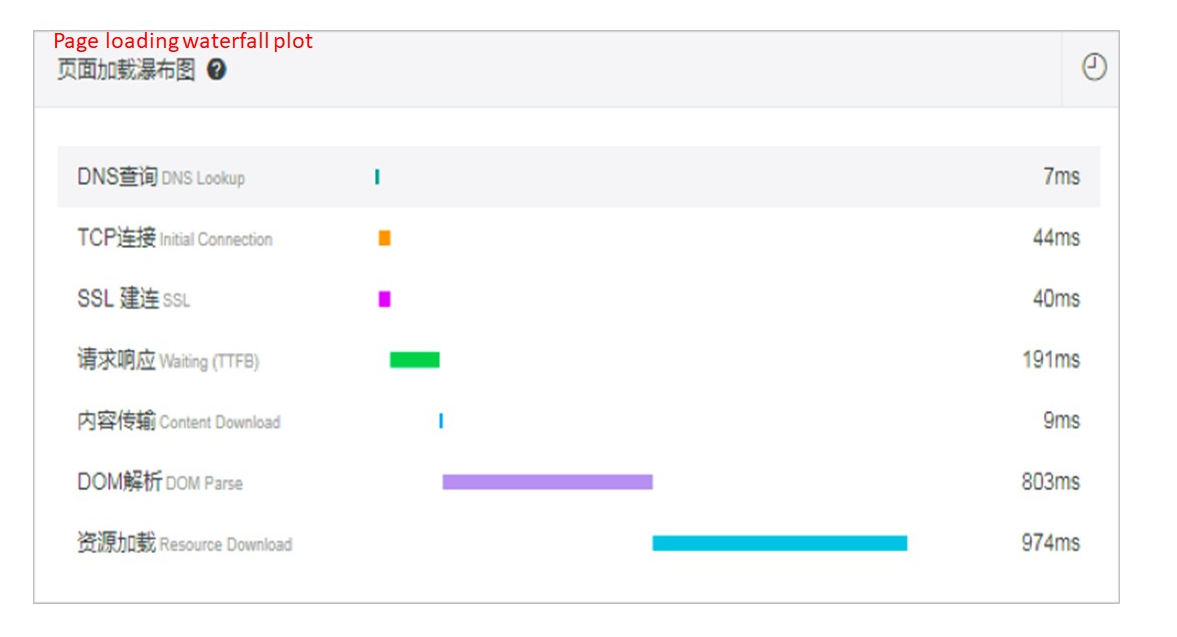
The waterfall plot of page loading shows the response time in each stage based on the page loading order. These metrics include the performance metrics of the network. Performance bottlenecks on the network, for example, the access bandwidth of an application system unable to support the user access traffic, cannot be detected only by server-side monitoring. Instead, the client-side real-time monitoring data is needed to report such bottlenecks. Through ARMS frontend monitoring, Walnut Programming can grasp the end-to-end health of each application system during page production (server-side state), page loading, and page running.
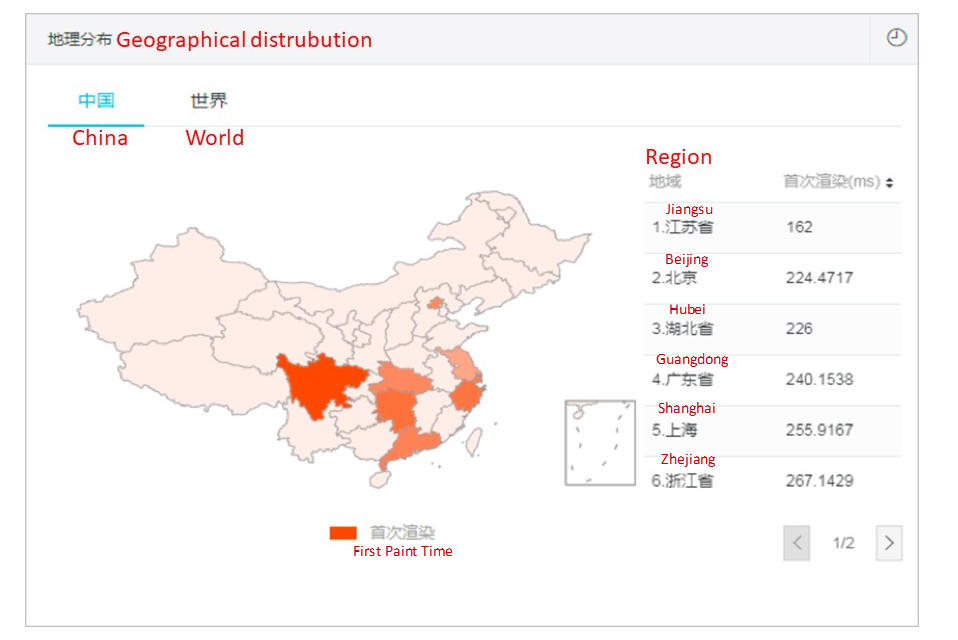
ARMS frontend monitoring can aggregate and analyze performance metrics based on geographic location, browser, operating system, resolution, network operator, and application version to help Walnut Programming better locate performance bottlenecks. For example, the geographical distribution view can show the average first paint time of pages in each province in China through aggregation analysis of geographical locations. When the CDN of a region fails, the geographical distribution view can help Walnut Programming locate the cause of the problem quickly. On the contrary, all these scenarios cannot be implemented by traditional monitoring.
JavaScript error analysis and API request analysis are the two important page health metrics for daily application system maintenance by Walnut Programming. JavaScript error analysis can display the basic information and distribution of JavaScript errors and can backtrack user behaviors. API request analysis provides the calling information of each API, which includes the call success rate, return messages, and average response time of successful or failed calls. When the frontend page is fully loaded, complex JavaScript execution will be involved in the users’ operations, and multiple API calls on the page will be triggered, including interface calls provided by the third parties.
ARMS provides a reproduction of the complete frontend code execution from the end user's point of view and helps Walnut Programming locate the frontend error source quickly. Similar to statistics on page loading speed, JavaScript error analysis, and API request analysis support aggregation analysis based on multiple dimensions, such as the geographical location and browser. In online programming education, the implementation of the client contains a large amount of business logic and two-way interactions between clouds. Some of the problems can only be exposed under specific browser and page resolutions, and multi-dimensional aggregation analysis is especially needed for troubleshooting.
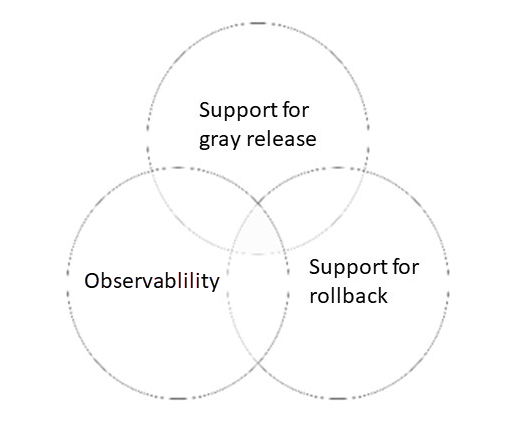
After mastering the frontend observability provided by ARMS, Walnut Programming used the frontend page health metrics as the detection standard for daily business iteration. It is carried out in combination with the gray release plans of all business lines. Each version upgrade of the production environment will be implemented through gray release by Walnut Programming. First, small-scale user traffic is imported into the new version for verifications on functionality, stability, and health. The user traffic imported to the new version will be increased gradually only when the predefined metrics are met. Otherwise, the version is rolled back immediately. Frontend health metrics are very important and cannot be fully collected simply through common tests before releasing the new version. Walnut Programming incorporates the frontend health into the measurement of business iteration, reflecting the grayscale, observability, and rolling back in the process of business iteration. These are also the three widely promoted principles for production safety in Alibaba.
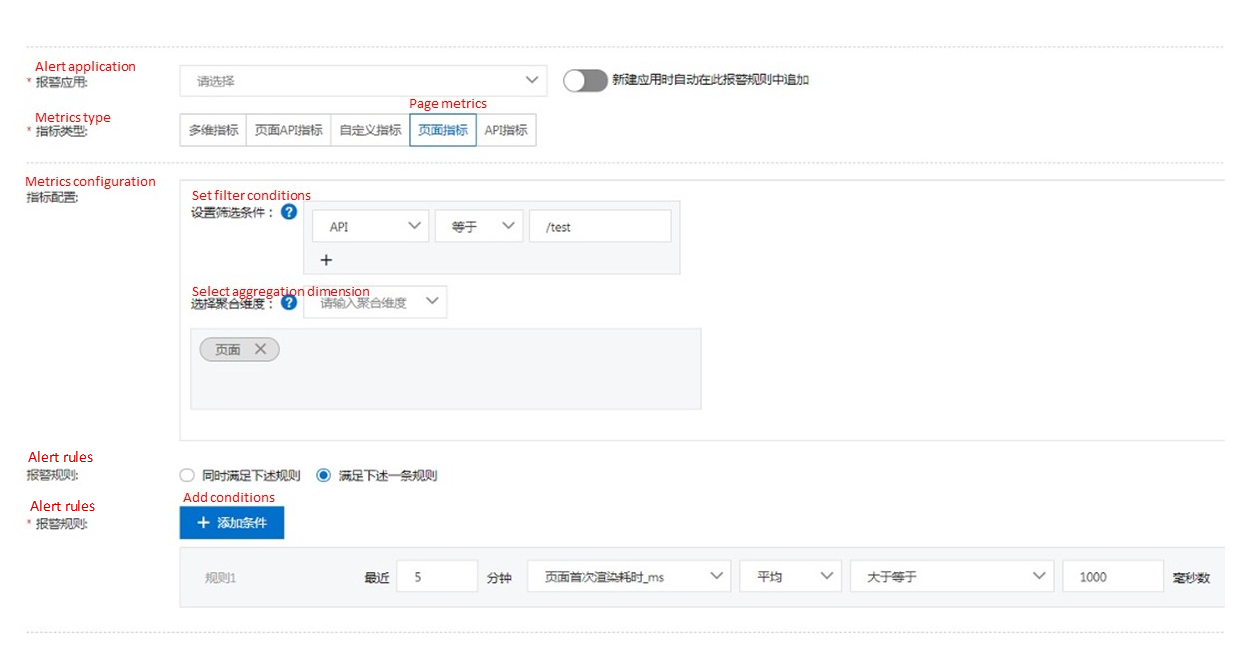
In addition to grasping various frontend service metrics through active observation and analysis in the ARMS console, the more important task is to obtain timely notifications and alerts when user experience problems occur for prevention. This can be implemented easily through the perfected alert mechanism of ARMS. Based on its understanding of frontend health and the industry-wide universal methodology, Walnut Programming has created alarm rules of various dimensions, such as "the average response time for first paint in the last five minutes is greater than one second.” When a rule is triggered, the system sends an alert notification to the specified contact group in the specified alerting mode, informing the technical team to take timely actions to solve the problem. Together with the grading and classification of production failures, these alarm rules can help the Walnut Technical Team establish a complete set of response mechanisms for production failures. By doing so, the online problems can be discovered within 5 minutes, isolated within 10 minutes, and solved within 30 minutes.
Walnut Programming also actively explores the unified procedure tracking technology between the frontend and backend. It connects in series the procedures in which API requests are sent from the frontend and called in the backend and reproduces the complete code execution scenario. This is achieved by automatically injecting Trace information into the frontend API request. When the API automatic report is allowed, ARMS frontend monitoring can add the automatically generated TraceID to the Request Header of the API request as the identifier for connecting the frontend and backend procedures. With the call timeline, it can figure out whether the network transmission or backend call causes too much request time. With the thread profiling function of backend applications, the complete backend call procedure of each request can be examined clearly. This is very helpful for troubleshooting system failures and performance bottlenecks.
The improved frontend system with observability helps reduce the O&M workload of Walnut Programming by over 30% and shortens the average time for failure locating by over 60%. It improves the user experience significantly and lays a solid foundation for sustainable business development. The Walnut Technical Team will continue to explore more cutting-edge cloud-native technologies based on their technical characteristics and the benefits of cloud computing.

212 posts | 13 followers
FollowAlibaba Cloud Native Community - September 4, 2025
Alibaba Cloud Native Community - June 13, 2025
Alibaba Cloud Native - October 9, 2021
Alibaba Cloud Native - September 12, 2024
Alibaba Cloud Native Community - June 4, 2025
Alibaba Cloud Native Community - November 11, 2022

212 posts | 13 followers
Follow Microservices Engine (MSE)
MSE provides a fully managed registration and configuration center, and gateway and microservices governance capabilities.
Learn More Offline Visual Intelligence Software Packages
Offline SDKs for visual production, such as image segmentation, video segmentation, and character recognition, based on deep learning technologies developed by Alibaba Cloud.
Learn More Network Intelligence Service
Self-service network O&M service that features network status visualization and intelligent diagnostics capabilities
Learn More Application Real-Time Monitoring Service
Build business monitoring capabilities with real time response based on frontend monitoring, application monitoring, and custom business monitoring capabilities
Learn MoreMore Posts by Alibaba Cloud Native