By Yingchuan
Prometheus has become the industry standard in the field of observability metrics. Due to various factors, some users still use "self-managed open-source Prometheus, self-managed open-source Thanos, and self-managed Grafana" to implement metric monitoring and alerting for infrastructure and business applications. Alibaba Cloud Managed Service for Prometheus is fully integrated with the open-source Prometheus ecosystem. It supports observations for a wide range of components and provides high-performance, high-availability, high-scalability, low-cost, and easy-to-maintain metric observations. To facilitate migration from self-managed open-source Prometheus to Alibaba Cloud Managed Service for Prometheus, this article describes migration solutions in various typical scenarios.
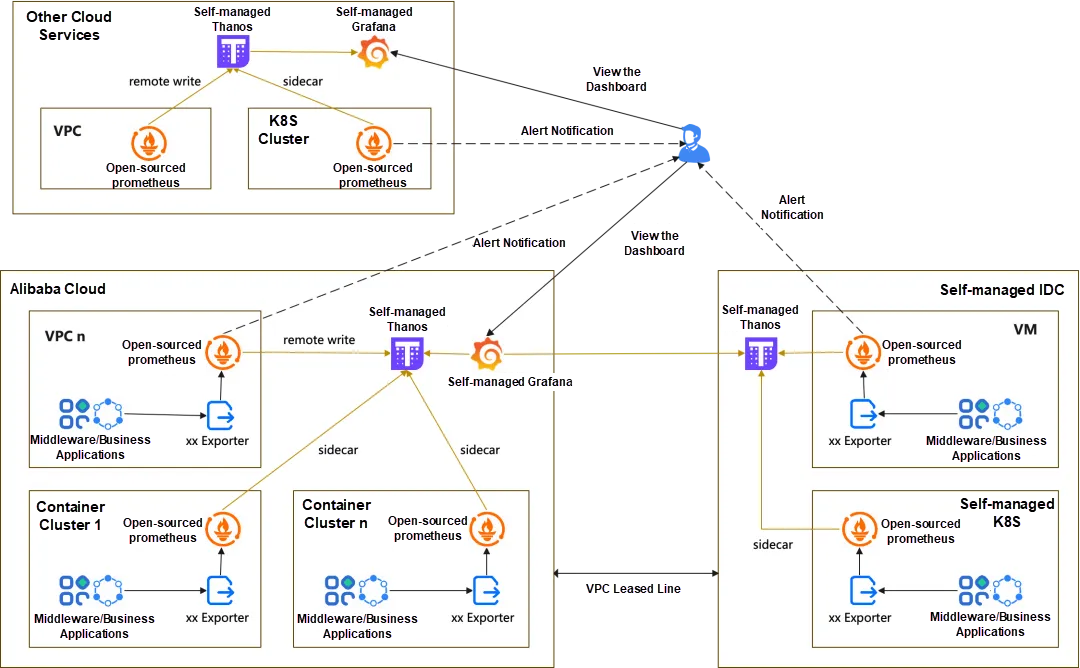
Currently, typical deployment scenarios of self-managed open-source Prometheus and Thanos include:
Open-source Prometheus installed in a Kubernetes cluster:
Open-source Prometheus installed in a non-Kubernetes cluster:
To meet long-term monitoring requirements, users usually deploy one or more sets of self-managed Thanos on the basis of self-managed open-source Prometheus to store multiple self-managed open-source Prometheus datasets in a centralized and long-term manner.
For self-managed open-source Prometheus and Thanos, enterprises usually face the following major problems:
• For various components used in business systems, you need to install the exporter and configure dashboards and alert rules, which is a heavy workload. In addition, the dashboards and alert rules of the open-source Grafana are not professional enough, and the dashboards and alert rules that are optimized based on the principles and best practices of observation components are not available.
• Multiple self-managed open-source Prometheus applications must be installed in different container clusters or VPCs due to different enterprise departments or business systems, resulting in high deployment costs and complex O&M.
• Self-managed open-source Prometheus cannot handle metrics with large traffic when container clusters or ECS instances are on a large scale.
• The introduction of self-managed Thanos for centralized and long-term storage increases the complexity of the entire metric observability system. In addition, Thanos Receiver is required in non-Kubernetes scenarios, which makes the entire Thanos deployment and O&M more complex and costly.
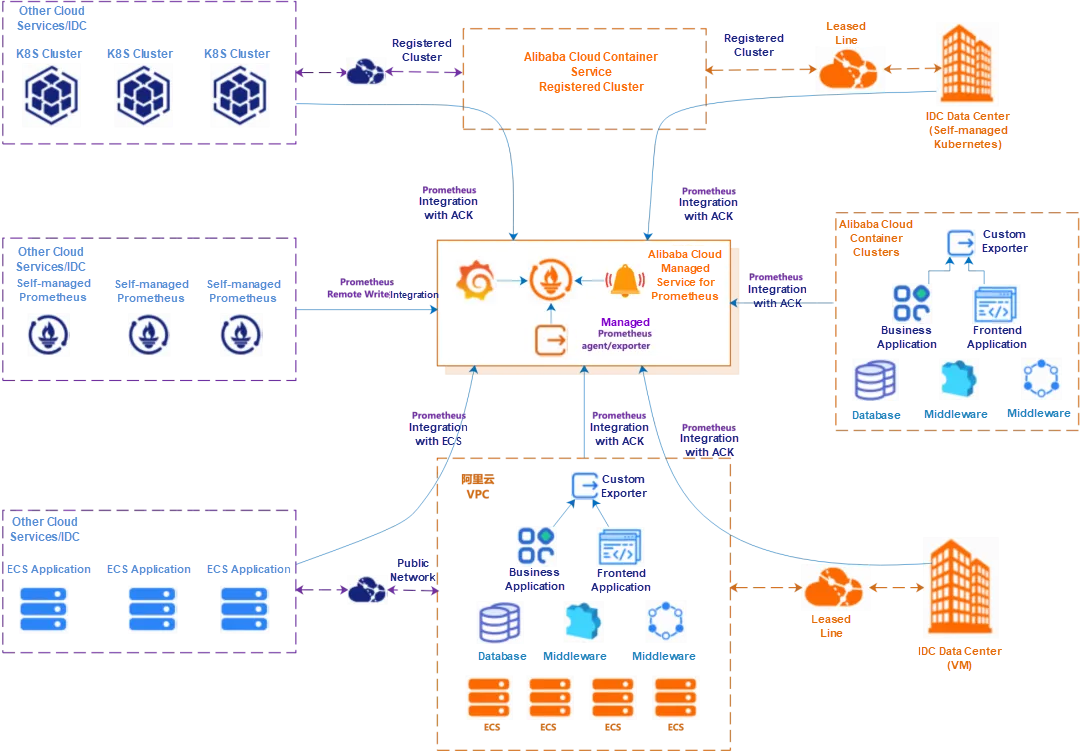
Alibaba Cloud Managed Service for Prometheus is fully integrated with the open-source Prometheus ecosystem. It supports observations for a wide range of components and provides a variety of out-of-the-box preset dashboards and fully managed hybrid cloud and multi-cloud Prometheus services. In addition to supporting Alibaba Cloud Container Service, self-managed Kubernetes, and Remote Write, Alibaba Cloud Managed Service for Prometheus also provides metric observation capabilities for hybrid cloud and multi-cloud ECS applications. It also supports multi-instance aggregated observation capabilities to implement unified query of Prometheus metrics, unified Grafana data sources, and unified alerts.
| Comparison Item | Open-source Prometheus | Alibaba Cloud Managed Service for Prometheus |
|---|---|---|
| Deployment and O&M costs | Prometheus, Grafana, and AlertManager must be deployed on self-paid Elastic Compute Service (ECS) instances in multiple VPCs, multi-container clusters, multi-cloud clusters, and multi-IDC clusters, which requires high deployment and O&M costs. | Prometheus, Grafana, and Alert Center are integrated, fully managed, O&M-free, and out-of-the-box. |
| Availability, performance, data capacity, and retention period | Single node, low collection and query performance, small data capacity, and short retention period. | High availability, high collection and query performance, large data capacity, and long retention period. |
| Components | Manually deploy various open-source exporters, create collection jobs and dashboards, and configure alert rules. | Provide one-click access to common components (automatic deployment of exporter, collection job, and creation of dashboards and alert rules). |
| Grafana dashboard | The open-source Grafana dashboard is usually simple. In most cases, the collected metrics are displayed directly, lacking in-depth optimization based on the principles and best practices of monitoring components. | Professional dashboard templates for common components are provided to help you quickly and accurately understand the running status of components and troubleshoot issues. |
| Alert item | Alert item templates for common components are not available. You must learn and configure alert items by yourself. | Professional and flexible alert item templates based on the monitoring practices of each component are provided. You can configure the core and recommended alert items of each component in a white-screen manner. |
| Global aggregate query | Self-managed Thanos implements "physical aggregation", which has high deployment and O&M costs and low flexibility. | Provide global aggregation instances capability. This feature supports high-performance dynamic aggregation query, dashboard display, and alert of data from multiple Prometheus instances. |
The migration from self-managed open-source Prometheus to Alibaba Cloud Managed Service for Prometheus consists of three phases: metric collection, visualized analysis, and alert configuration. The following sections discuss the solutions for these three phases in different self-managed Prometheus deployment scenarios.
Metric collection means Prometheus regularly pulls and saves metric data from the target monitoring component or its corresponding exporter based on the configuration of the collection job.
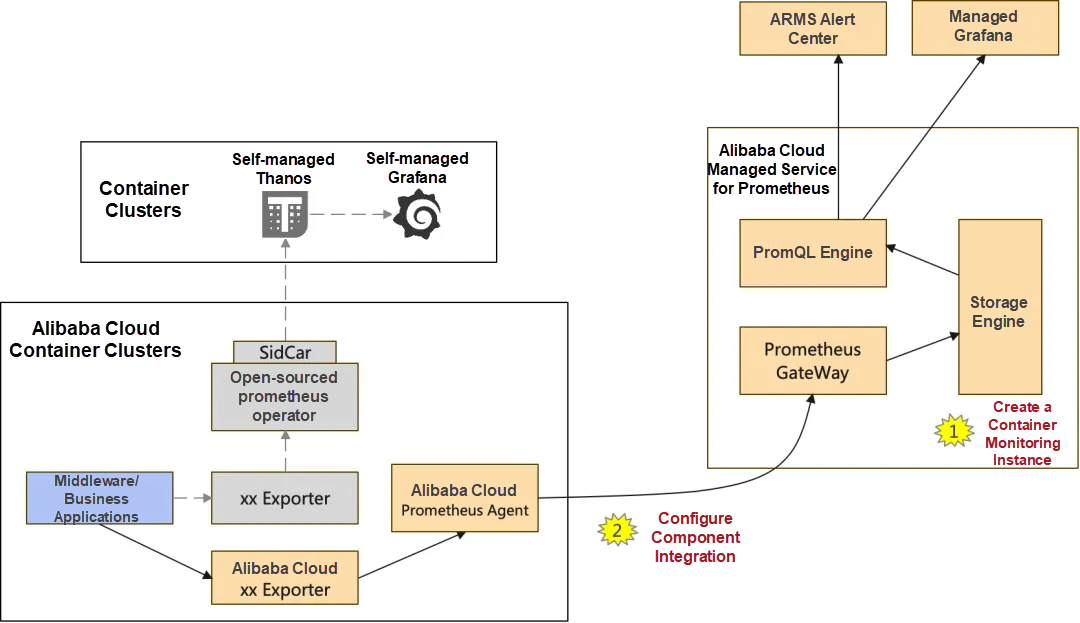
• After Alibaba Cloud Managed Service for Prometheus is configured and verified, the migration can be completed after n days (the number of days for which the existing self-managed open-source Prometheus Service is stored). This way, Alibaba Cloud Managed Service for Prometheus can collect complete monitoring data.
Log on to the console of Alibaba Cloud Managed Service for Prometheus. In the Integration Center, select Kubernetes Cluster Monitor to create the Kubernetes Environment instance.
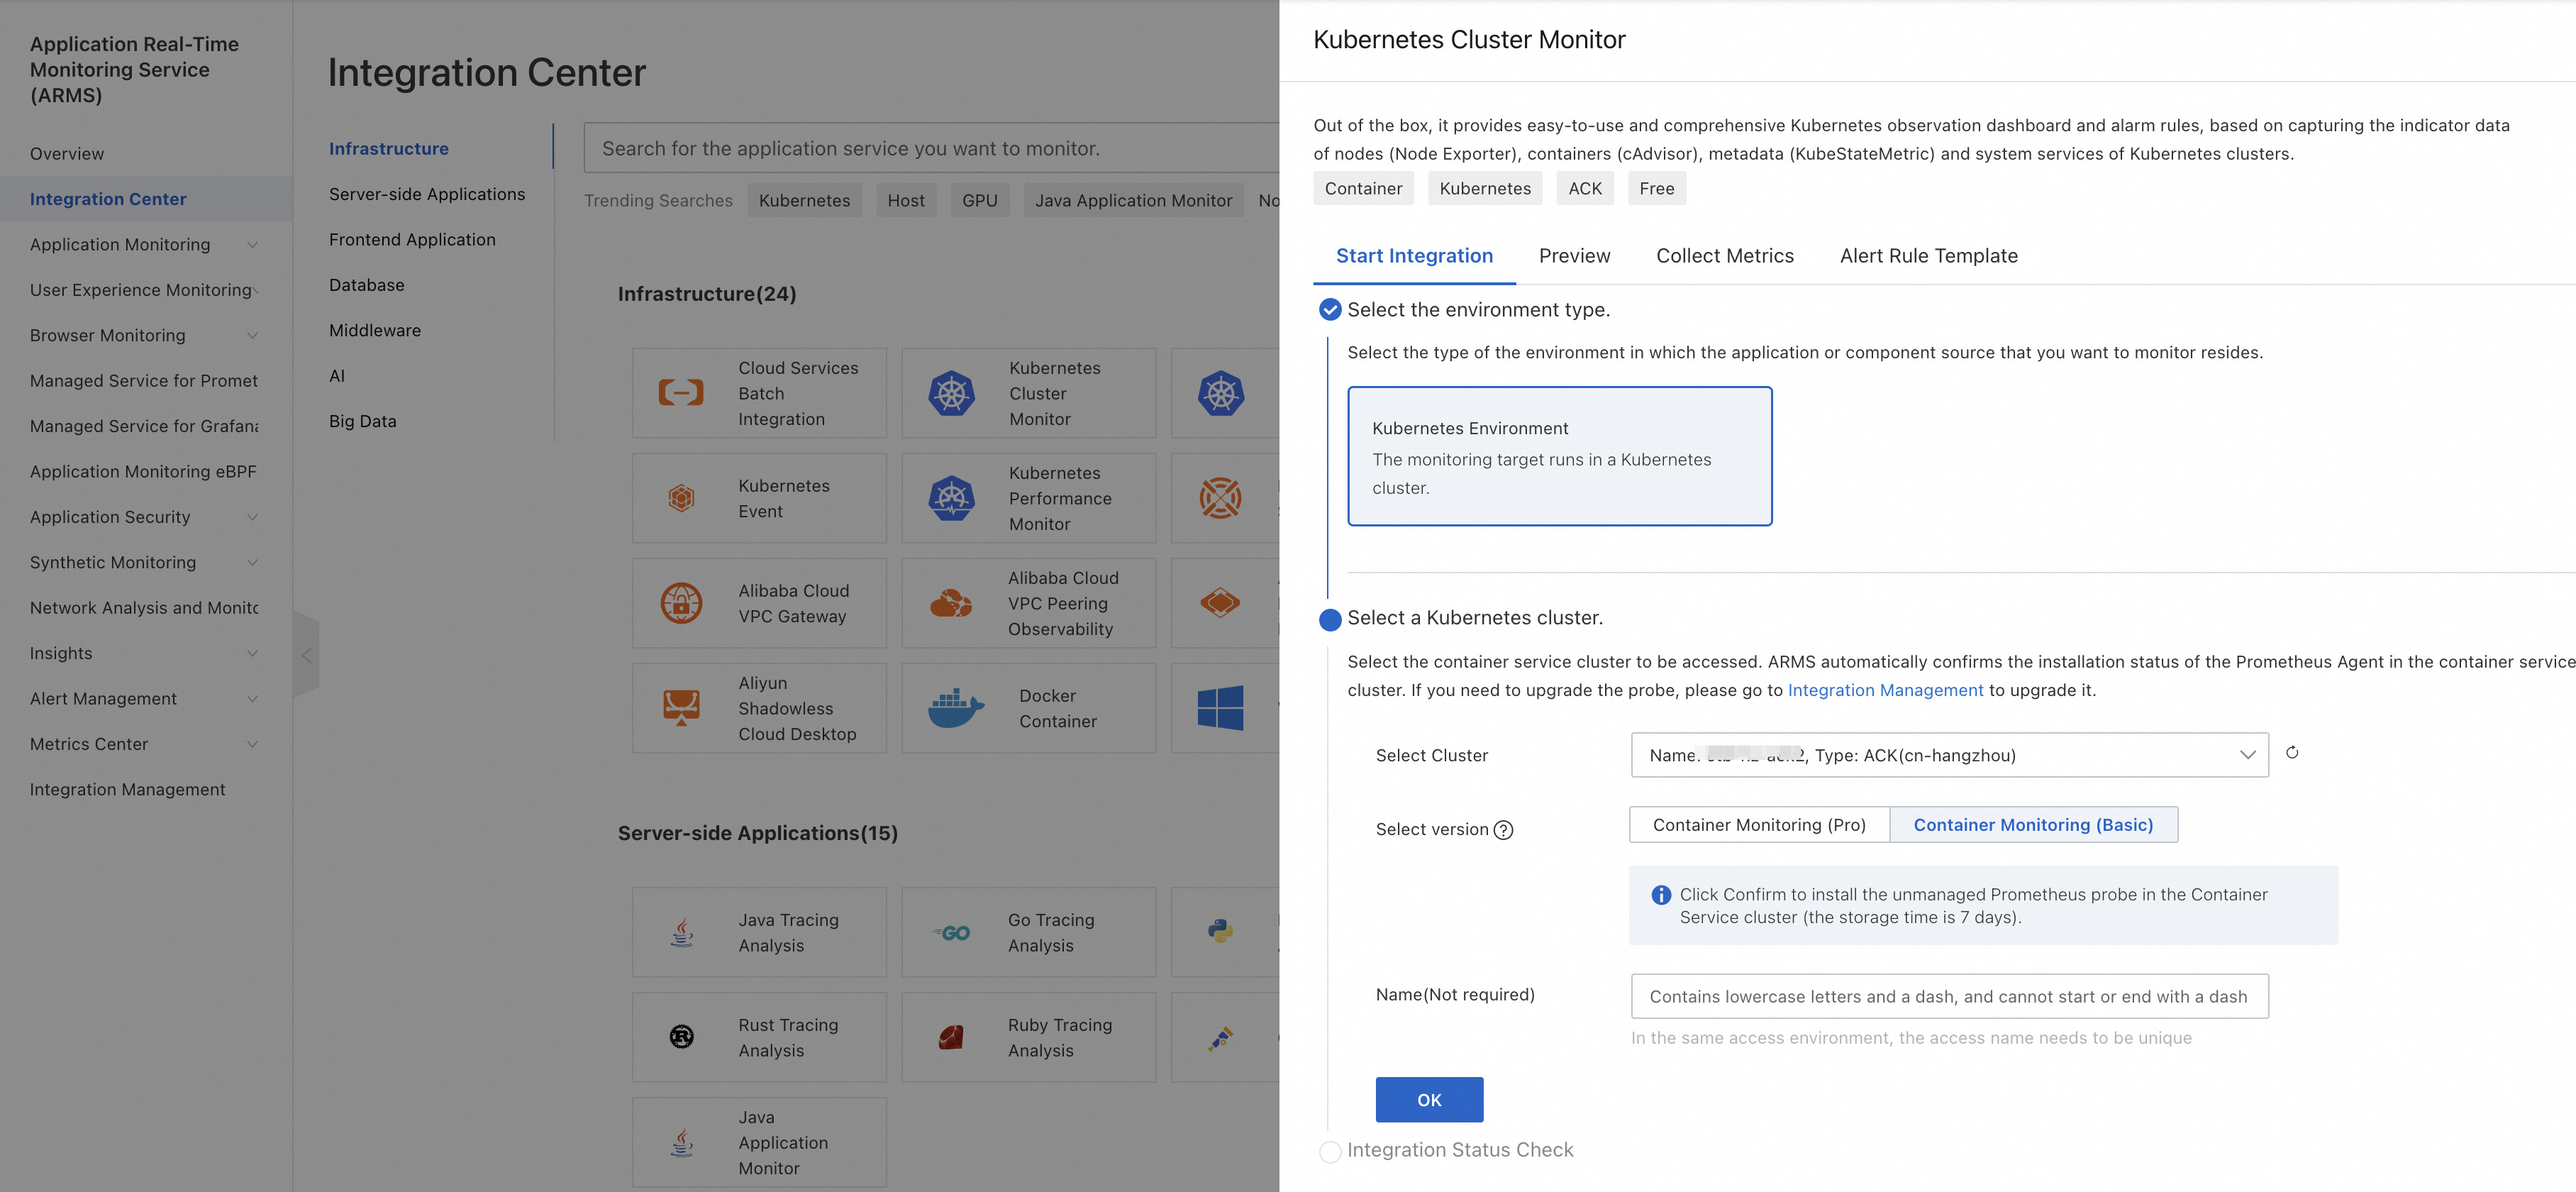
In the Prometheus console, choose Integration Management. On the Integration Management page, configure the integration of each monitoring component in the container cluster. This way, Alibaba Cloud Managed Service for Prometheus can generate collection jobs, capture monitoring data, and generate default dashboard and default alert rules.

[Optional] For user-defined collection tasks (ServiceMonitor, PodMonitor, and custom jobs), you can configure custom collection rules in the corresponding environment instance of Integration Management.
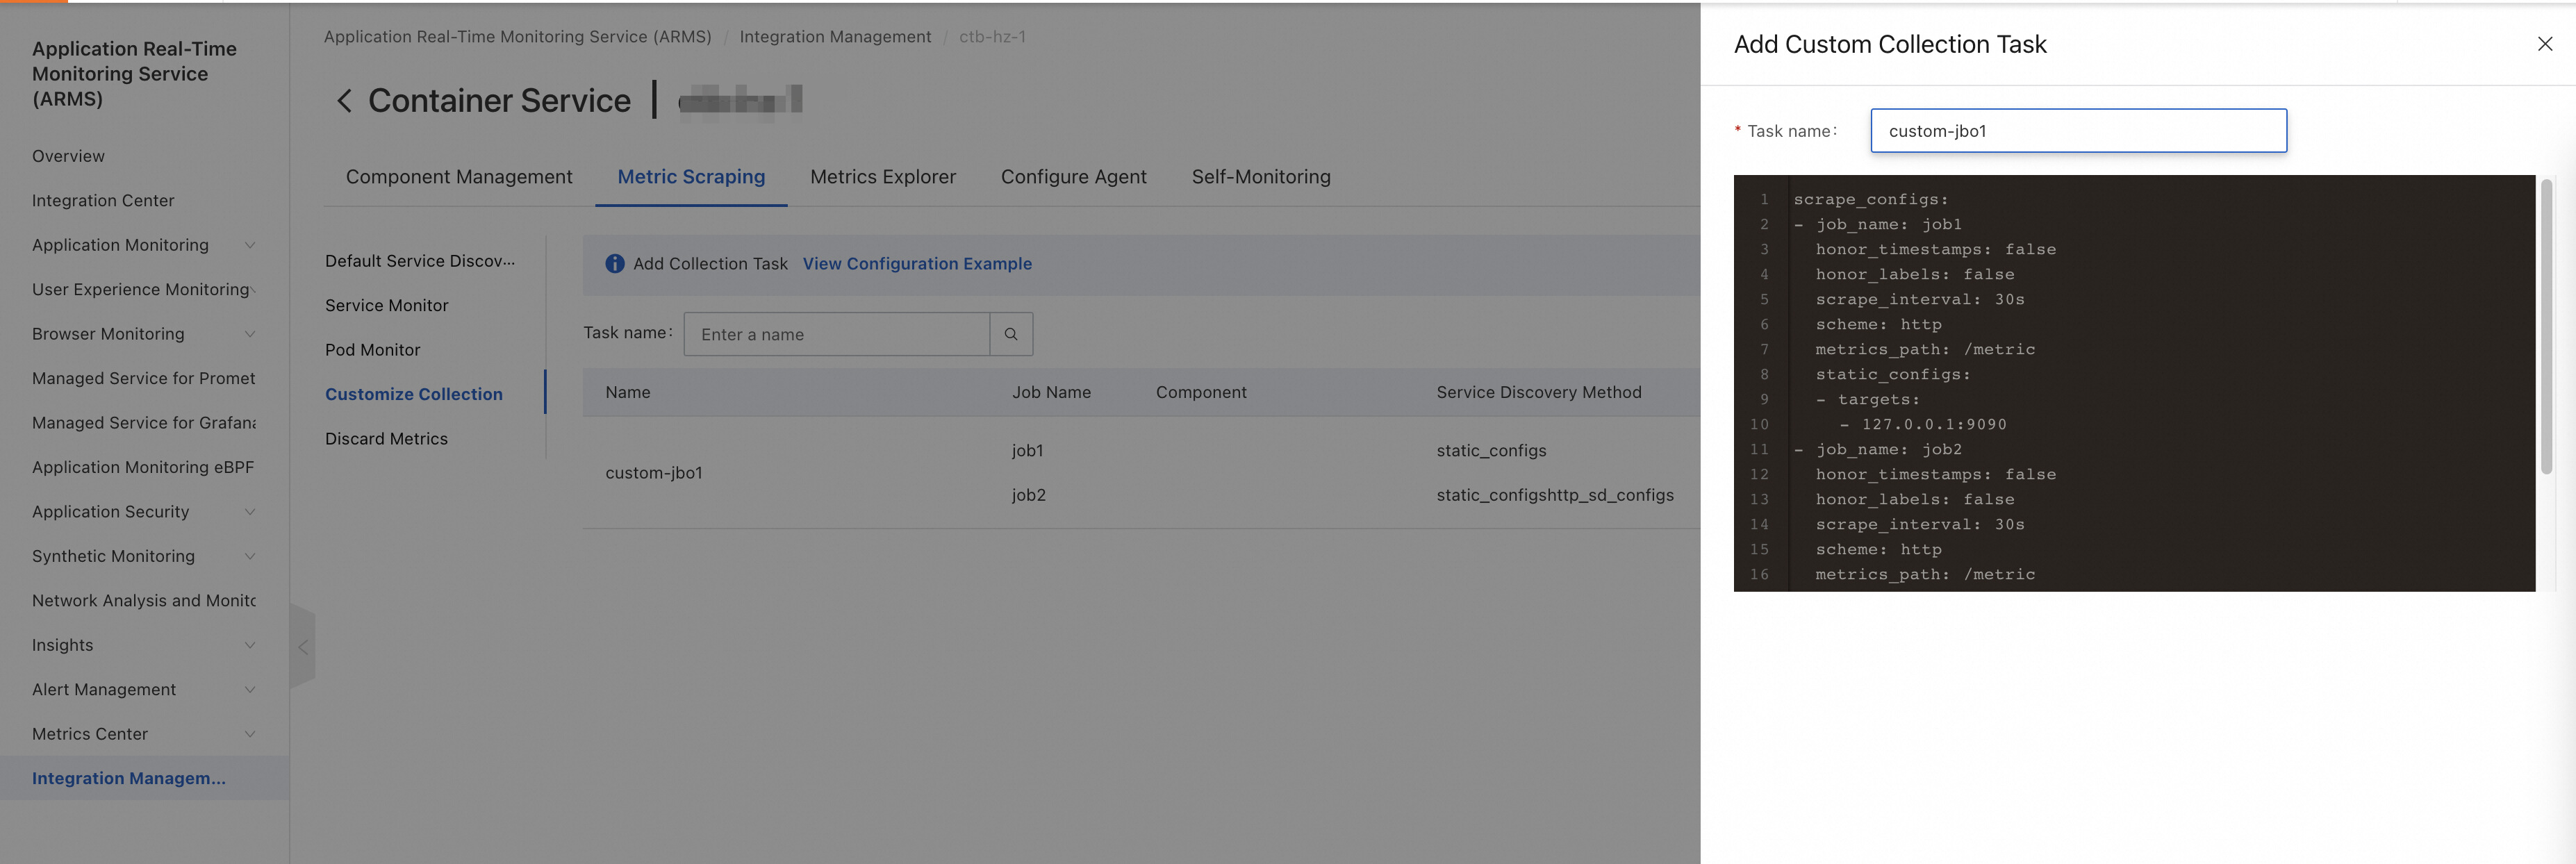
• Verify whether the container cluster dashboard and the default dashboard of each component of the container cluster on Alibaba Cloud Managed Service for Prometheus are normal.

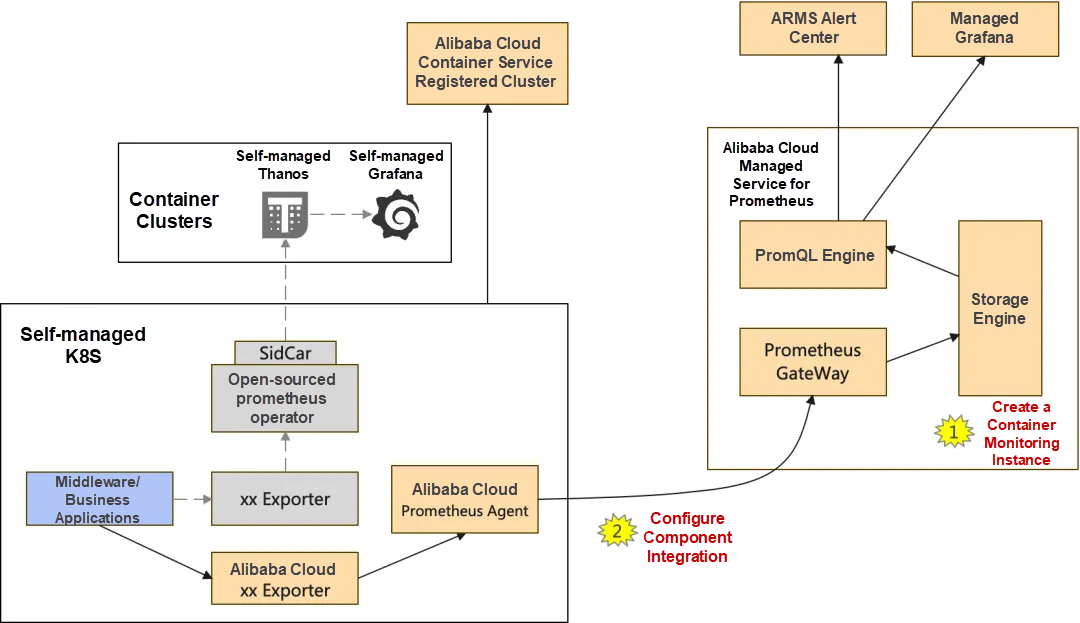
This scenario is similar to the Self-managed Kubernetes Scenario: Container Cluster Monitoring, except that you need to first register the self-managed Kubernetes cluster as the registered cluster of Alibaba Cloud Container Service.
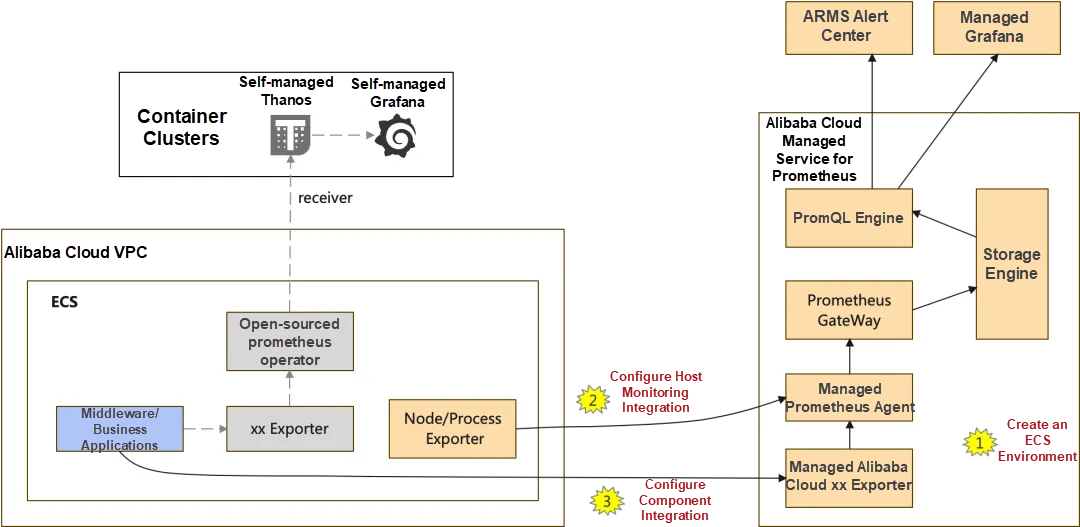
• After Alibaba Cloud Managed Service for Prometheus is configured and verified, the migration can be completed after n days (the number of days for which the existing self-managed open-source Prometheus Service is stored). This way, Alibaba Cloud Managed Service for Prometheus can collect complete monitoring data.
• Log on to the console of Alibaba Cloud Managed Service for Prometheus. On the Integration Center page, click Host Monitor, and follow the wizard to create an ECS Environment instance. Then, deploy the exporter and collection configuration for the ECS Host Monitor.

• In the Integration Management of the console, configure the integration of each component to be monitored in the VPC so that Alibaba Cloud Managed Service for Prometheus can generate collection jobs, capture monitoring data, and generate default dashboard and default alert rules.
• [Optional] For user-defined collection tasks, you can configure custom collection rules in the corresponding environment instance of Integration Management.
• Verify whether the default dashboard of each component on Alibaba Cloud Managed Service for Prometheus is normal.
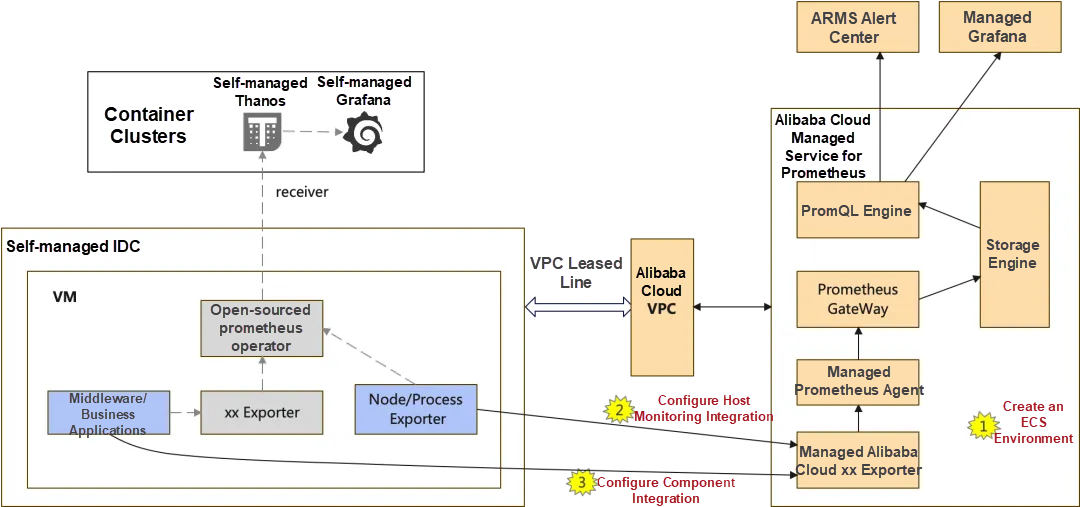
• After Alibaba Cloud Managed Service for Prometheus is configured and verified, the migration can be completed after n days (the number of days for which the existing self-managed open-source Prometheus Service is stored). This way, Alibaba Cloud Managed Service for Prometheus can collect complete monitoring data.
• You need to connect the self-managed IDC to an Alibaba Cloud VPC through methods such as the VPC leased line.
• You must install Node/Process Exporter on each VM of the self-managed IDC.
• Log on to the console of Alibaba Cloud Managed Service for Prometheus. On the Integration Center page, click Host Monitor (self-service installation and IP domain selection), and follow the wizard to create an ECS Environment instance. Then, generate the collection configuration for the Host Monitor.
• In the Integration Management of the console, configure the integration of each component to be monitored in the VPC so that Alibaba Cloud Managed Service for Prometheus can generate collection jobs, capture monitoring data, and generate default dashboard and default alert rules.
• [Optional] For user-defined collection tasks, you can configure custom collection rules in the corresponding environment instance of Integration Management.
• Verify whether the default dashboard of each component on Alibaba Cloud Managed Service for Prometheus is normal.
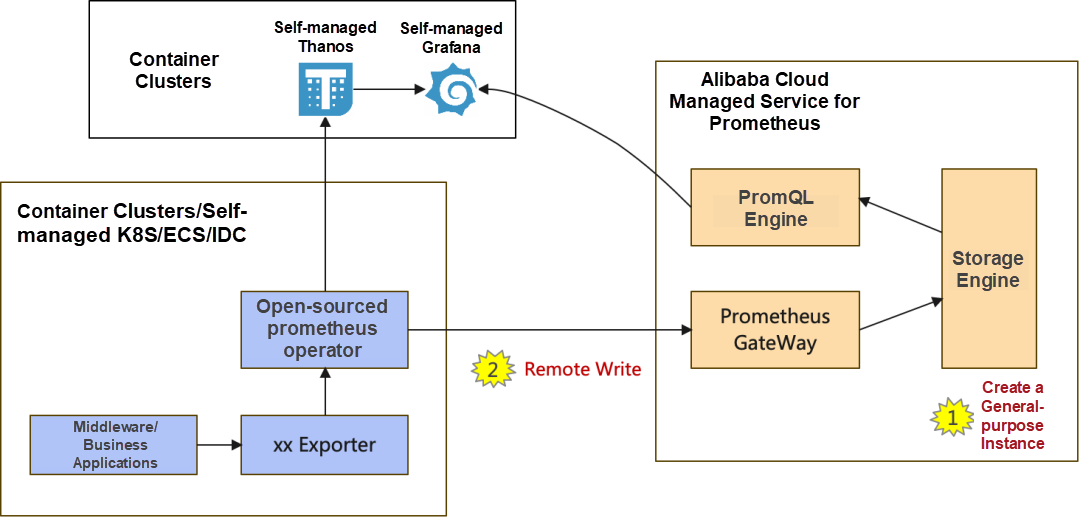
• After Alibaba Cloud Managed Service for Prometheus is configured and verified, the migration can be completed after n days (the number of days for which the existing self-managed open-source Prometheus Service is stored). This way, Alibaba Cloud Managed Service for Prometheus can collect complete data.
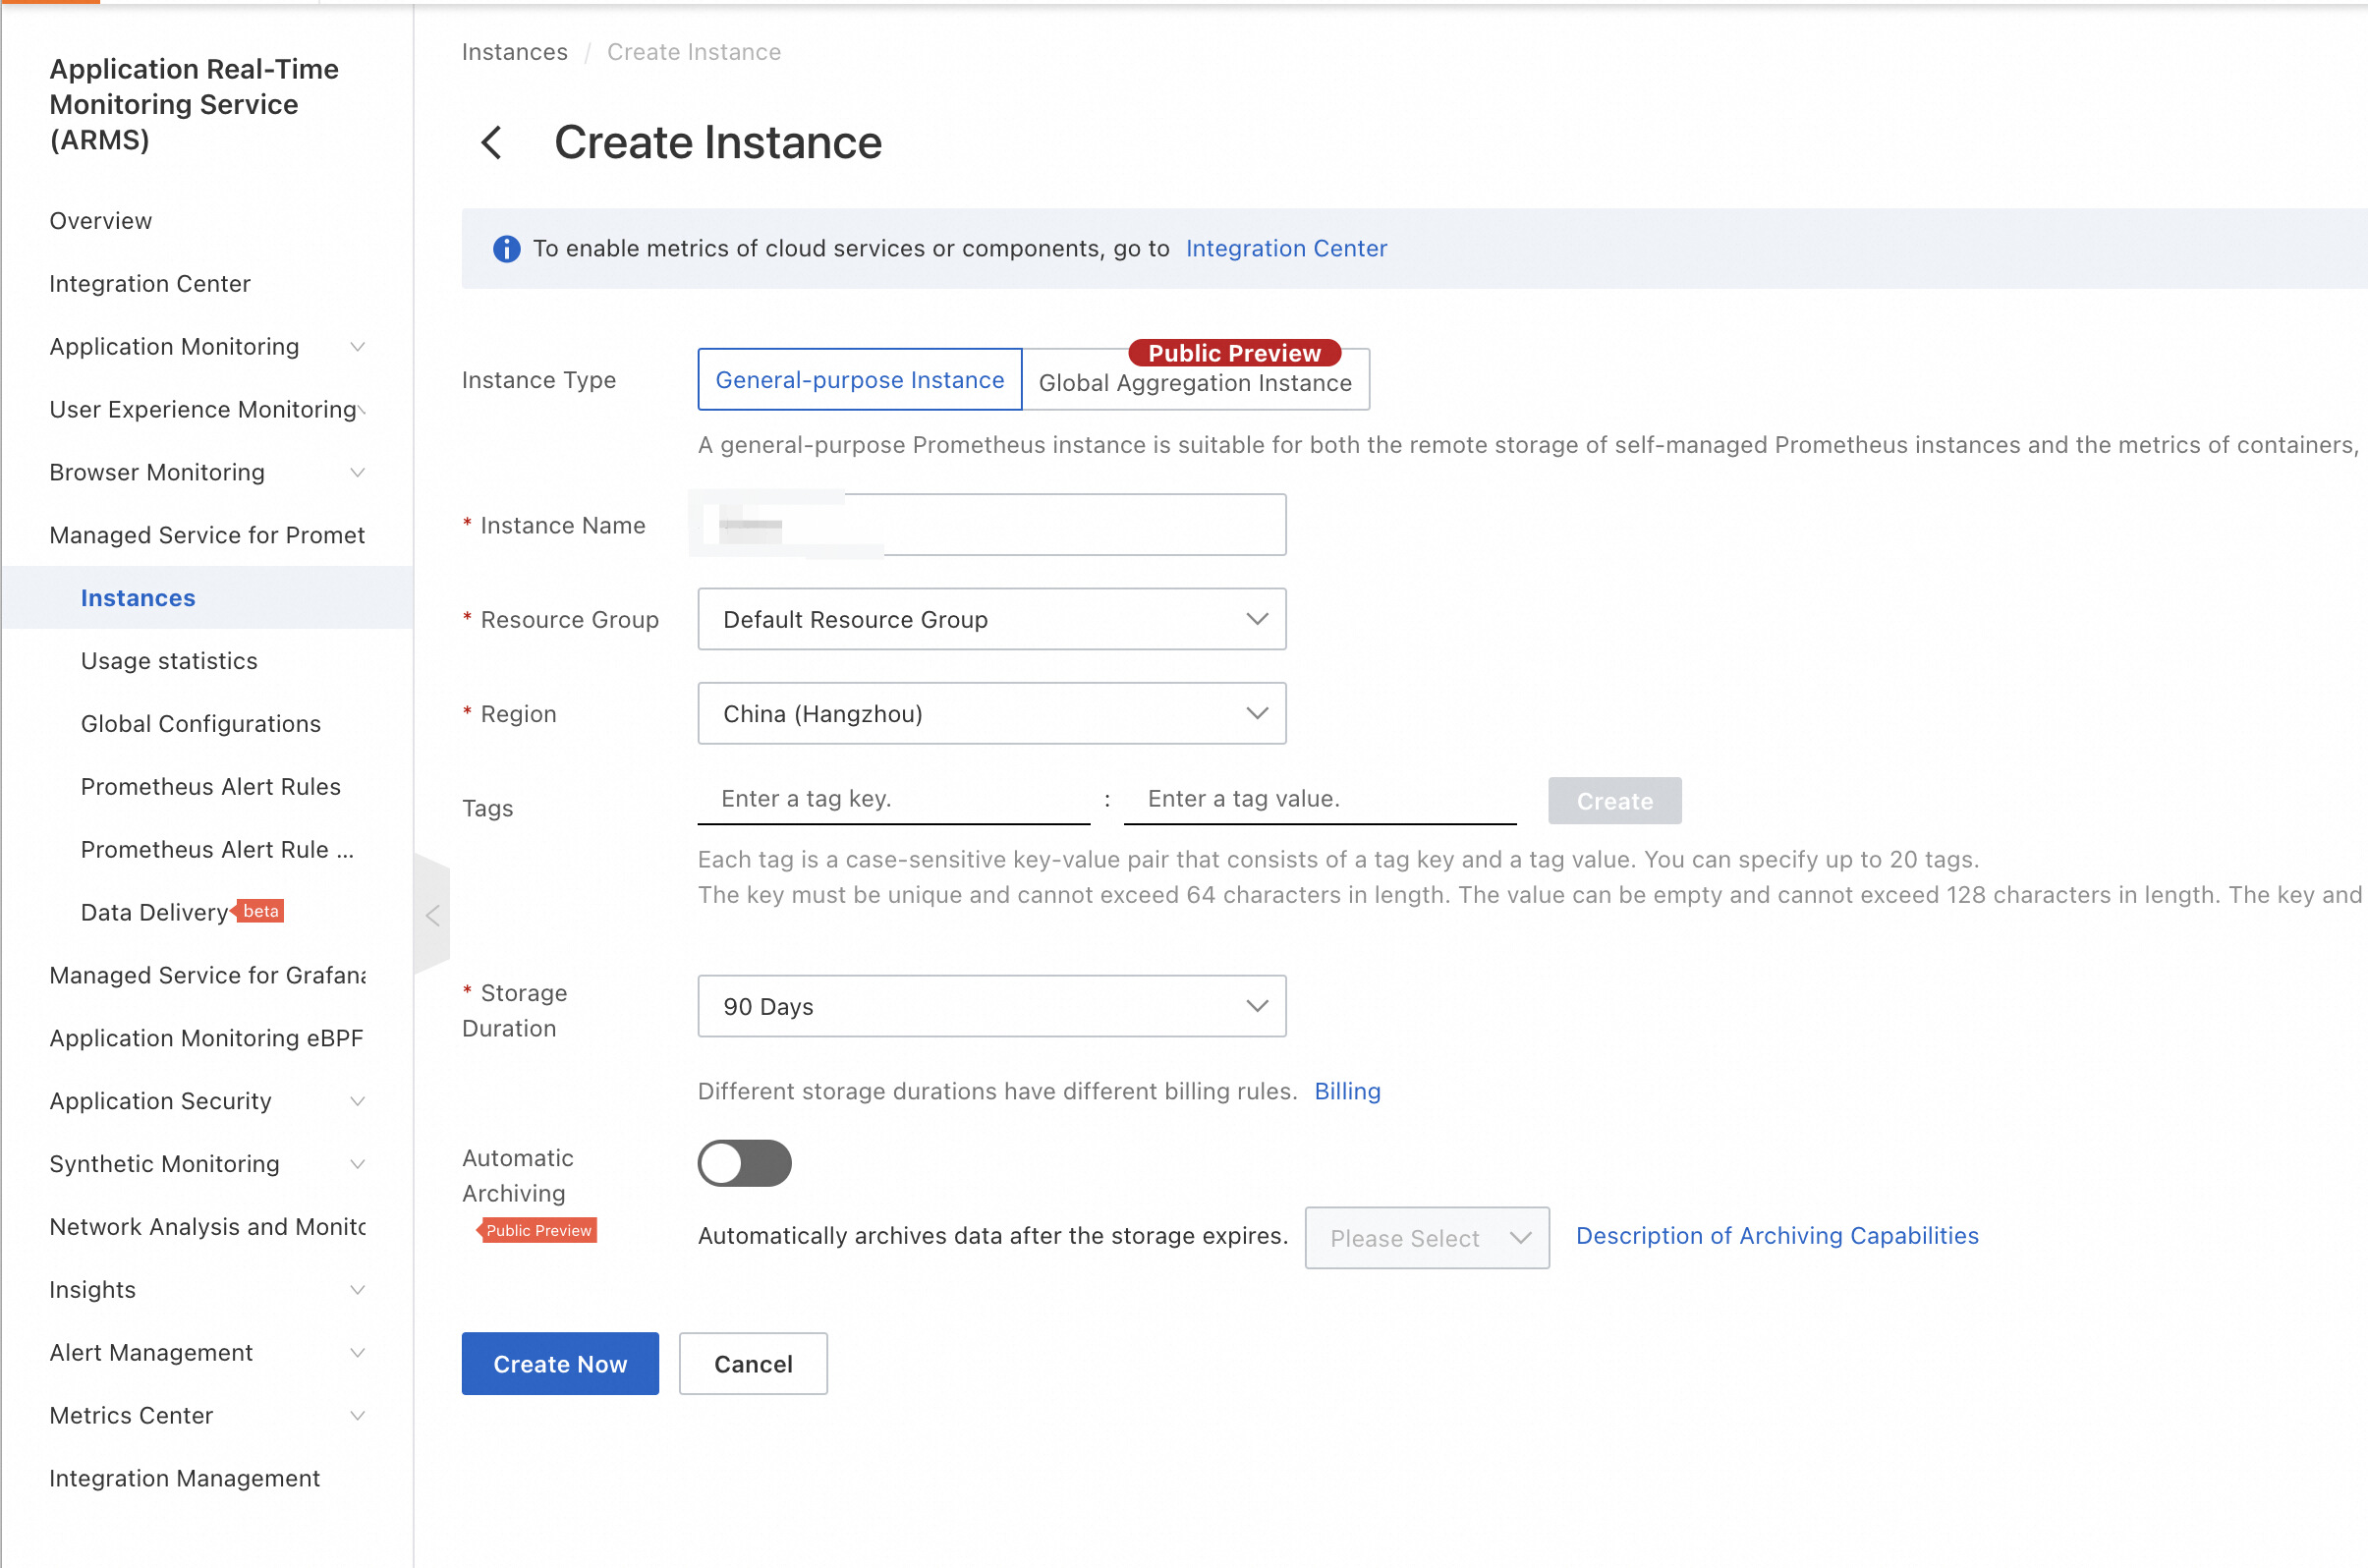
• Log on to the console of Alibaba Cloud Managed Service for Prometheus, choose Instances, click Create Instance, and select General-purpose Instance to create an instance.
Modify the configuration of self-managed open-source Prometheus to Remote Write monitoring data to Alibaba Cloud Managed Service for Prometheus.
On the Metrics Center of the console of Alibaba Cloud Managed Service for Prometheus, query and verify metrics from the self-managed open-source Prometheus Remote Write.
In the migration process of the above-mentioned metric collection, Alibaba Cloud Managed Service for Prometheus has built-in default, professional, and out-of-the-box dashboards for container clusters and common components (such as MySQL and Redis).
• For container/Kubernetes and ECS monitoring scenarios:
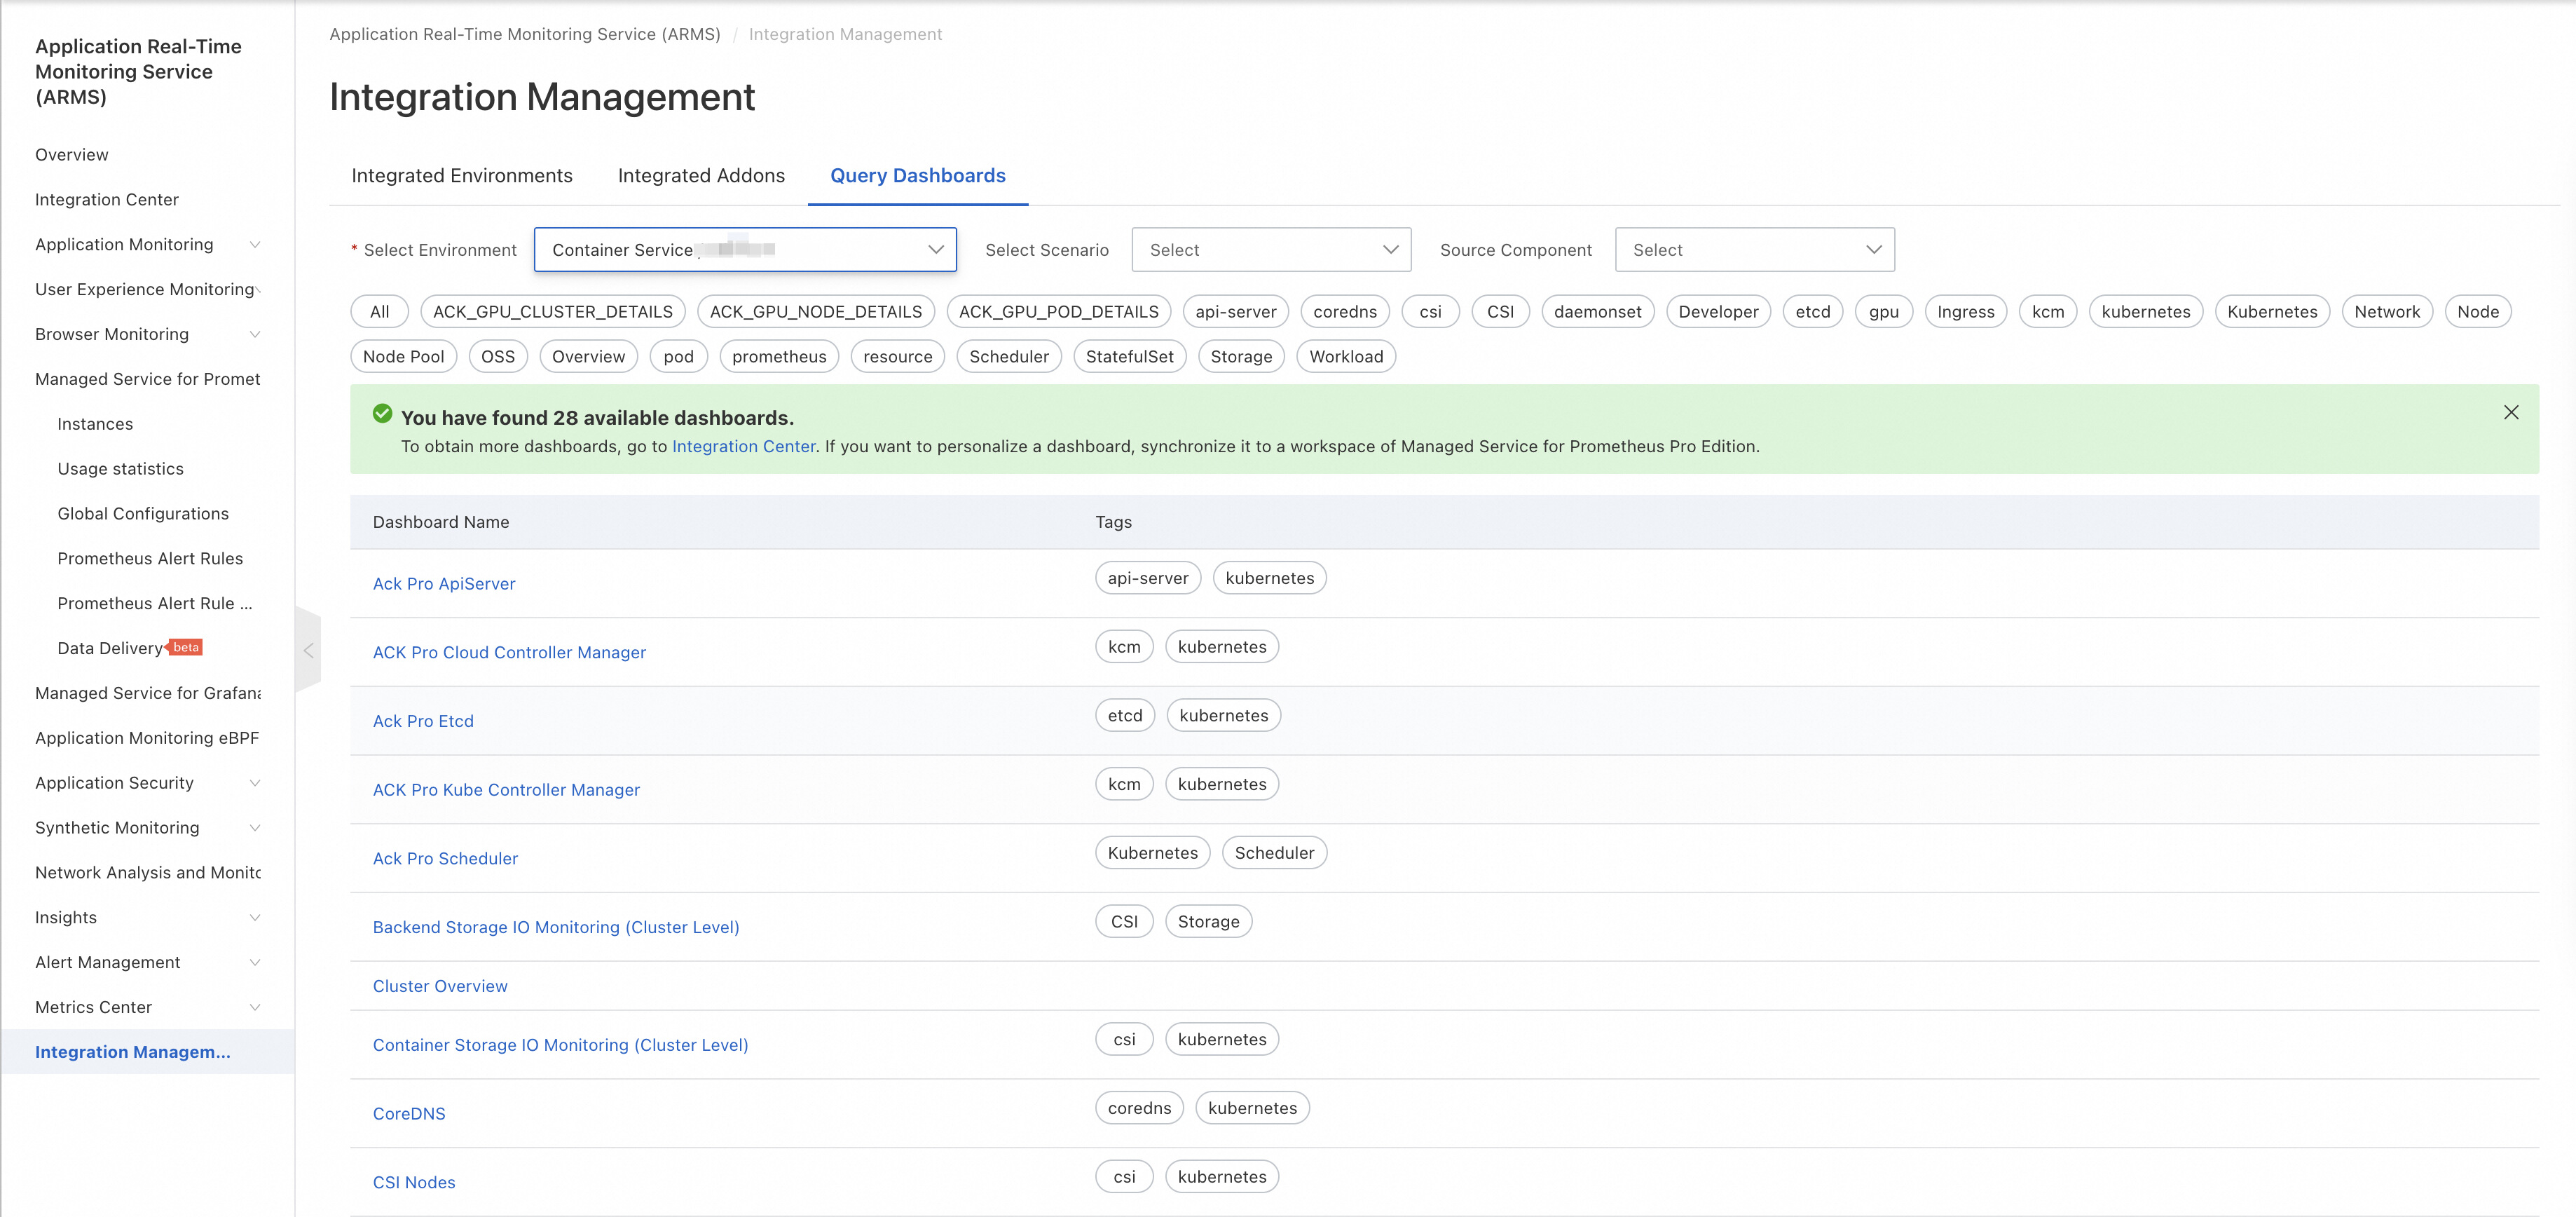
In the console of Alibaba Cloud Managed Service for Prometheus, you can view the default dashboard of each component on the Query Dashboards page.
For a custom dashboard, you must create a Grafana Pro Edition and then migrate self-managed Grafana or import the specified dashboard.
• For general-purpose instances in Remote Write scenarios: To continue using the existing self-managed Grafana, you only need to change the data source of Grafana to the corresponding instance data source of Alibaba Cloud Managed Service for Prometheus.
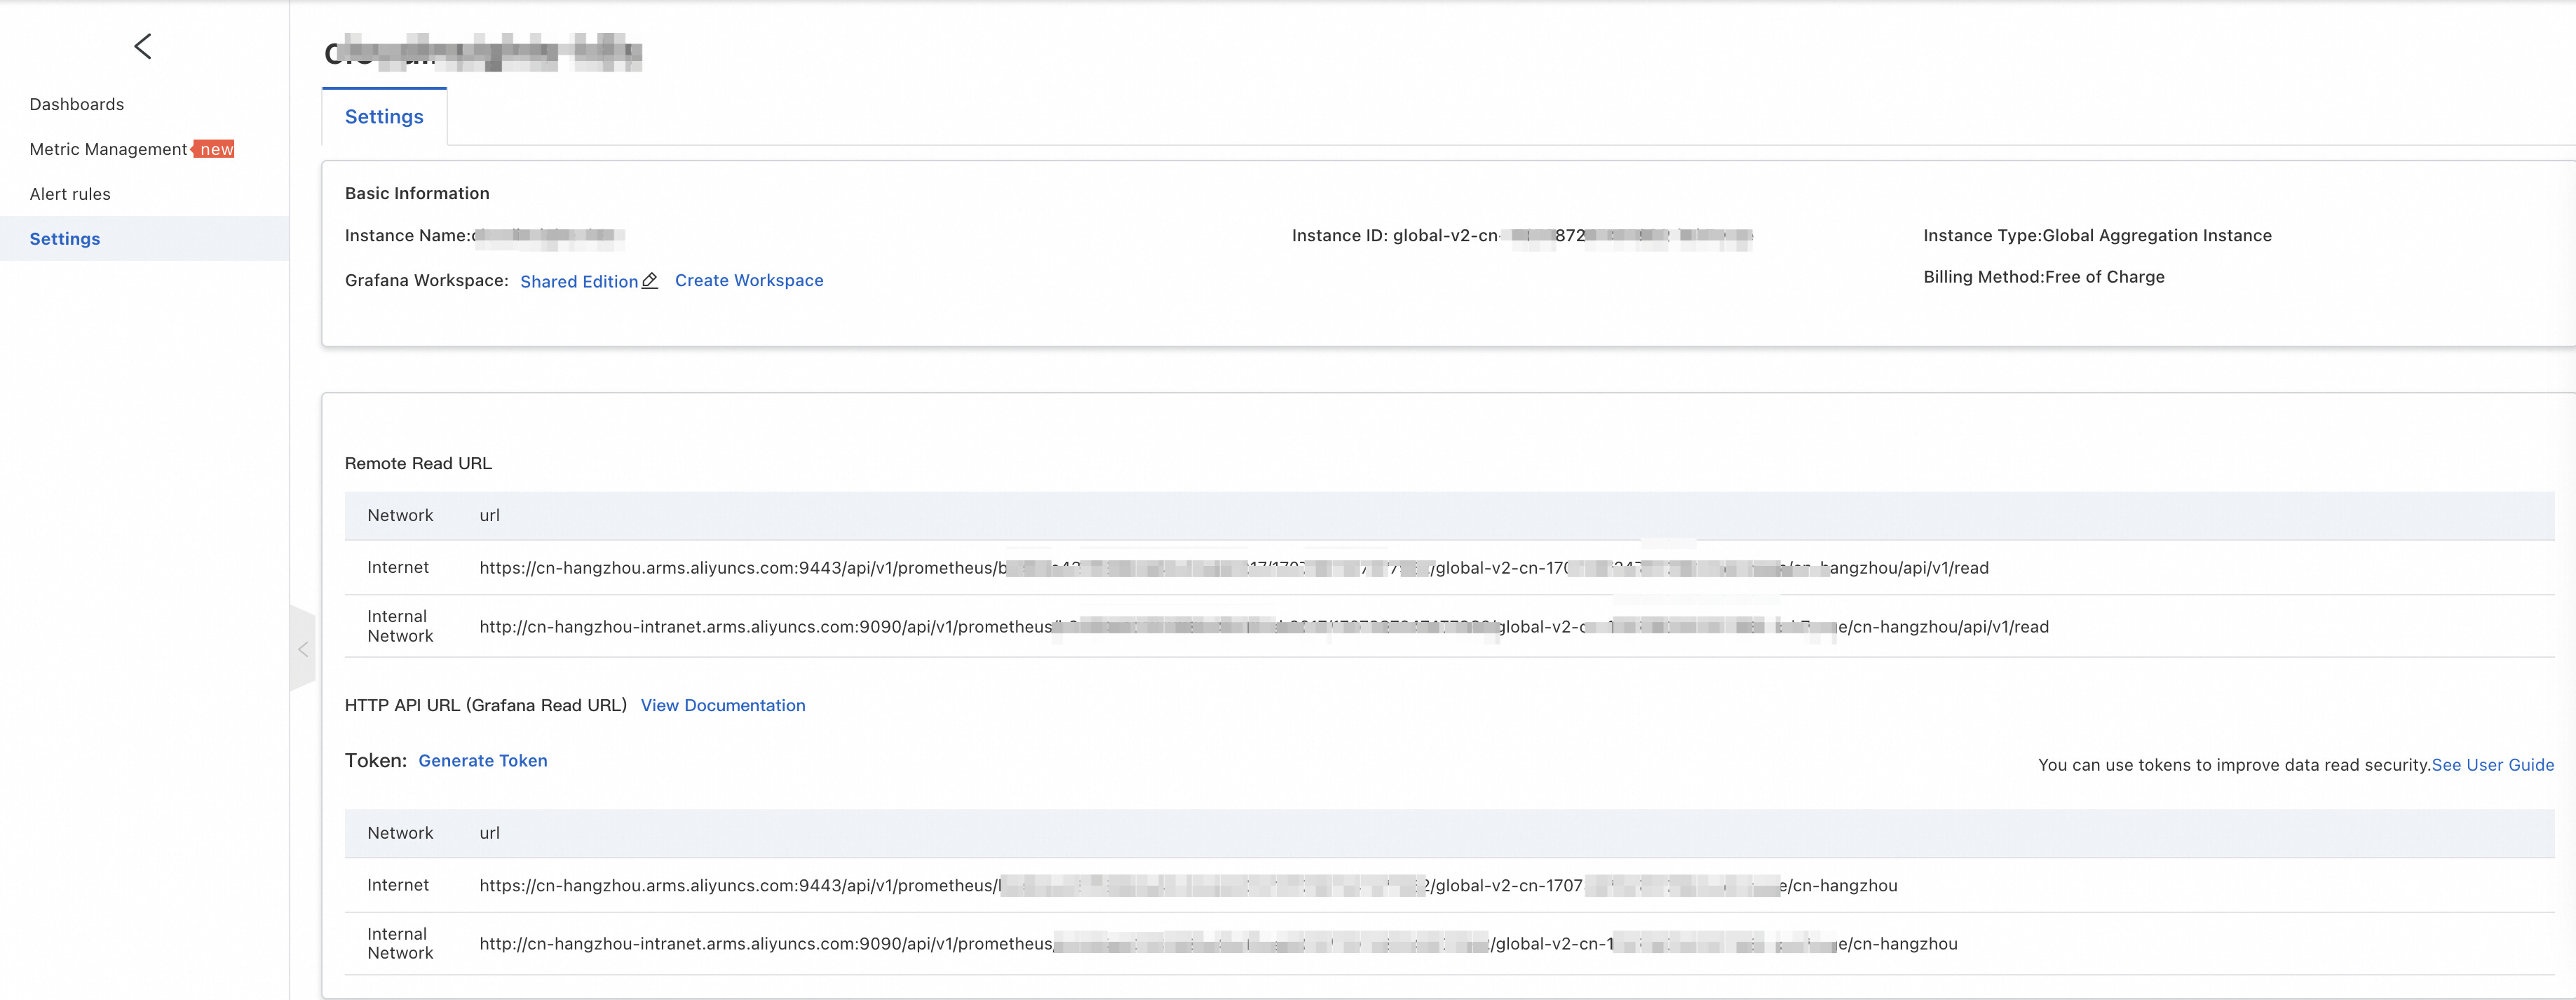
For the scenario that you want to aggregate and display the monitoring data of multiple containers/Kubernetes/ECS/IDC, you can use the global aggregation instance of Alibaba Cloud Managed Service for Prometheus.

Similar to the migration of visualized analysis, Alibaba Cloud Managed Service for Prometheus has also created professional and out-of-the-box alert rules for container clusters and common components (such as MySQL and Redis).
• For integration scenarios of containers/Kubernetes and Elastic Compute Service (ECS) instances, log on to the console of Alibaba Cloud Managed Service for Prometheus. On the Integrated Addons page of Integration Management, click Alerts of the corresponding component to view the default alert rules generated for the component.

For custom alert rules, you can create and manage them on the Prometheus Alert Rules tab of the Prometheus Monitor page in the console of Alibaba Cloud Managed Service for Prometheus. You can also use the Prometheus Alert Rules Template to import existing Prometheus alert rules.

• For the scenario that you want to aggregate and alert the monitoring data of multiple containers/Kubernetes/ECS/IDC, you can use the global aggregation instance of Alibaba Cloud Managed Service for Prometheus.

Alibaba Cloud Managed Service for Prometheus is a fully managed observability service built based on open-source Prometheus that is an industry standard for cloud-native observability. By default, it integrates common cloud services and is compatible with mainstream open-source components. The service provides comprehensive observation of businesses, applications, middleware, and systems. In addition, it uses an out-of-the-box Grafana dashboard and intelligent alerting feature to optimize agent performance and system availability. Managed Service for Prometheus is a good choice for quickly building an all-in-one metric monitoring system in your enterprise. Therefore, enterprises can quickly identify and locate problems in businesses, reduce the impact of faults on businesses, and eliminate the workload of system construction and routine maintenance, thus effectively improving the efficiency of O&M and observation.
At the same time, Alibaba Cloud Managed Service for Prometheus, as an important component of Alibaba Cloud Observability Suite (ACOS), is integrated with Grafana and Tracing Analysis to form an observable data layer that supports storage and analysis of metrics and trace data, and integration of heterogeneous data sources. It also allows you to view dashboards, configure the alert rules, and explore data with the standard PromQL or SQL syntax. What's more, it gives data value to different scenarios, such as IT cost management, enterprise risk governance, intelligent O&M, and business continuity assurance, so that observable data can go beyond observation.
New Scenarios and New Capabilities: Observability Innovations in the AI-Native Era
Design of Cloud-native MQTT Message Engine Based on RocketMQ

212 posts | 13 followers
FollowAlibaba Cloud Native - May 20, 2024
Alibaba Cloud Native - September 8, 2023
H Ohara - November 20, 2023
5544031433091282 - October 8, 2023
Alibaba Cloud Native - September 8, 2023
Alibaba Cloud Native - March 1, 2024

212 posts | 13 followers
Follow Cloud Migration Solution
Secure and easy solutions for moving you workloads to the cloud
Learn More Database Migration Solution
Migrating to fully managed cloud databases brings a host of benefits including scalability, reliability, and cost efficiency.
Learn More ISV Solutions for Cloud Migration
Alibaba Cloud offers Independent Software Vendors (ISVs) the optimal cloud migration solutions to ready your cloud business with the shortest path.
Learn More Apsara Stack
Apsara Stack is a full-stack cloud solution created by Alibaba Cloud for medium- and large-size enterprise-class customers.
Learn MoreMore Posts by Alibaba Cloud Native