By Kunshuo
The popularity of generative AI results in a surge of commercial or open-source large language models (LLM) in the market. This also increases the number of applications and business scenarios built on LLMs and the AI ecological technology stack. Large-scale model training and inference scenarios give rise to related jobs such as MLOps and LLMOps. However, how can we monitor and ensure the performance and user experience of LLM applications after deployment? How can we support trace visualization analysis and root cause identification for LLM applications in complex topology scenarios? We need to evaluate the actual online performance from cost and effectiveness perspectives to assist with the analysis, assessment, and optimization iterations of LLMs. Given these needs and problems, observability solutions for LLM application technology stacks become increasingly important.
On November 30, 2022, OpenAI launched ChatGPT, which attracted significant market attention and user registrations. LLMs represented by ChatGPT have significantly improved their abilities to conduct extensive and continuous conversations, and generate high-quality content, as well as their language understanding and logic inference. At the same time, alongside the development of LLM technology stacks, various scaffolding, tools, and platforms emerge, accelerating the application implementation.
• Application orchestration frameworks, such as LangChain, LlamaIndex, Semantic Kernel, and Spring AI use abstractions and encapsulations to significantly reduce development complexity and enhance engineering iteration efficiency.
• Vector databases, including Pinecone, Chroma, Weaviate, and Faiss, leverage semantic vector search and long-term memory capabilities and collaborate with LLM to address issues of real-time data, knowledge graph construction, and model hallucinations, thereby further enhancing the LLM application effectiveness.
• One-stop application R&D platforms like Dify and Coze provide out-of-the-box tools that enable visualized orchestration, debugging, and deployment to significantly lower the development threshold and accelerate the transformation from concept to application.
Based on these technological capabilities and framework tools, LLM applications primarily fall into three paradigms: chat applications, RAG applications, and Agent applications.

These applications center around leveraging the broad generalization ability of LLMs to ensure natural and smooth chat and interactions. Developers focus on the design of the user interface (UI) and optimize input and output through carefully designed prompt engineering and fine-tuning strategies. These applications have a relatively simple architecture with short logical paths, so you should select a generic or specific LLM based on the specific use case. For chat applications, the R&D process focuses on the structured design of prompts and efficient integration with the standard OpenAPI of LLMs. This approach is suitable for scenarios where you need to quickly build a simple AI application or preliminary exploratory project, offering strong flexibility and rapid iteration.
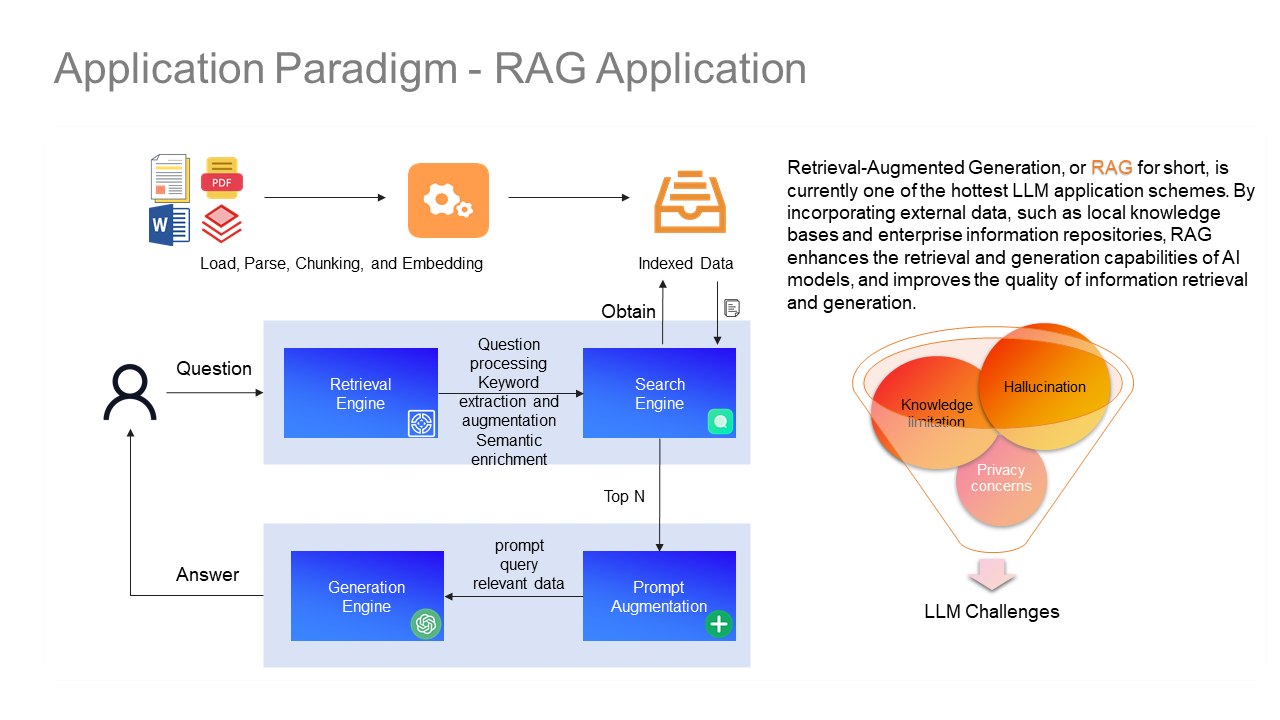
The strategies to improve the response quality of LLMs typically leverage fine-tuning and prompt engineering, which are effective but still face challenges such as knowledge boundaries, fabricated information, and privacy concerns. To address these issues, RAG (Retrieval-Augmented Generation) technology enhances LLMs by incorporating knowledge bases, overcoming limitations in learning long-tail knowledge, retrieving up-to-date information, querying private data, and improving source verification and interpretability. The customized embedding of knowledge is accelerated through a standardized process. That is to say, by storing proprietary knowledge in vector databases through chunking and indexing steps and matching precisely to user queries, the input context for LLMs can be enriched to significantly improve the accuracy and comprehensiveness of responses. However, RAG technology also shows its limitations, particularly in handling demands with high integration, comparative analyses, and multi-dimensional inference. It requires further technological innovation and strategy optimization.
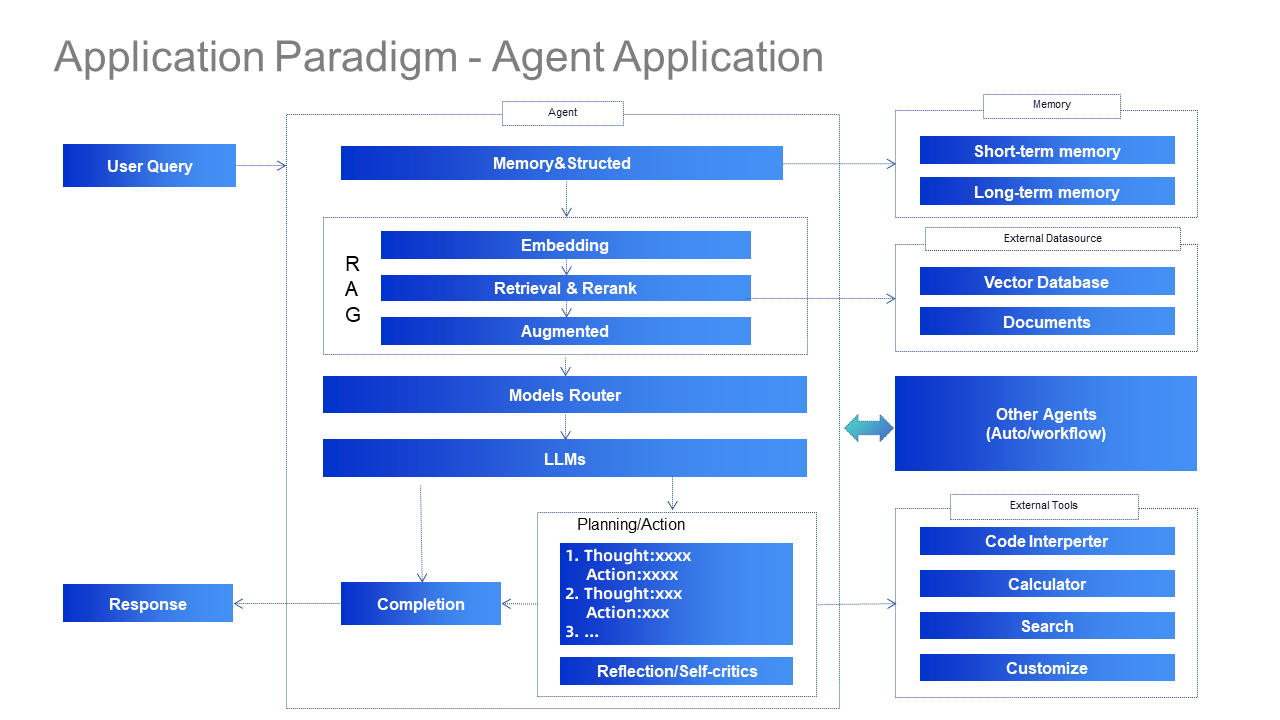
In terms of design patterns, LLM Agents emphasize reflection, tool use, planning, and multi-agent collaboration. The solution to complex problems requires the combination of task decomposition, long-term memory, iterative reasoning and reflection, and external tool invocation, making this a current hot issue for the research of application implementation. Although LLM Agents are incredibly powerful, they do face several challenges, such as response delays due to complex reasoning processes, poor reliability from complex reasoning and lack of failure recovery, inconsistent quality of external tools on which they reply, security and trust concerns due to non-complete controllability, and limited experience in multi-agent interaction and collaboration. Instead, techniques such as workflow orchestration, reflection/self-critics, and observability are often required to achieve higher controllability and reliability.
Research data from TruEra reveals that although 2023 was seen as a boom period for prototyping LLM applications, real-world production deployments remain low. According to the historical data analysis, only about 10% of enterprises can advance more than 25% of LLM development projects into production, while over 75% of enterprises have not yet achieved commercial implementation of any LLM applications. This highlights a significant gap between theoretical prototypes and practical applications. For instance, each of the application paradigms introduced earlier faces real-world challenges. The reasons behind this include the following challenges in transforming LLM applications from R&D to production.
Since LLM is a complex statistical model, its behavior is occasionally unpredictable, especially in the following core issues:
• Poor Model Performance: The model may struggle with complex logical reasoning tasks, and responses to novel questions are less qualified due to limitations of the knowledge base. Over time, model drift may lead to declined response quality.
• Performance and Reliability Challenges: Designed to be stateless, LLMs can take more than ten seconds to generate a single response, and even longer for complex reasoning. In high-concurrency scenarios, requests to large models can easily trigger throttling, and some requests may accidentally fail, which will impact service stability.
• Lack of Interpretability and Transparency: Model interpretability requires detailed version information, parameter configurations, and deployment specifications to facilitate users' better understanding and verification of the generated responses.
• Resource Management Issues: Monitoring computation resource load and efficiency is crucial because LLMs will suffer from slow responses during peak hours and are constrained by hard limits on token counts, thereby affecting service continuity and efficiency.
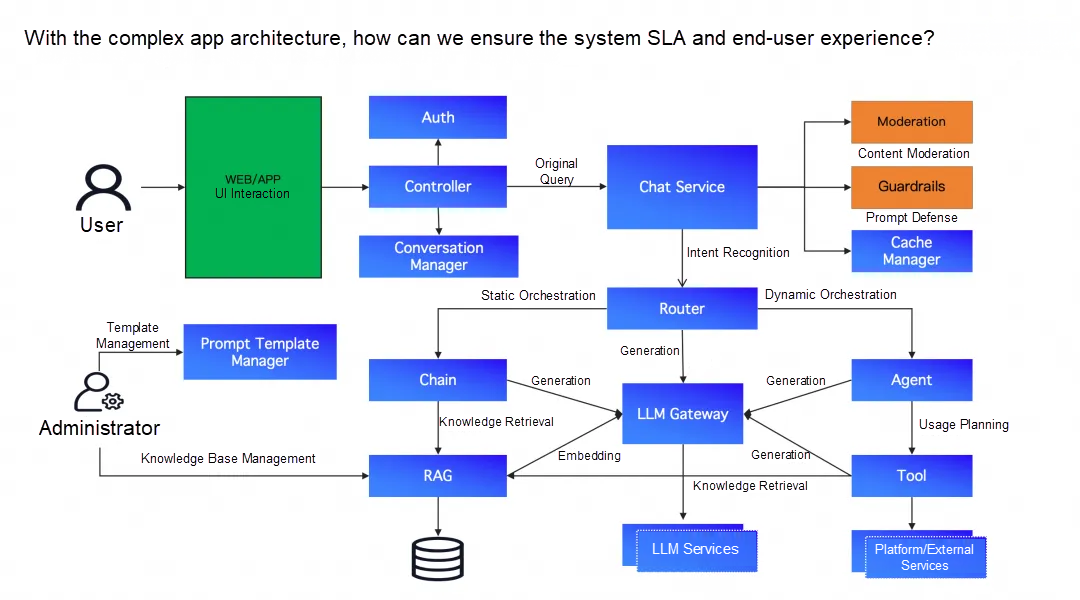
A complex LLM app architecture might include frontend UI components, the authentication module, conversation management, chat service, LLM routing, and static or dynamic workflow orchestration. It needs to integrate with different LLM services and use Moderation and Guardrails for content moderation and prompt defense. It may invoke external tools or services to perform specific operations, query vector databases to optimize chat context or long-term memory, and connect to caching services to directly hit caches and reduce redundant calls to LLMs, thereby lowering costs. However, the following challenges may arise:
• How to accurately collect data at a low cost to identify and locate online issues for diverse app language technology stacks, technology frameworks, and different LLM invocations?
• How to monitor the end-to-end trance performance and business quality of deployed LLM applications, and trigger alerts promptly upon performance degradation or error reporting to ensure user experience?
• How to record input and output in a standardized manner, trace token consumption, critical execution operations, and result states, and ultimately visualize them for flexible analysis?
• How to provide white-box capabilities for root cause identification with the limitation of hidden underlying details by application orchestration frameworks, complex agent logic, and inconsistent quality of tools used?
• How to record practical online performance data to assist with analysis, evaluation, and continuous optimization and iteration for LLM applications?
In summary, LLM applications involve complex application trace topology, component dependencies, and field insights of LLMs, so observability capabilities are needed to ensure the system SLA and end-user experience.
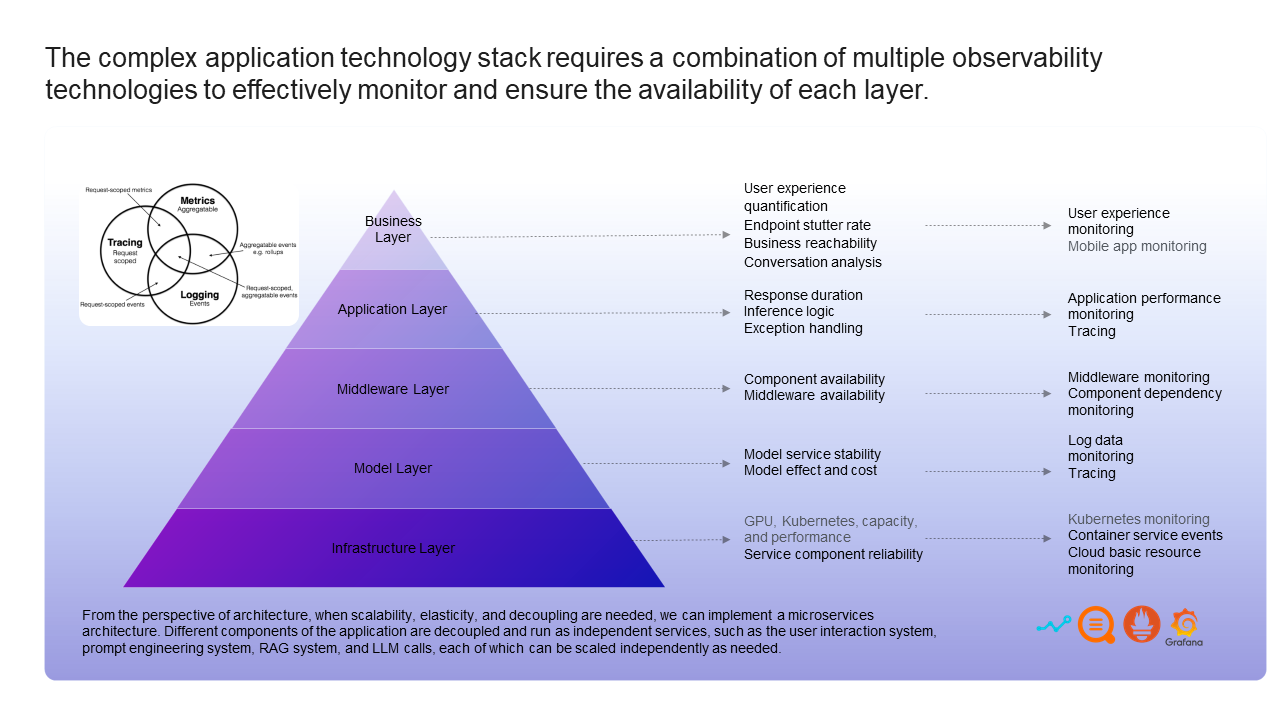
From the perspective of architecture, when scalability, elasticity, and decoupling are needed, we can implement a microservices architecture. Different components of the application are decoupled and run as independent services, such as the user interaction system, prompt engineering system, RAG system, and LLM processing, each of which can be scaled independently as needed. Accordingly, dependencies such as Kubernetes and various middleware components are introduced, which further increases the R&D and O&M complexity of the overall technology stack. The complete technology stack can be divided into:
• Infrastructure Layer: Focus on the optimization and utilization of GPU resources, capacity planning and performance tuning for Kubernetes, and building a reliable environment for component execution.
• Model Layer: Focus on the stable operation of model services, quality control of model outputs, and cost-benefit analysis.
• Middleware Layer: Ensure efficient and reliable communication between all components and services, and monitor the availability of middleware to support upper-layer applications.
• Application Layer: Focus on code performance optimization, workflow orchestration and integration, rigorous logic, and establishing a powerful exception handling mechanism.
• Business Layer: It is directly related to the user experience and improves service quality through quantitative analysis of terminal response time, reachability of business functions, and in-depth analysis of conversation data.
To ensure the smooth operation of the entire system, particularly to meet the stability requirements of the model layer and new dependency components, each layer requires meticulous monitoring and observability strategies.
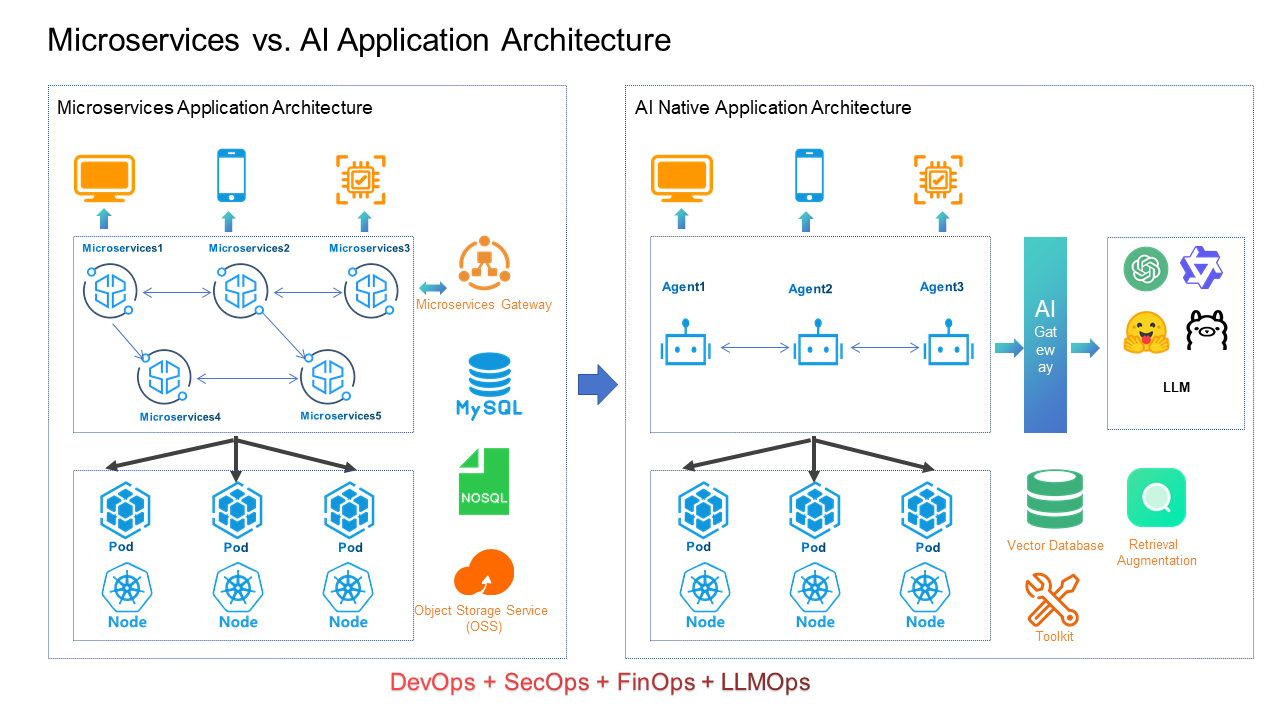
Microservices architecture employs a detailed service splitting strategy and generates a series of service units that interact through a microservices gateway. Dependency components include databases, NoSQL, and various middleware such as messages. At the infrastructure level, Kubernetes is used to achieve dynamic resource scaling and automatic O&M. This not only enhances system resilience and reliability but also simplifies service deployment and maintenance. However, under the AI application architecture, multiple agents collaborate to solve complex problems, heavily relying on LLM inference capabilities. Its integration with the AI gateway simplifies the connection to different LLM services, which helps mask protocol-level differences. At the same time, it supports public capabilities such as traffic routing, request management, and security protection.
This architecture has a relatively small number of dependent components, primarily consisting of vector databases, external tool invocations, and RAG components. For LLM services that are deployed independently, given their high demand for computation resources, they are typically deployed on the infrastructure that is oriented by GPU clusters. This configuration is optimized specifically for deep learning tasks. Fine-grained management and monitoring of GPU resources are crucial to maximize resource utilization and dynamically adjust resource usage according to the demands of model training or inference, ensuring efficient and stable system operation.
In summary, microservices architecture focuses on building a flexible and resilient system architecture, while LLM applications aim at optimal model efficiency and effectiveness. Their observability requirements differ in terms of focus, data complexity, technical challenges, and performance evaluation standards. LLM application observability may need to process data at a higher dimension. Especially given the complexity of natural language processing, semantic analysis of model outputs is necessary. Therefore, LLM application observability primarily focuses on enhancing inference performance, optimizing the quality of model input and output, and managing resource consumption effectively. Advanced evaluation metrics and scientific experimentation methods, such as A/B test across different models, are utilized to quantitatively analyze model performance and continuously iterate and upgrade the model for the best business outcomes.
Alibaba Cloud Application Real-Time Monitoring Service (ARMS) supports the collection of observability data through self-built and open-source agents. It builds an observability data base around Logs, Metrics, Trace, and Profiling, and covers RUM, APM, STM, container monitoring, and infrastructure monitoring. ARMS fully embraces open-source standards of Prometheus, OpenTelemetry, and Grafana to provide customers with high reliability, high performance, and rich features and implement out-of-the-box, end-to-end, and full-stack observability capabilities.
The observability solution for LLM applications focuses on LLM field insights based on the basic capabilities of the ARMS. It collects and processes Logs, Metrics, Trace, and Profiling data generated by LLM applications, and provides visualized analysis capabilities. By further mining, processing, and analyzing the above data, the value of the data can be maximized. Next, let's look at the specific implementation idea and product capabilities of this solution.
By analyzing the interaction characteristics and processing trace of LLM applications, and considering the operations of chat apps, RAG apps, and Agent apps, as well as orchestration frameworks of LangChain and LlamaIndex, we use conversations to connect user interactive Q&A, while Trace carries the trace interaction nodes within the application. Finally, the field-specific operation semantics, standardized storage, and the idea for visualized displays of key content are determined.
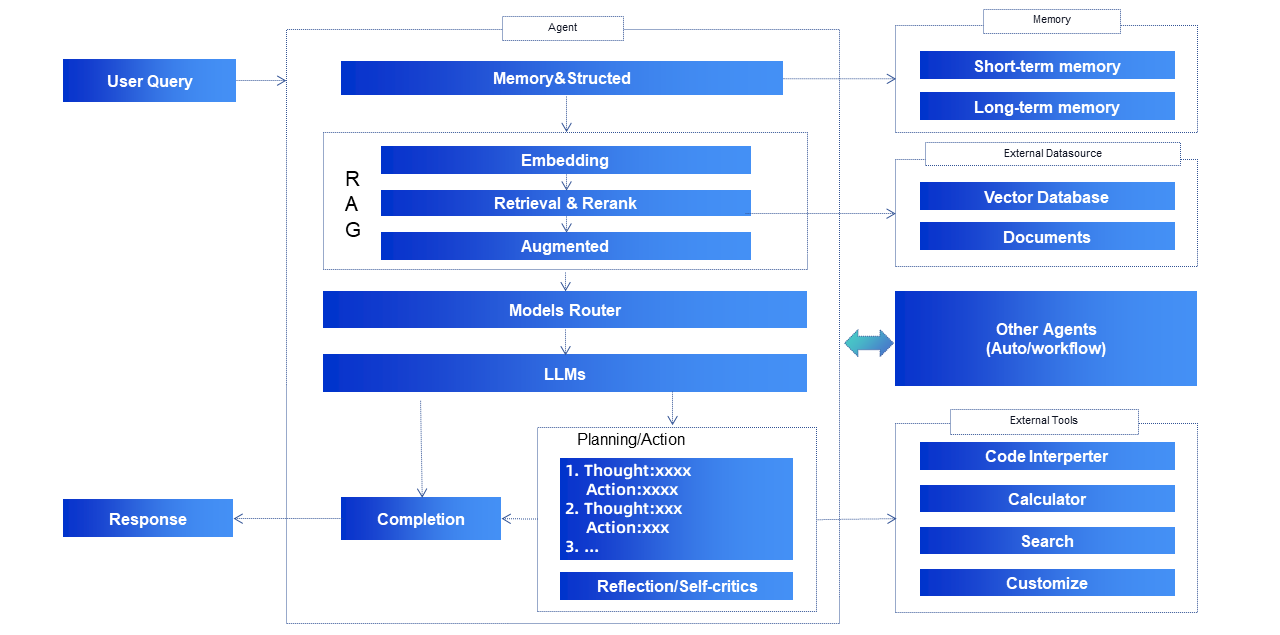
Critical operation types (LLM Span Kind) are defined to identify the core operation semantics of LLM applications. Specifically, these Kinds include:
• CHAIN: Identify static workflow orchestration, which may contain Retrieval, Embedding, and LLM calls. It can also nest other Chains.
• EMBEDDING: Represent embedding processing, such as operations involving text embeddings in LLMs, which can query based on similarity and optimize questions.
• RETRIEVER: Indicate retrieval in RAG scenarios, where data is fetched from vector databases to enrich the context and improve the accuracy and comprehensiveness of LLM responses.
• RERANKER: For multiple input documents, rank them based on relevance to the question, which may return the TopK document as the LLM.
• TASK: Identify internal custom methods, such as calling a local function to apply custom logic.
• LLM: Identify calls to LLMs, such as invoking different LLMs based on SDK or OpenAPI for inference or text generation.
• TOOL: Identify calls to external tools, such as invoking a calculator or weather API to obtain the latest weather information.
• AGENT: In intelligent agent scenarios, it identifies the dynamic orchestration and decides the next step based on the inference results of LLMs, which may involve multiple calls to LLM and Tool and obtain the final answer according to each decision.
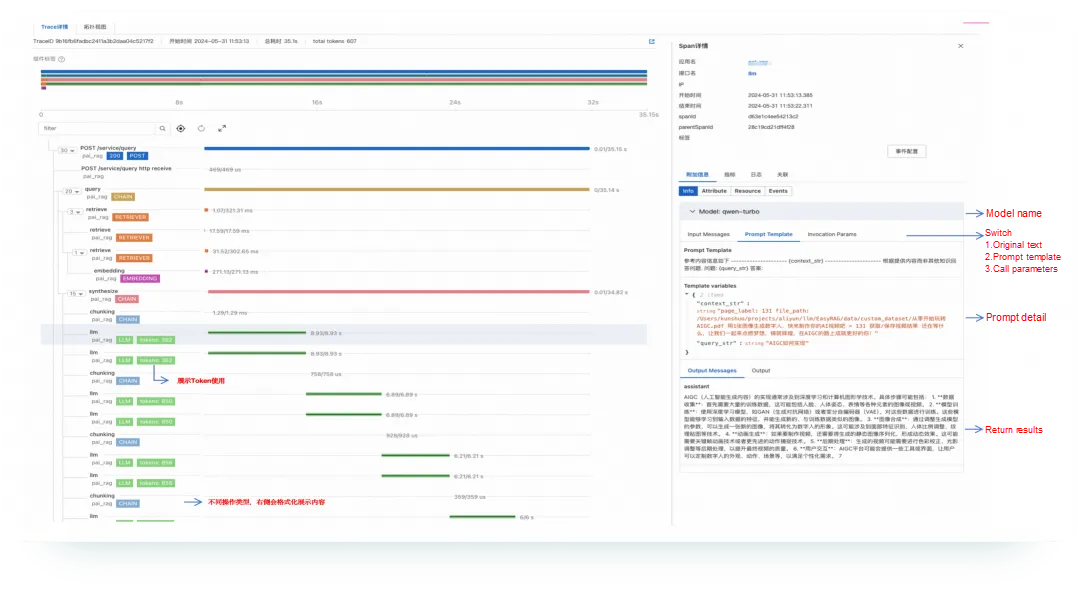
The inputs, outputs, and associated contextual attributes vary based on operation types. For example, under LLM operations, there might be a prompt (an optional prompt template), input parameter requests to model services and the response content, and the consumption of input and output tokens, or RETRIEVAL involves the specific content of the document chunk and the relevance score. By extracting these key attributes of critical operations and recording them in Spans, it becomes easier to analyze and aggregate Trace data. Additionally, standardized detail views can clearly show the steps and details of operations, assisting developers in quickly identifying key nodes and troubleshooting.
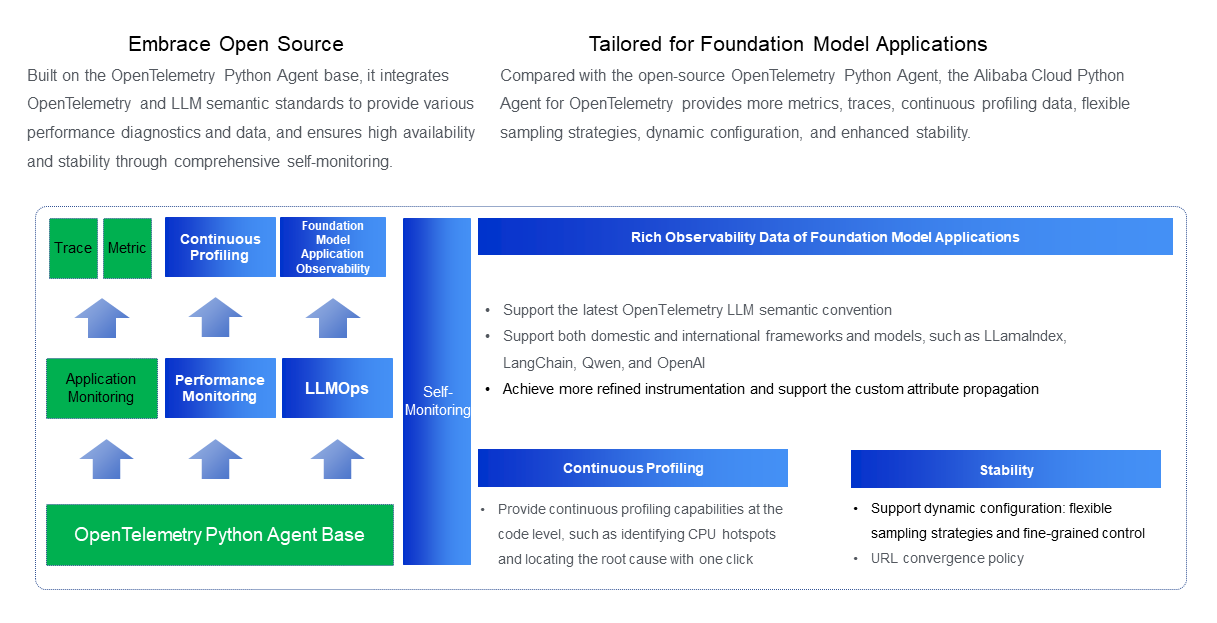
To achieve data collection and reporting of LLM Trace semantics described above, the capability to automatically collect client instrumentation and connect the server to report data is required. Since Python is used as the mainstream programming language for LLM applications, Alibaba Cloud, based on its self-built Java Agent, has developed a self-built Python Agent on the OpenTelemetry Python Agent base. Compared with the open-source implementation, the Alibaba Cloud Python Agent provides more metrics, traces, continuous profiling data, flexible sampling strategies, fine-grained control, dynamic configuration, and various performance diagnostics. It ensures high availability and stability through comprehensive self-monitoring.
The Alibaba Cloud Python Agent is tailored for LLM applications. It supports not only the latest OpenTelemetry LLM semantic convention but also both domestic and international frameworks and models such as LlamaIndex, LangChain, Qwen, and OpenAI, which achieves more refined instrumentation. It also supports the custom attribute propagation to meet diverse monitoring needs. At the technical level, the callback mechanism of the framework and the decorator principle are used to achieve non-intrusive instrumentation, which greatly simplifies the deployment process. Users only need to install the agent during application startup (container environments support automatic installation and upgrades by adjusting the YAML file of the workload based on the ack-onepilot component) to achieve automatic collection of multi-dimensional data such as Metrics, Traces, and Profiling, and seamless integration with Alibaba Cloud's observability platform. This significantly lowers the technical threshold for observability integration and provides a solid foundation for stable operation and efficient maintenance of LLM applications.
For simple integration scenarios, users can only report trace data by using the Aliyun Python SDK alone to enjoy the out-of-the-box observability dashboard, trace explore, and visualization capabilities of LLM applications. It also supports LLM applications that integrate the SDKs of open-source projects such as OpenInference and Openllmetry to report and host data to Alibaba Cloud observability servers. For scenarios that cannot be covered by multi-language and framework instrumentation, the original OT SDK and the standard LLM Trace semantics (see the link at the end of this article) can be used to implement custom instrumentation and reporting.
We recommend that you use the Aliyun Python Agent to report data to the observability gateway. After that, you can handle traffic spikes through data buffering and ensure high performance and reliability of the entire data trace through protocol compatibility, field enrichment, metric aggregation, traffic statistics, and self-monitoring. Finally, the metric data is written to Prometheus, trace data is stored in SLS, and metadata storage related to coding may be involved. The processed written data is then displayed through queries in the console, and metric service is provided through alerts.
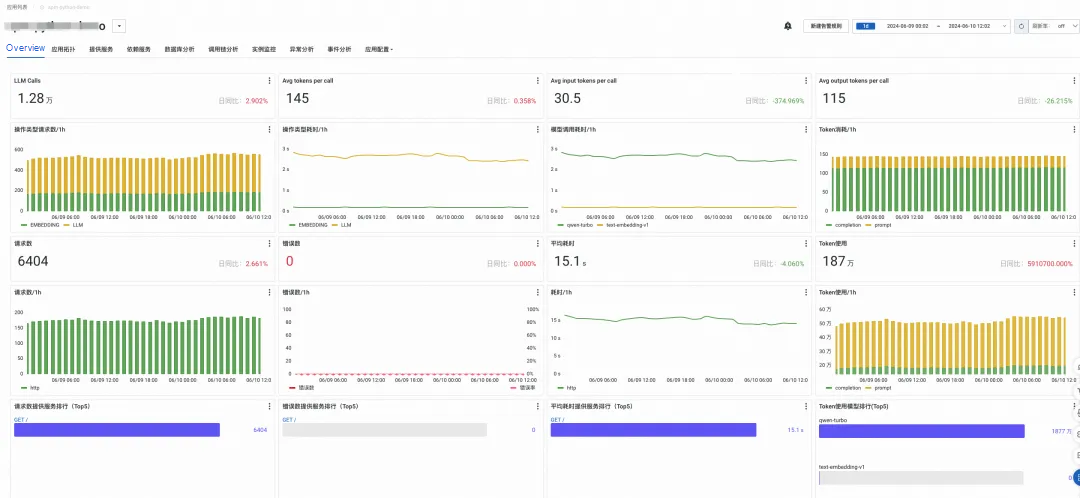
Upon successful connection, Alibaba Cloud observability provides an out-of-the-box metrics dashboard by default, along with a field-specific metrics dashboard designed for LLM applications. The LLM application characteristics can be automatically identified and dynamically rendered to display this field-specific dashboard, which offers metric analysis capabilities such as LLM call statistics and trends, token usage trends for input and output, and top model dimensions.
LLM applications have their own dedicated Trace Explore analysis view that supports statistics and analysis by LLM Span Kind and model name and that displays operation execution counts, token consumption trends, and input/output content. The view can also be displayed by the custom Attributes column.
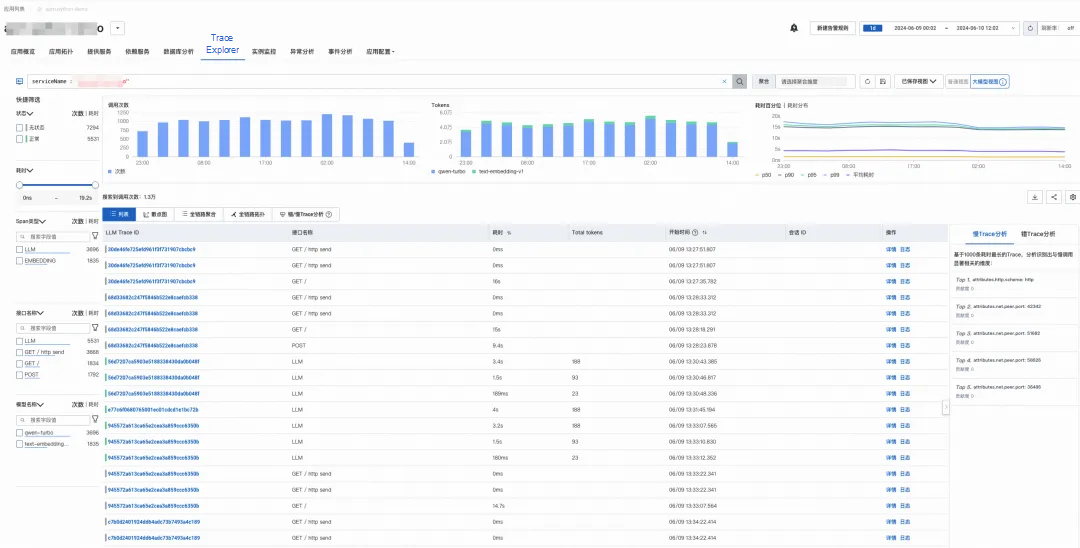
Based on field-specific views, key operations within the LLM application workflow are formatted for display to highlight critical information including operation types, token consumption, and input/output content. This can help developers focus on critical information for troubleshooting. Additionally, significant features and experience have been optimized for the trace detail page, such as faster loading speed for ultra-long traces, support for filtering, focusing on Span, and support configuring quick navigation to custom links for custom events.
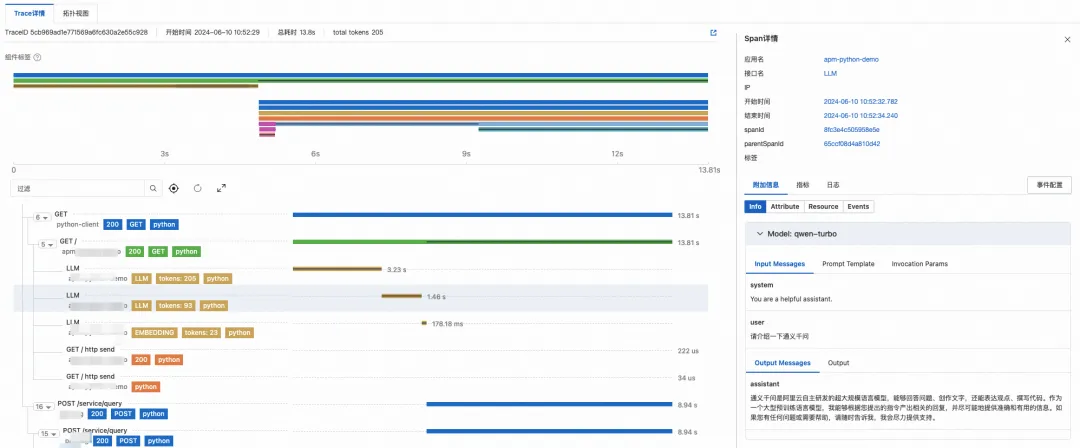
In summary, by analyzing the characteristics of the LLM field and defining the field-specific Trace semantics according to open-source standards, Alibaba Cloud application observability has developed a self-built Python Agent for LLM applications to achieve high-quality data collection, reporting, and standardized storage. It focuses on addressing customer pain points to build field-specific metrics dashboards and trace analysis views. By combining with end-to-end trace observability, it can provide developers with more efficient troubleshooting tools and detailed insights, which significantly improves the efficiency of troubleshooting and issue localization.
Use the Python SDK to observe LlamaIndex-based applications.
(1) Build a chatbot based on LlamaIndex
Refer to llama-index use cases construction
(2) Install the SDK
pip3 install aliyun-instrumentation-llama-index(3) Initialize instrumentation
from aliyun.instrumentation.llama_index import AliyunLlamaIndexInstrumentor

from opentelemetry import trace
from opentelemetry.sdk.resources import Resource, SERVICE_NAME, SERVICE_VERSION
from opentelemetry.sdk.trace import TracerProvider
from opentelemetry.sdk.trace.export import BatchSpanProcessor, ConsoleSpanExporter

resource = Resource(
    attributes={
        SERVICE_NAME: 'aliyun_llama_index_test',
        SERVICE_VERSION: '0.0.1',
        # "telemetry.sdk.language": "Python",
    }
)
provider = TracerProvider(resource=resource)
provider.add_span_processor(BatchSpanProcessor(ConsoleSpanExporter()))  # Output Trace in the console
trace.set_tracer_provider(provider)
AliyunLlamaIndexInstrumentor().instrument()
(4) Chat with the robot to trigger traffic
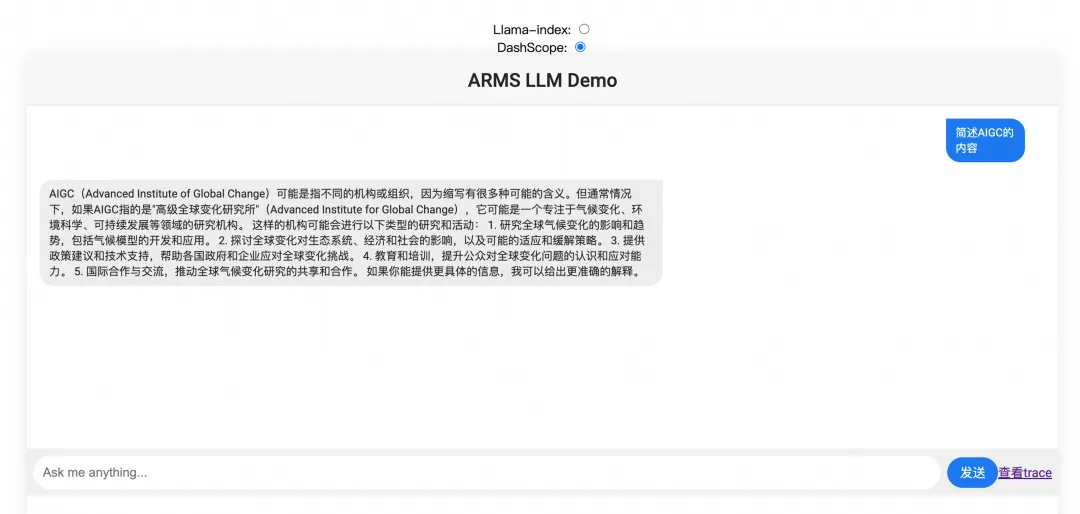
(5) View metrics and trace analysis
The use of large Q&A models carries certain risks, such as generating biased or false information, and their behavior can be unpredictable and difficult to control. Therefore, it is important to continuously monitor and evaluate the quality of input and output in order to mitigate these risks.
Alibaba Cloud LLM Application Observability will integrate vector database capabilities and utilize the semantic features provided by LLM Trace and evaluation-related analysis capabilities to further explore the rich content of LLM Traces. This will help developers quickly understand, receive risk alerts, and identify and locate issues. Alibaba Cloud Observability team will continue to track the latest technological advancements and practical business needs, providing more user-friendly and comprehensive LLM application observability solutions to ensure the continuous and stable operation of LLM applications and support the innovation and implementation of AI applications.
[1] Managed Service for OpenTelemetry
[3] Start Monitoring LLM Applications
Comprehensive Upgrade of SLS Data Transformation Feature: Integrate SPL Syntax
Achieve the Go Application Microservice Governance Capability Without Changing a Line of Code

212 posts | 13 followers
FollowAlibaba Cloud Native - August 14, 2024
Alibaba Cloud Native Community - September 12, 2023
Alibaba Cloud Native Community - April 15, 2025
Alibaba Cloud Native - March 6, 2024
Alibaba Cloud Native Community - November 20, 2025
Alibaba Cloud Native Community - September 4, 2025

212 posts | 13 followers
Follow Alibaba Cloud for Generative AI
Accelerate innovation with generative AI to create new business success
Learn More Tongyi Qianwen (Qwen)
Top-performance foundation models from Alibaba Cloud
Learn More Container Service for Kubernetes
Alibaba Cloud Container Service for Kubernetes is a fully managed cloud container management service that supports native Kubernetes and integrates with other Alibaba Cloud products.
Learn More Container Compute Service (ACS)
A cloud computing service that provides container compute resources that comply with the container specifications of Kubernetes
Learn MoreMore Posts by Alibaba Cloud Native