By Fandeng and Qianlu
This article is based on the speech given at KubeCon China 2023 and focuses on building a next-generation intelligent observability system based on eBPF.
Before we start, let me introduce ourselves. I am Kai Liu (Qianlu), head of Alibaba Cloud ARMS sub-products Kubernetes monitoring. This is my colleague Dr. Shandong Dong (Fandeng), head of Alibaba Cloud ARMS products AIOps.
This sharing mainly includes three parts. The first part discusses the observability challenges in Kubernetes.
With the rise of concepts such as cloud-native, Kubernetes, and microservices, our applications have undergone significant changes, including microservice transformation and containerization. While these changes bring numerous benefits such as extreme elasticity, efficient O&M, and standard runtime environments, they also present challenges for developers.
We collected over 1,000 Kubernetes tickets from the public cloud to understand the challenges developers encountered after migrating their infrastructure to Kubernetes. After analyzing the tickets, we identified three major challenges:
• Firstly, Kubernetes infrastructure issues are prominent, with network-related problems comprising over 56% of the issues. Developers need to determine what data the observability system should collect to identify the cause of these anomalies.
• Secondly, with a significant portion of application complexity moving to the infrastructure layer, we need to collect not just application metrics but also container and network observability data. The question then is how to gracefully collect this data within Kubernetes.
• Thirdly, after amassing such a vast amount of data, the crucial concern is how this information can be effectively used to assist developers in troubleshooting issues.
With these questions in mind, let's move on to see the data collection solution in Kubernetes.
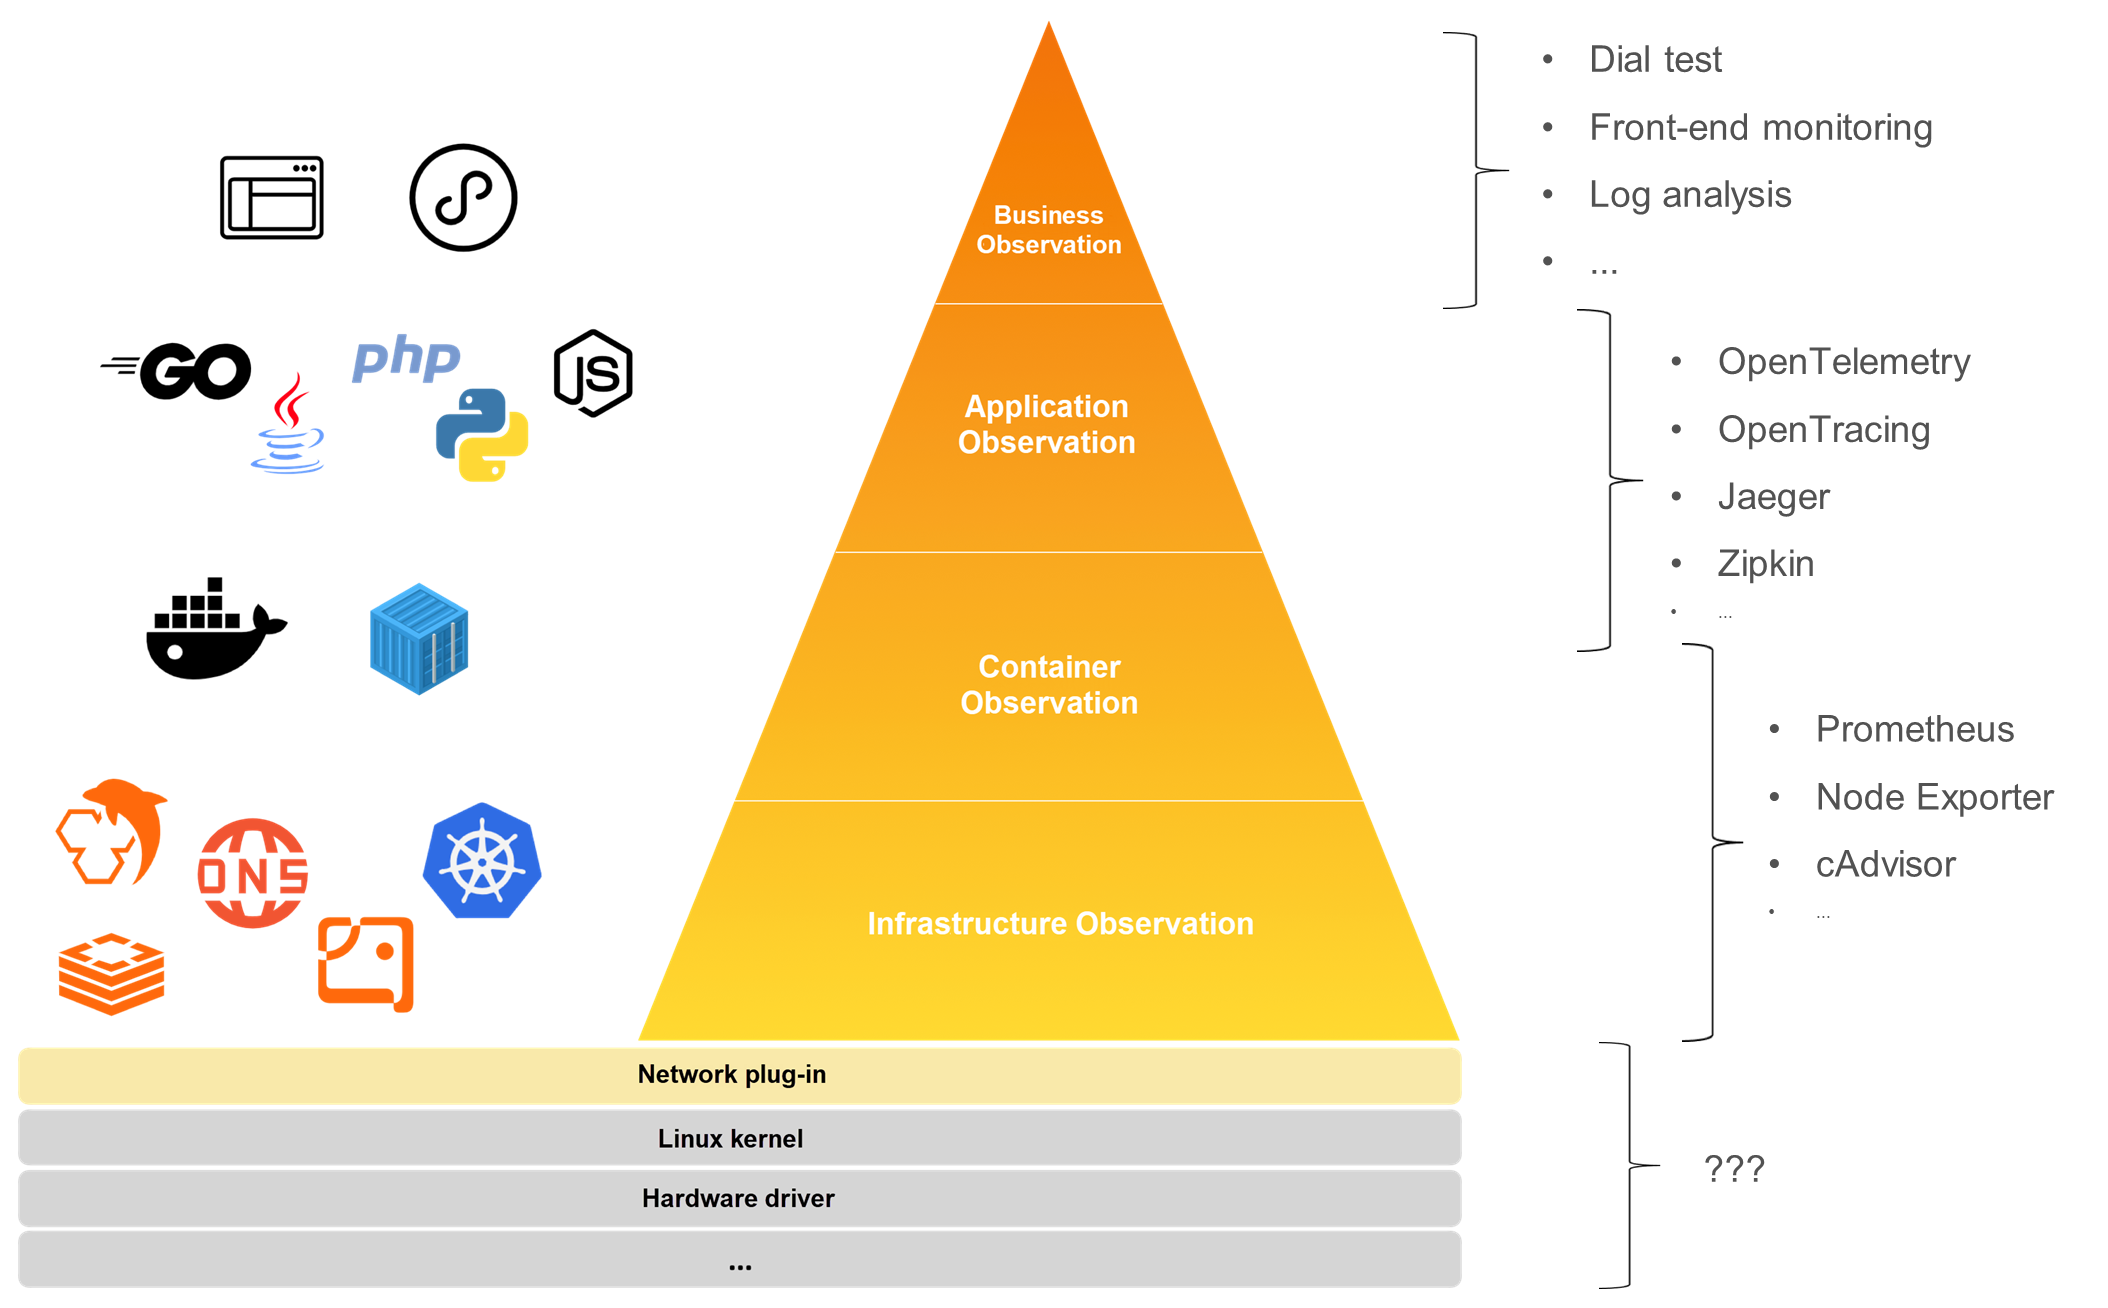
A typical Kubernetes application can be layered into multiple tiers. At the top, we have the business layer with front-end pages and applets, followed by the application layer that comprises backend applications. Further down is the container layer, which includes various runtimes such as containerd and Docker. Then we reach the infrastructure layer, which encompasses Kubernetes itself. But, does it end there? Actually, no. Since the complexity of Kubernetes applications extends to the infrastructure, we must delve deeper into network plugins, the Linux kernel, and possibly even hardware drivers. This brings us back to the first question posed earlier: What data should we collect in Kubernetes? The answer is all the data we can capture because a failure at any layer can cause anomalies in the overall system.
Moving on to the second question: How do we collect this data?
At present, there are many independent observability solutions for each layer. For example, in the business layer, you can use dial testing, front-end monitoring, and Currently, there are many separate observability solutions for each layer. For instance, in the business layer, you might utilize synthetic monitoring, front-end monitoring, and business log analysis. In the application layer, APM systems like OpenTelemetry and Jaeger are commonly used. For the container and infrastructure layers, Prometheus is used alongside various Exporters. However, as you dig deeper, traditional observability systems tend to fall short, leading to blind spots in visibility. Additionally, while many layers have their observability solutions, the data between them are not interconnected — they exist independently without a unified dimension to integrate data across layers, creating data silos.
So, is there a solution to these problems?
The answer lies in eBPF technology. But first, let's briefly introduce eBPF. eBPF is a virtual machine that runs inside the Linux kernel. It provides a specialized set of instructions and allows the loading of custom logic without the need to recompile the kernel or restart the application.
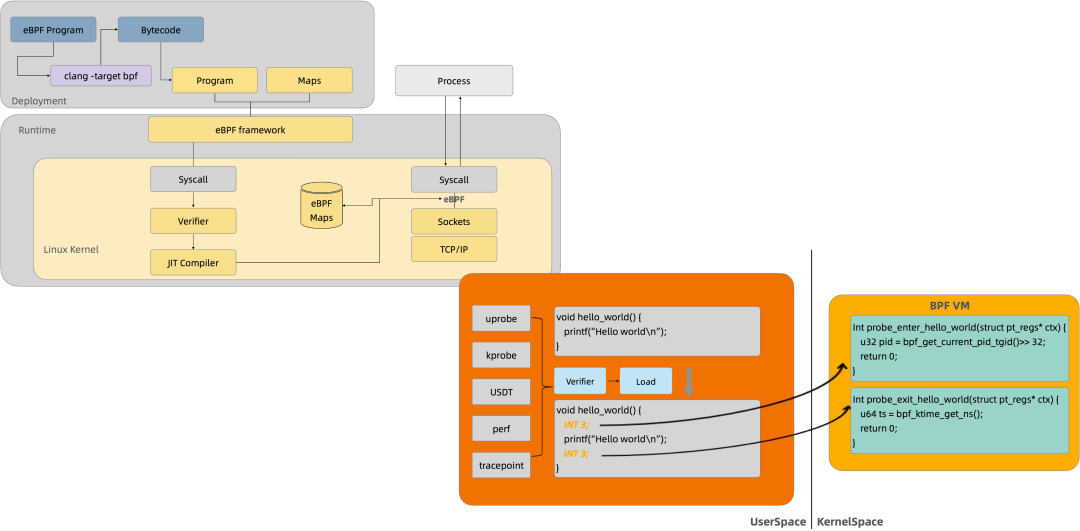
The diagram above shows the basic process of using eBPF. You need to write a piece of eBPF code and compile it into bytecode through a compiler. Then, you can use the BPF system call to mount this bytecode to the specified mount target. A mount target can be a system call, a kernel method, or even a user-space business code. For example, as shown in the lower right corner of the figure, you can dynamically mount the eBPF bytecode to the entry and return locations of the hello_world method, and collect the runtime information of the method through the eBPF instruction set.
The eBPF technology has three major characteristics.
First, it is non-intrusive. It is dynamically mounted, and the target process does not need to restart.
Second, it has high performance. The eBPF bytecode is jit into machine code and executed, which is highly efficient.
Third, it is more secure. It runs in its own sandbox and will not cause the target process to crash. It also has a strict verifier when loading, which ensures that the code is normal and there will be no issues such as a dead loop or accessing illegal memory.
| eBPF | APM Agent | |
| Intrusiveness | Non-intrusive | Intrusive |
| Coverage | Both the user state and the kernel state are covered. | Usually, only the user state is covered. |
| Performance overhead | Low | Relatively high |
| Security | High | Low |
This table compares the differences between eBPF and traditional APM agents. The eBPF technology has distinct advantages in coverage, intrusiveness, performance, and security.
How can we collect data based on eBPF? The first capability we build in eBPF is architecture awareness. Architecture awareness automatically analyzes the application architecture, running status, and network flow of clusters.
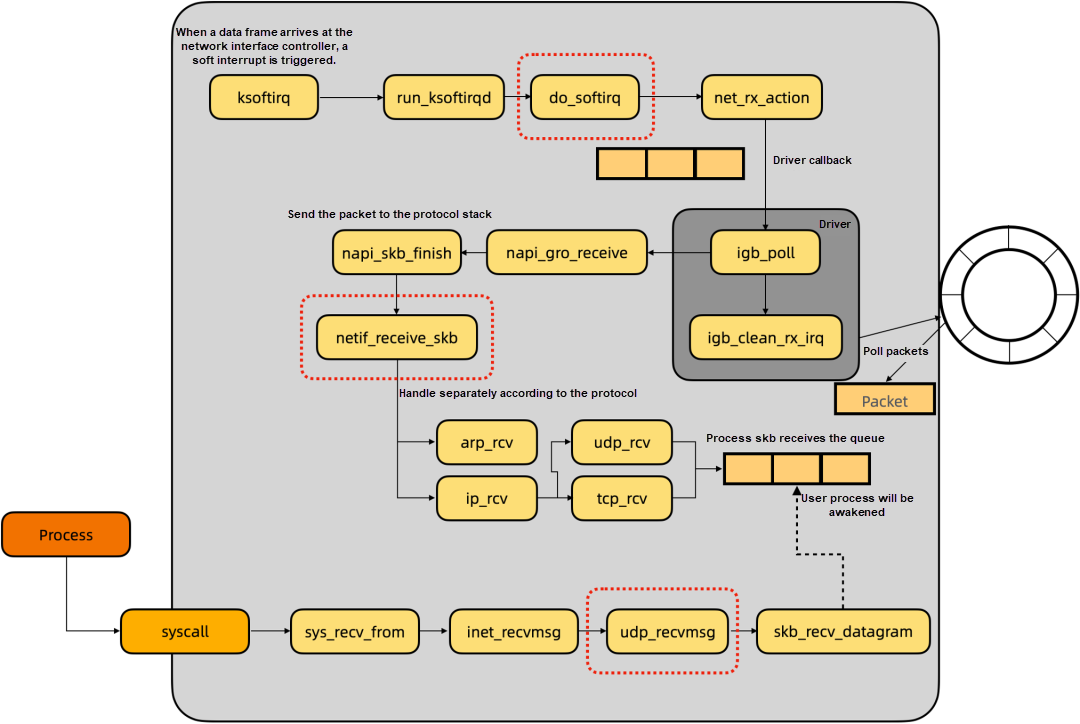
From a kernel perspective, communication between Kubernetes microservices is the packet forwarding process of the Linux network protocol stack. Let me take udp packet reception as an example to briefly introduce the packet receiving process. Starting from the upper left corner, when a packet arrives at the network interface controller (NIC), a soft interrupt is triggered. Then, do_softirq processes the soft interrupt and enters the net_rx_action method. The method is driven by the NIC and actively polls the NIC data.
After the data packet is received, it is delivered to the network protocol stack. This is netif_receive_skb, a critical method. Many packet capturing tools also work at this location. This method is based on the packet protocol, such as arp or ip, tcp, or udp. After different packet processing logics, it is put into the skb receiving queue of the user process. When the user process calls recvfrom syscall to initiate the packet reception, it reads the packet in the skb queue to the user space.
| Mount target | Introduction | Description |
| netif_receive_skb | Receive and process packets | Count the number of packets received |
| dev_queue_xmit | Send packets | Count the number of packets sent |
| udp_recvmsg | Receive udp packets | Count the size of received UDP packets |
| do_softirq | Trigger a soft interrupt | Record the soft interrupt delay |
| tcp_sendmsg | Send tcp packets | Count the size and direction of received TCP packets |
| tcp_recvmsg | Receive tcp packets | Count the size and direction of sent TCP packets |
| tcp_drop | Drop packets | Count the number of dropped packets |
| tcp_connect | Connect tcp | Count the number of connections |
| tcp_retransmit_skb | Handle tcp retransmission | Count the number of tcp retransmissions |
With this theoretical basis, we can review the architecture awareness. What it actually does is detect network flow direction and network quality. Therefore, we can observe some important kernel methods in the Linux packet forwarding path to achieve these goals.
This table lists some observation points, such as netif_receive_skb and dev_queue_xmit, which can count the number and size of data packets sent and received and the network flow direction. Methods such as tcp_drop/tcp_retransmit_skb can observe packet loss and retransmission and measure the network quality.
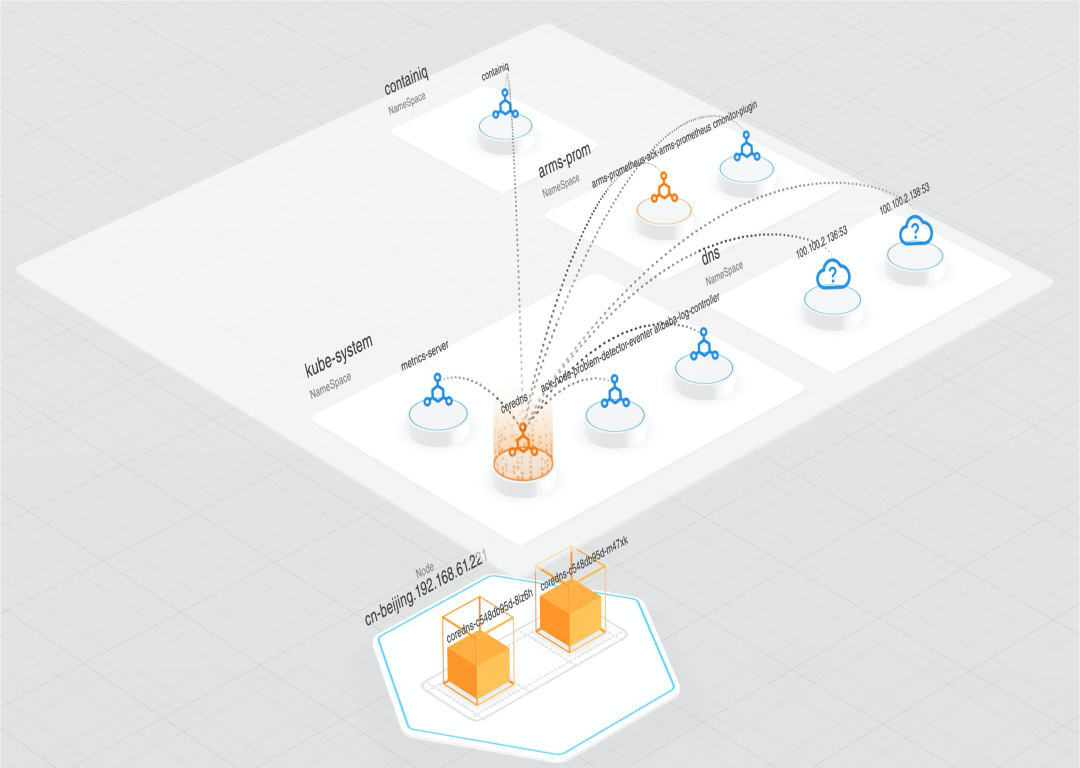
This page is a landing page for implementing architecture awareness in our product. Through this chart, we can clearly see an overview of the cluster, the network flow direction, topology information, and the status of each node. In the chart, there are two nodes highlighted in orange, indicating issues with their network status. This could be due to an increase in packet loss or retransmission. Yet, what impact will this have on the application layer?
Next, we introduce the second capability that we built: an application performance observation. While architectural awareness primarily gauges infrastructure health from the transport layer, in our day-to-day development, we often seek insights from the application layer. For instance, we may want to know if there's an increase in 4XX or 5XX errors in our HTTP service or if there's a rise in processing delays.
So, how can we observe the application layer? First, let's analyze the call process between Kubernetes applications. Usually, an application calls a third-party RPC library, which then calls a system call in the third-party library and then enters the kernel, passing through the transport layer, and network layer, before being sent through the NIC driver.
Traditional observability probes usually implement event tracking in the RPC library. This layer is influenced by the programming language and communication framework.
On the other hand, eBPF, similar to traditional APM, can select the same mount target in the RPC library to collect data using uprobe. However, due to the numerous eBPF mount targets, we can also implement event tracking in the infrastructure, such as the system call layer, IP layer, or NIC driver layer. This way, we can intercept the byte stream sent and received by the network, and analyze the network request and response through protocol analysis to obtain service performance data. The advantage of this method is that the network byte stream is decoupled from the programming language, meaning we don't have to adapt to the implementation of different languages and frameworks for each RPC protocol, significantly reducing development complexity.
| Location | Protocol parsing | Mounting overhead | Pre-processing of packets | Stability of mount targets | Process information |
| uprobe | Not required | High | Not required | Unstable | Yes |
| tracepoint for syscall | Required | Low | Not required | Stable | Yes |
| kprobe for kernel function | Required | Low | Required | Relatively stable | Yes for some |
| raw socket | Required | Low | Not required | Stable | No |
| xdp | Required | Low | Required | Stable | No |
The table above compares the advantages and disadvantages of different mount locations. As shown, implementing event tracking in the system call is a better solution. This is because the syscall has process information, which is convenient for us to correlate the metadata of some containers upward. Moreover, the mount target of the syscall is stable and incurs low overhead.
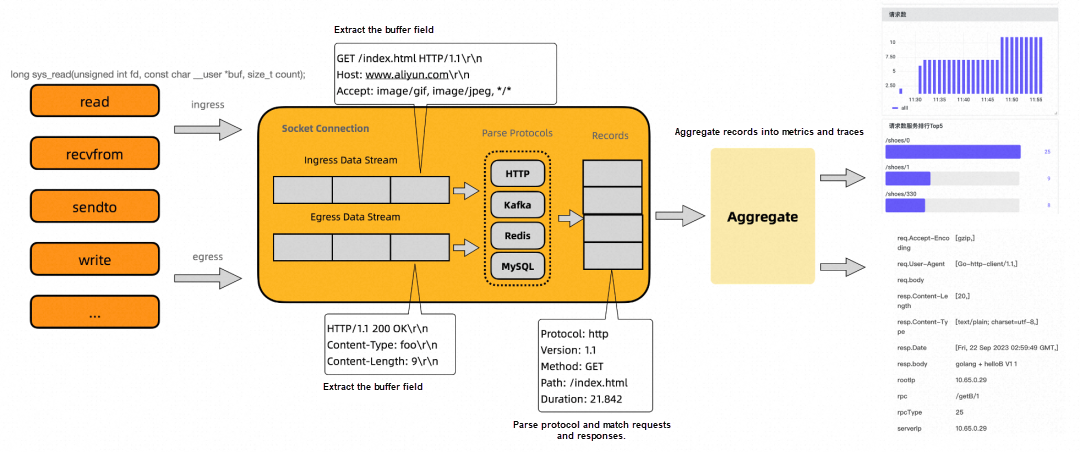
After determining the mount location to be the syscall, let me briefly introduce the principle of analyzing service performance.
Take the Linux system as an example, syscalls for data read and write can be enumerated, such as read, write, sendto, and recvfrom. Therefore, we choose to attach eBPF bytecodes to these syscalls to obtain the application layer information of data read and write. For example, suppose you are observing an HTTP service, and you have collected the received data in the preceding example by reading event tracking and the sent data in the following example by writing event tracking.
Then, the data received and sent go to the protocol parser respectively. The protocol parser parses data according to the standards of the application protocol. For example, the HTTP protocol stipulates that the format of the first line in the request lines is the method, path, and version, and the format of the first line in the response lines is the version, status code, and message. Then, you can extract that the method of this HTTP request is Get, the path is /index.html, and the response status code is 200. In addition, based on the time when reading and writing are triggered, the processing delay from the time when the server receives the request to the time when it returns the response can be calculated.
After extracting this key information and aggregation processes, you can export the service data to the observability platform.
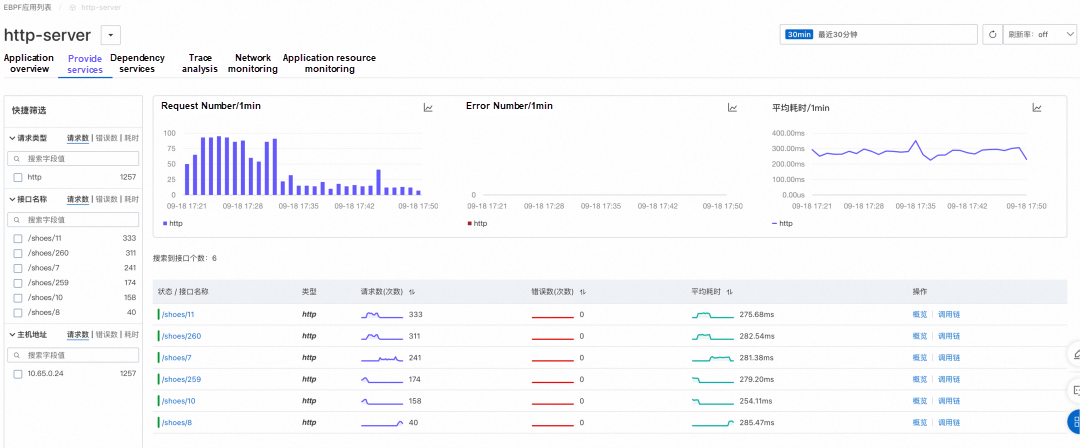
The figure above is a landing page for application performance observation in our product. From this figure, we can use the non-intrusive eBPF to observe the three golden indicators of HTTP Server service: number of requests, number of errors, and average latency. You can also see the problem of the decreased request number. Why would this happen? This may be caused by some exceptions, but you cannot figure out the cause in the figure.
Therefore, we need the third capability: multidimensional data correlation. As mentioned earlier, we have corresponding solutions for each layer in Kubernetes applications, but they cannot integrate with each other. In other words, they lack a unified correlation dimension. For example, the container observation data usually contains the dimension of the container ID, such as the CPU or memory usage of a container. For the Kubernetes resource observation data, there is the dimension of Kubernetes entity, such as the pod or deployment. For the application performance monitoring, take some traditional APM platforms for example, the data usually have dimensions such as ServiceName or trace ID. There is no unified dimension to correlate them, thus the failure to integrate the observation data.
How to integrate these data? eBPF is a useful tool because it runs in kernel mode and can collect some additional information. To give a few examples, first of all, let's say mount targets for some process classes. In this case, eBPF can collect some process numbers and information such as the PID namespace when mounting. The information is then combined into a runtime of the container, and you can easily analyze its container ID. In this way, you can complete the integration with container data.
Another example is some network-related mount targets. You can use eBPF to collect the trituple of skb: the address of the requesting end, the address of the opposite end, and its network namespace. Through this address information, you can check the Kubernetes API Server and decide which Kubernetes entity it belongs to, thus completing the integration of Kubernetes resources.
Finally, the data for application performance monitoring. Generally, the APM system carries trace context such as serviceName and trace ID into some fields in the application layer protocol. Then, when eBPF performs protocol parsing, you can additionally parse these data, and complete the correlation of this layer. For example, HTTP uses headers to carry trace context information.
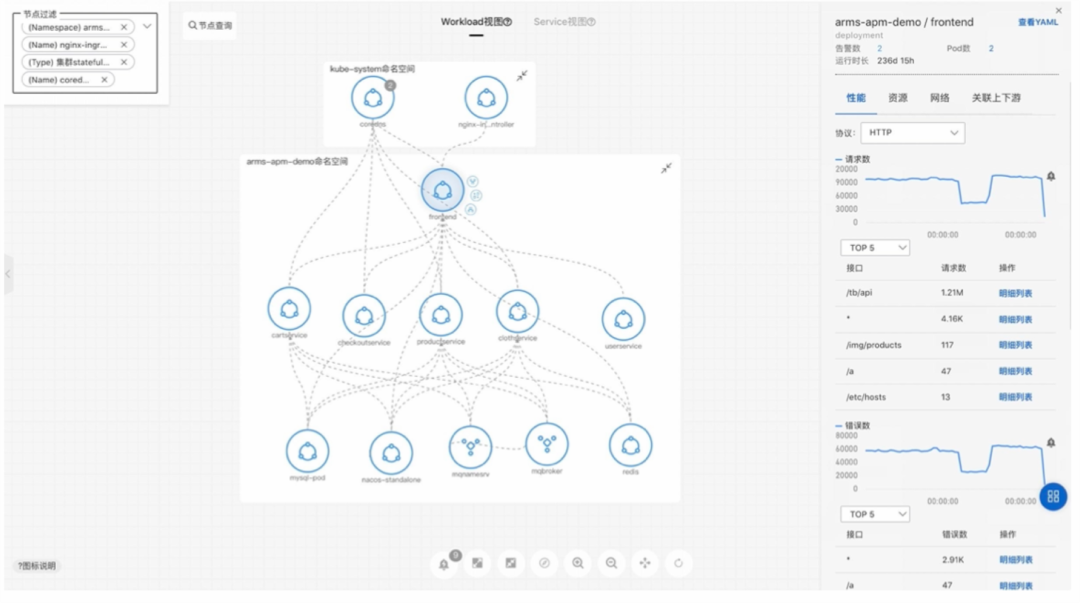
Next is the landing of our products. The figure above shows the integration of architecture awareness with application layer data.
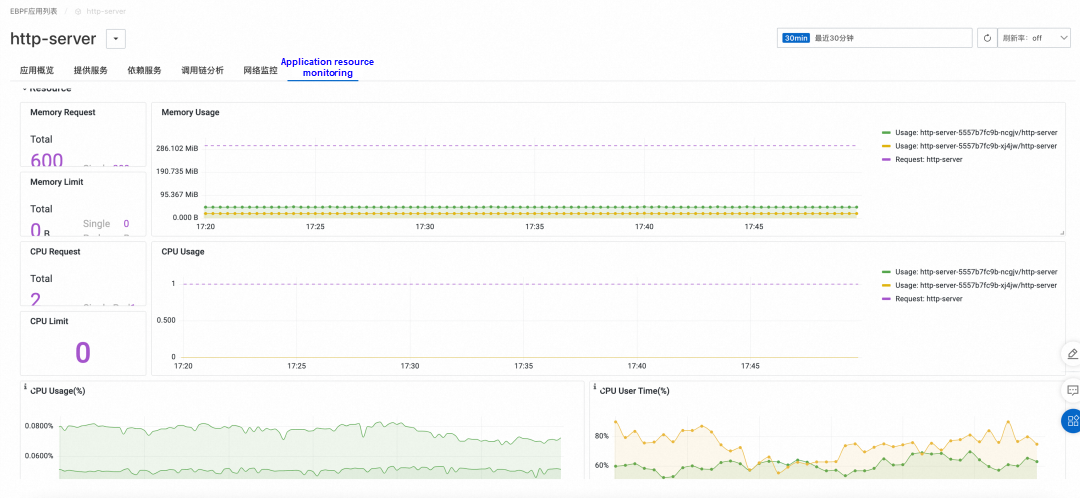
The figure above shows the integration of Kubernetes resources and container observation data.
The preceding content addresses the two major questions mentioned earlier: what data to collect and how to collect the data. Then we go to the third question: after collecting these data, how to use them for fault locating? My colleague Dr. Shandong Dong will continue to share this part with you.
Good afternoon, everyone. I'm Shandong Dong. Thanks to Qianlu for his introduction and sharing. Qianlu has detailed the observability challenges in Kubernetes and introduced the method of using the eBPF technology for data collection and correlation. Now I am very happy to explore with you the practice of fault locating in Kubernetes.
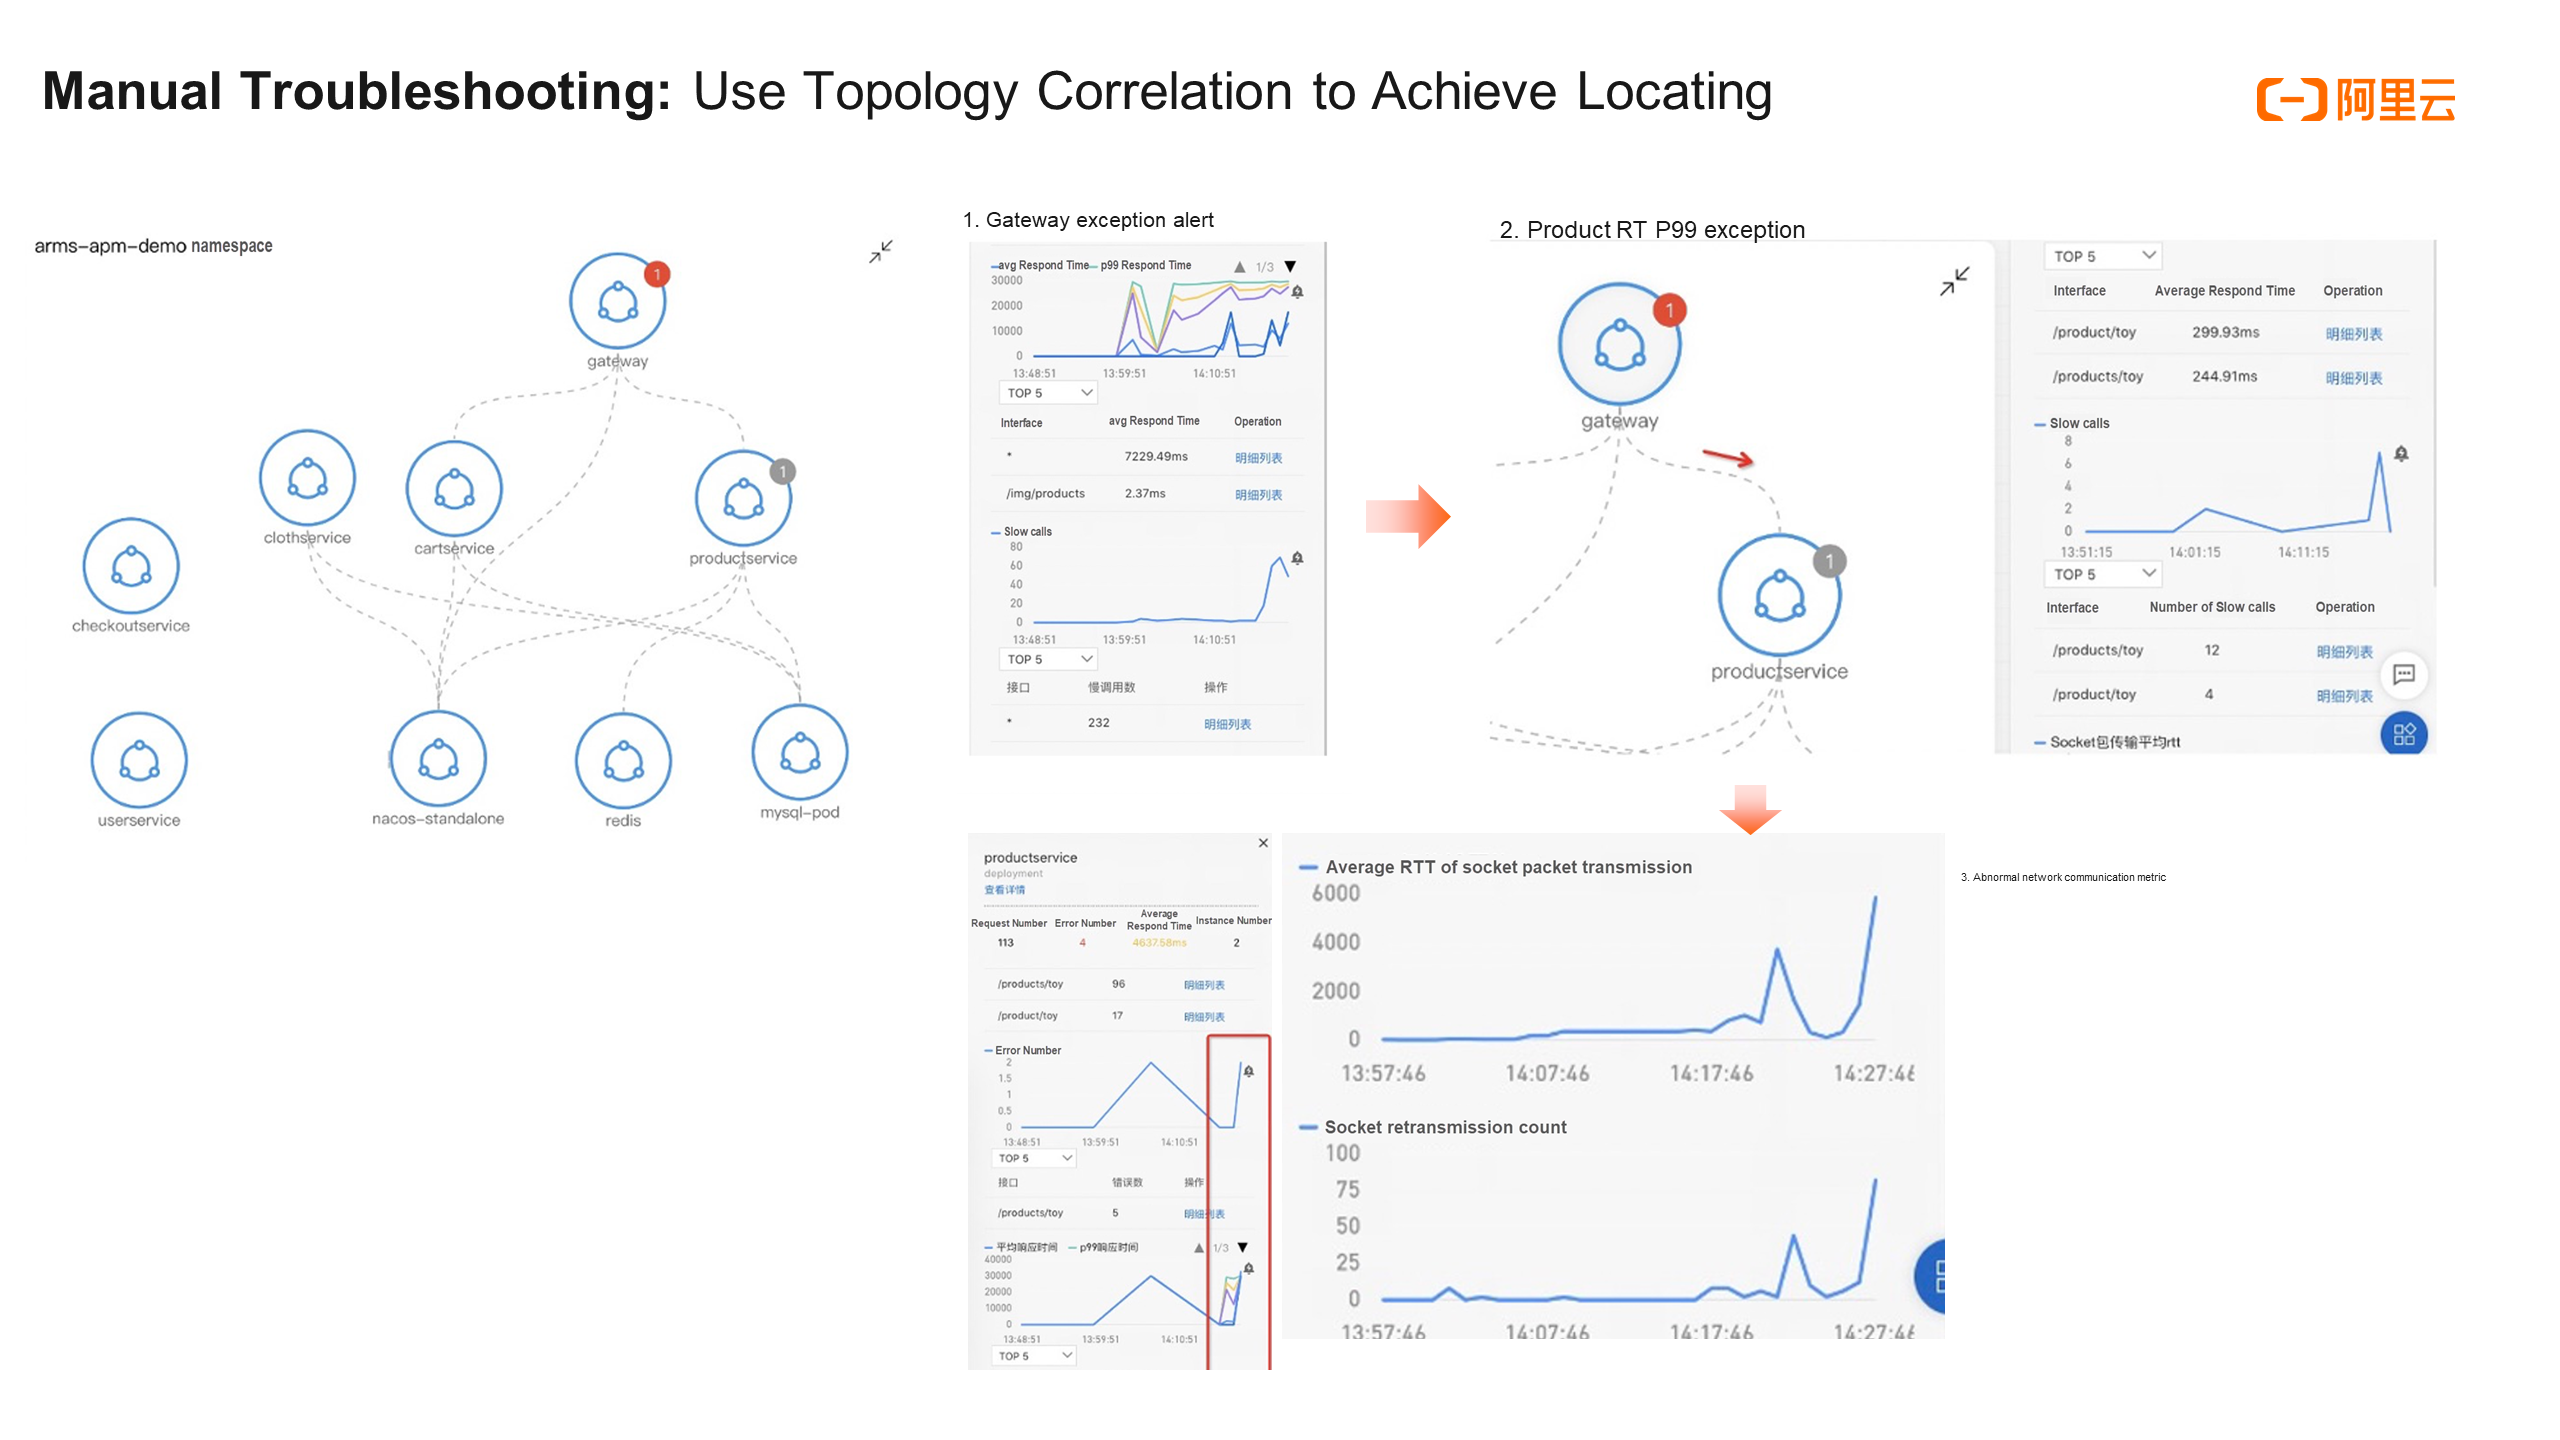
First, let's take a look at a path for manual troubleshooting in ARMS Kubernetes monitoring. Assume that there is a network slow call fault from the gateway to the product service. How can we find and troubleshoot this usually? First, we have alerts for ingress applications and key applications, such as the three golden metrics of applications: RT (average response time), error rate, and queries per second (QPS). When an alert is received, we know that an exception occurs in the gateway application. However, how can we know where the cause is located? Is it a problem in the downstream node or is it a network problem?
First, we need to pay attention to the gateway service node in the topology on the left. A sudden increase in RT and a slow call indicator can be seen.
When we click downstream nodes of the gateway along this topology, including cart service, nacos, and product service, we find that only the golden metrics of the product service are similar to the metrics of the ingress gateway. It can be preliminarily determined that the fault may occur on the trace from the gateway to the product service. Next, repeat this action and continue to analyze the downstream nodes of the product service. We can find that its downstream nodes are normal.
Finally, we can confirm whether there is any problem with the network call from the gateway to the product service. Click the dotted line in the figure (the network call edge from the gateway to the product service) to see the metrics of the network call, such as the number of packet retransmissions and the average RT. It is found that these two metrics also experience a similar sudden increase.
In summary, based on the manual operation and analysis of the topology, it can be preliminarily determined that the fault occurs on the trace from the gateway to the product service, and is also related to the two metrics of the network call. It is probably a network problem.
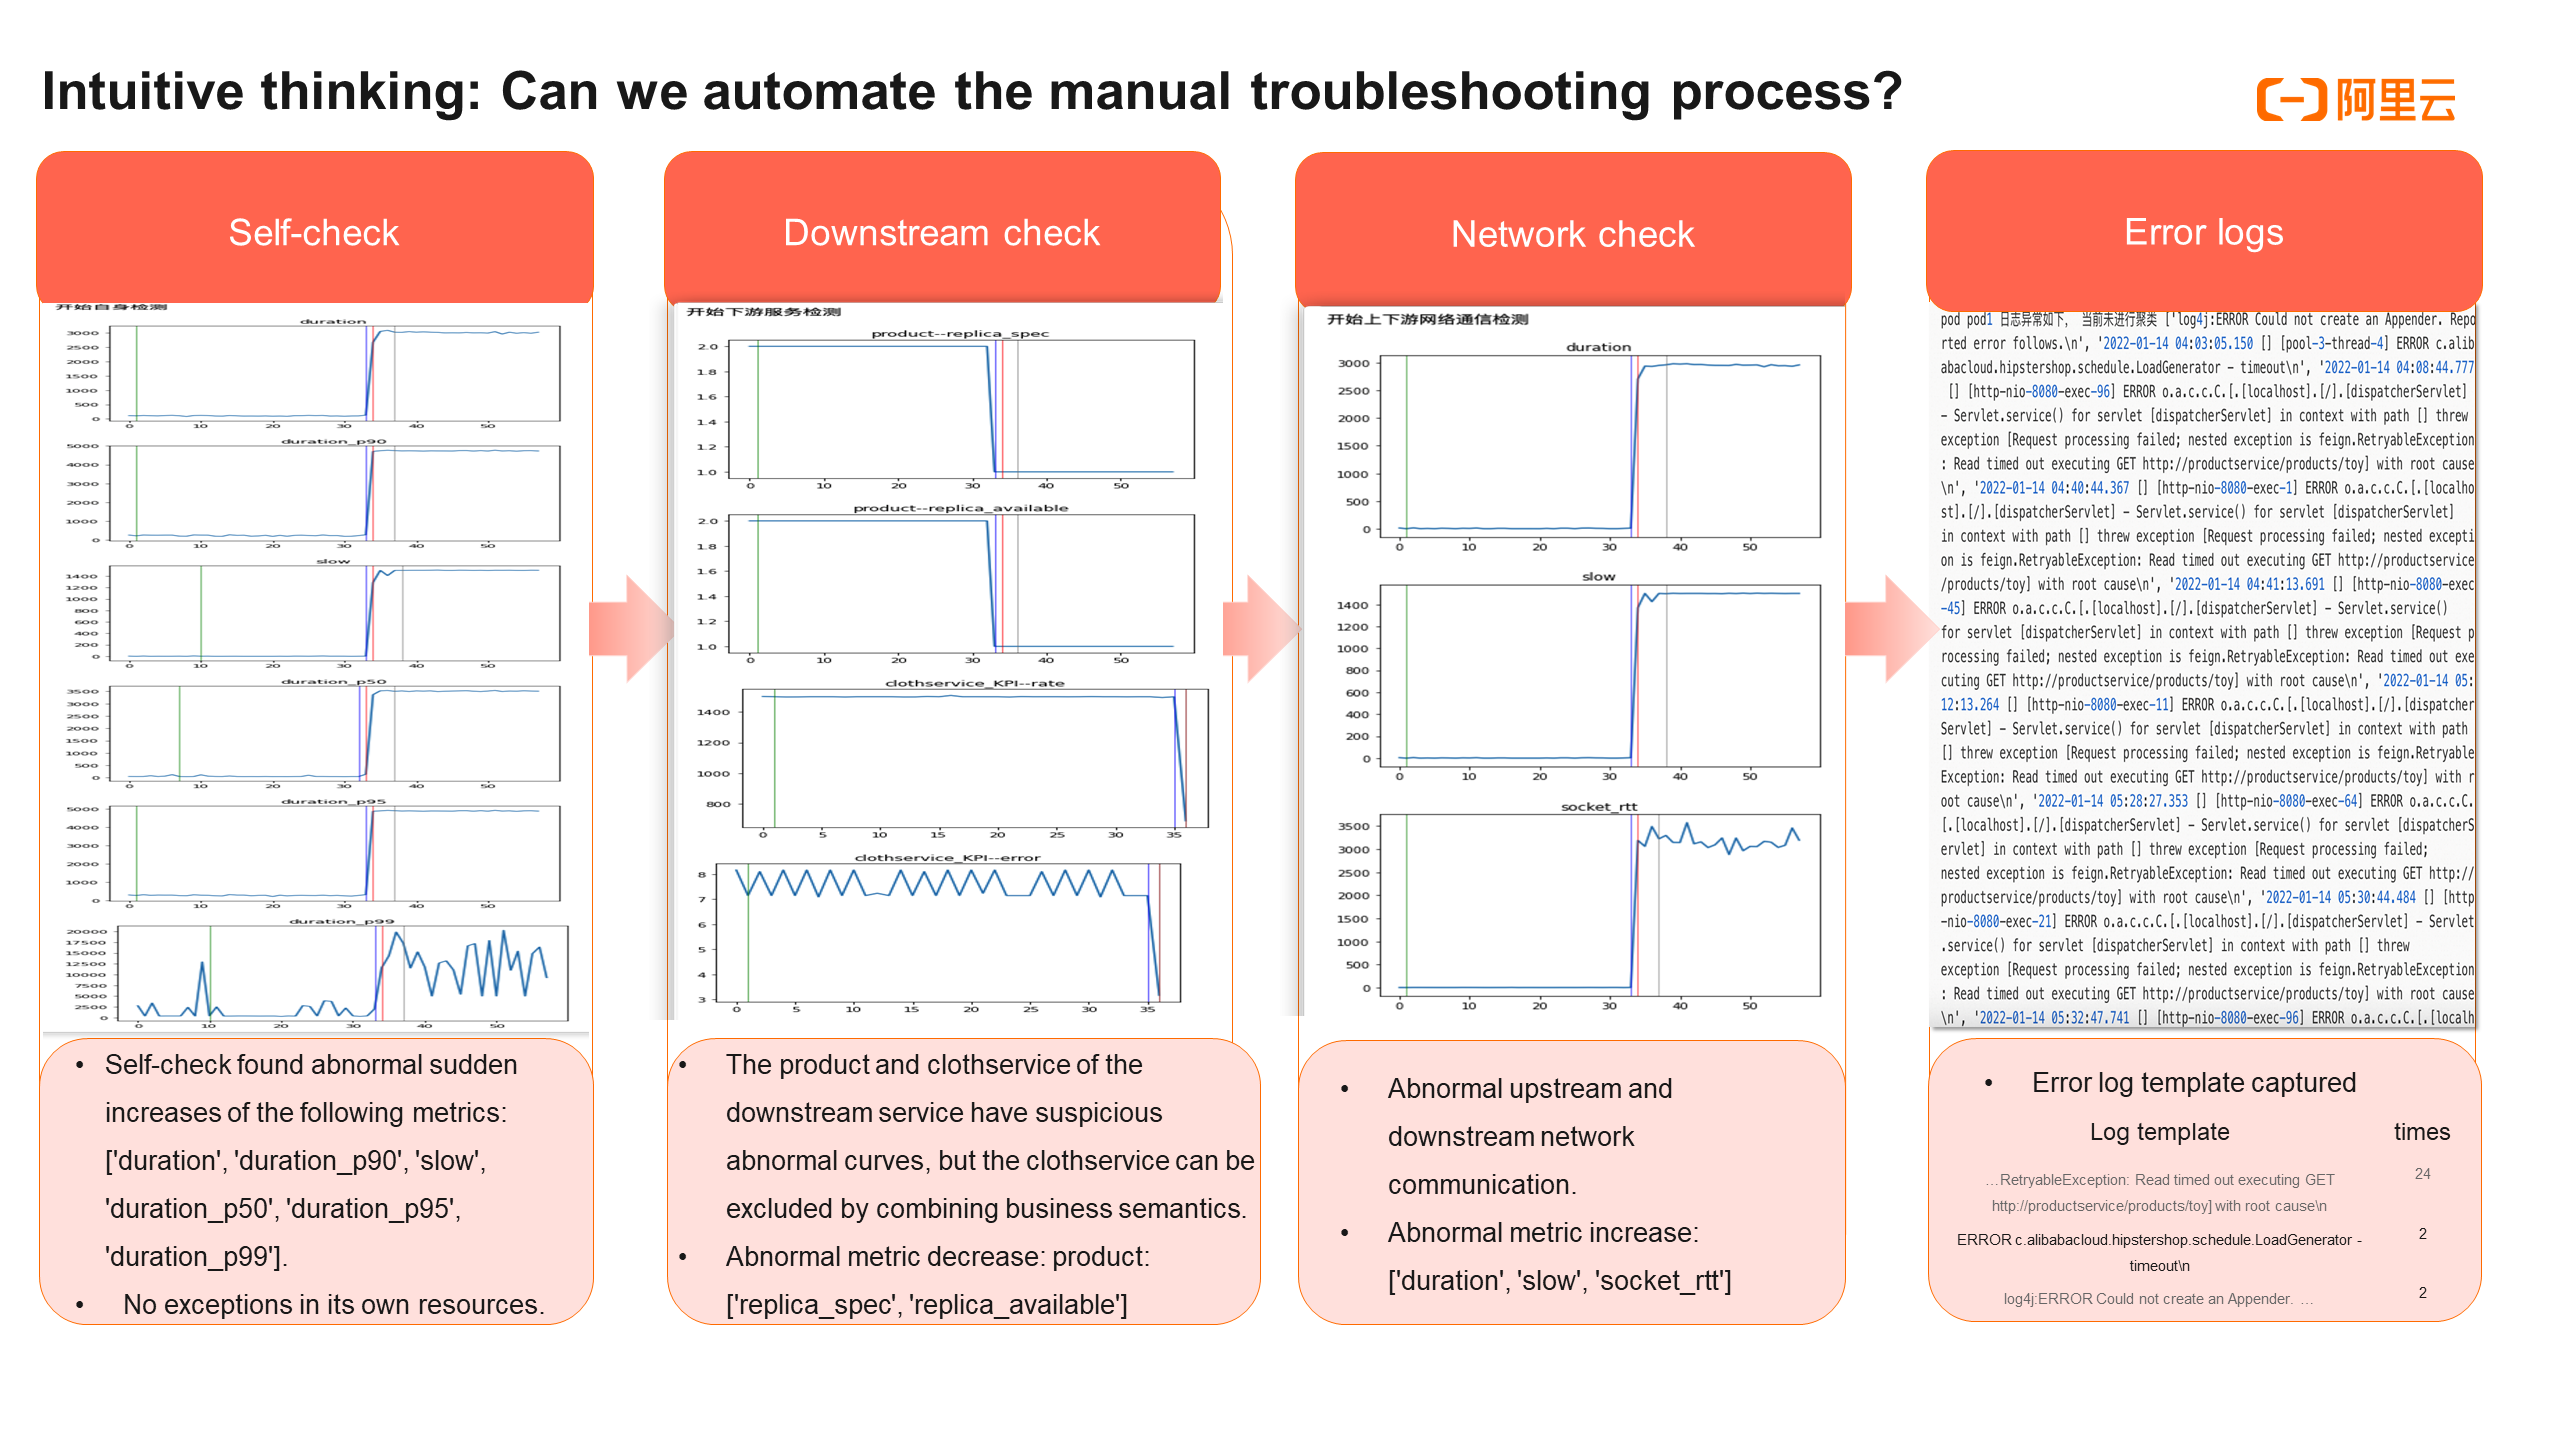
The path of manual troubleshooting is of great reference value for us to do intelligent root cause locating. We may intuitively think about automating the above process.
We can first check the service metrics of the gateway. It is found that the RT in the three golden metrics shows an abnormal surge, and its resource metrics, such as CPU, memory, and disk usage, are normal. This indicates a problem with its own service metrics.
Then, we can obtain the corresponding downstream nodes through the topological relationship. It is similar to the method used to check the gateway: go to check whether the three golden metrics of the service and resource metrics in all downstream nodes are abnormal. We find that only the product service in the downstream nodes is abnormal. Though the error rate of clothservice also shows a negative correlated decline, it is not abnormal from the business perspective and can be eliminated when combined with business semantics.
Finally, we can check whether there is a problem with the network call of the service. A similar exception is found in the network metrics of the gateway call product service. So far, the process of manual analysis has already been automated.
Further, we can analyze the logs. For example, we can use a log template to perform pattern recognition of logs in error service nodes and extract them. We can find that there are 24 timeout error logs in the product service interface. After summarizing the key error logs, the automated analysis process and results, as well as the template information and number of error logs, are output as check reports and sent to O&M experts. Experts can achieve intelligent auxiliary locating with the help of this information.
Is that the end of the story?
If we review the whole process, we can find that what we do is just an exception scanning of the whole system. We put all the exception information together and provide it to O&M experts. Can we further deduce the root cause directly? This is the first reflection.
The second reflection is that since the whole set of methodologies is applied in Kubernetes monitoring scenarios, can we extend it to application monitoring, front-end monitoring, business monitoring, and even infrastructure monitoring? Can we use the same algorithm model to suit different monitoring scenarios?
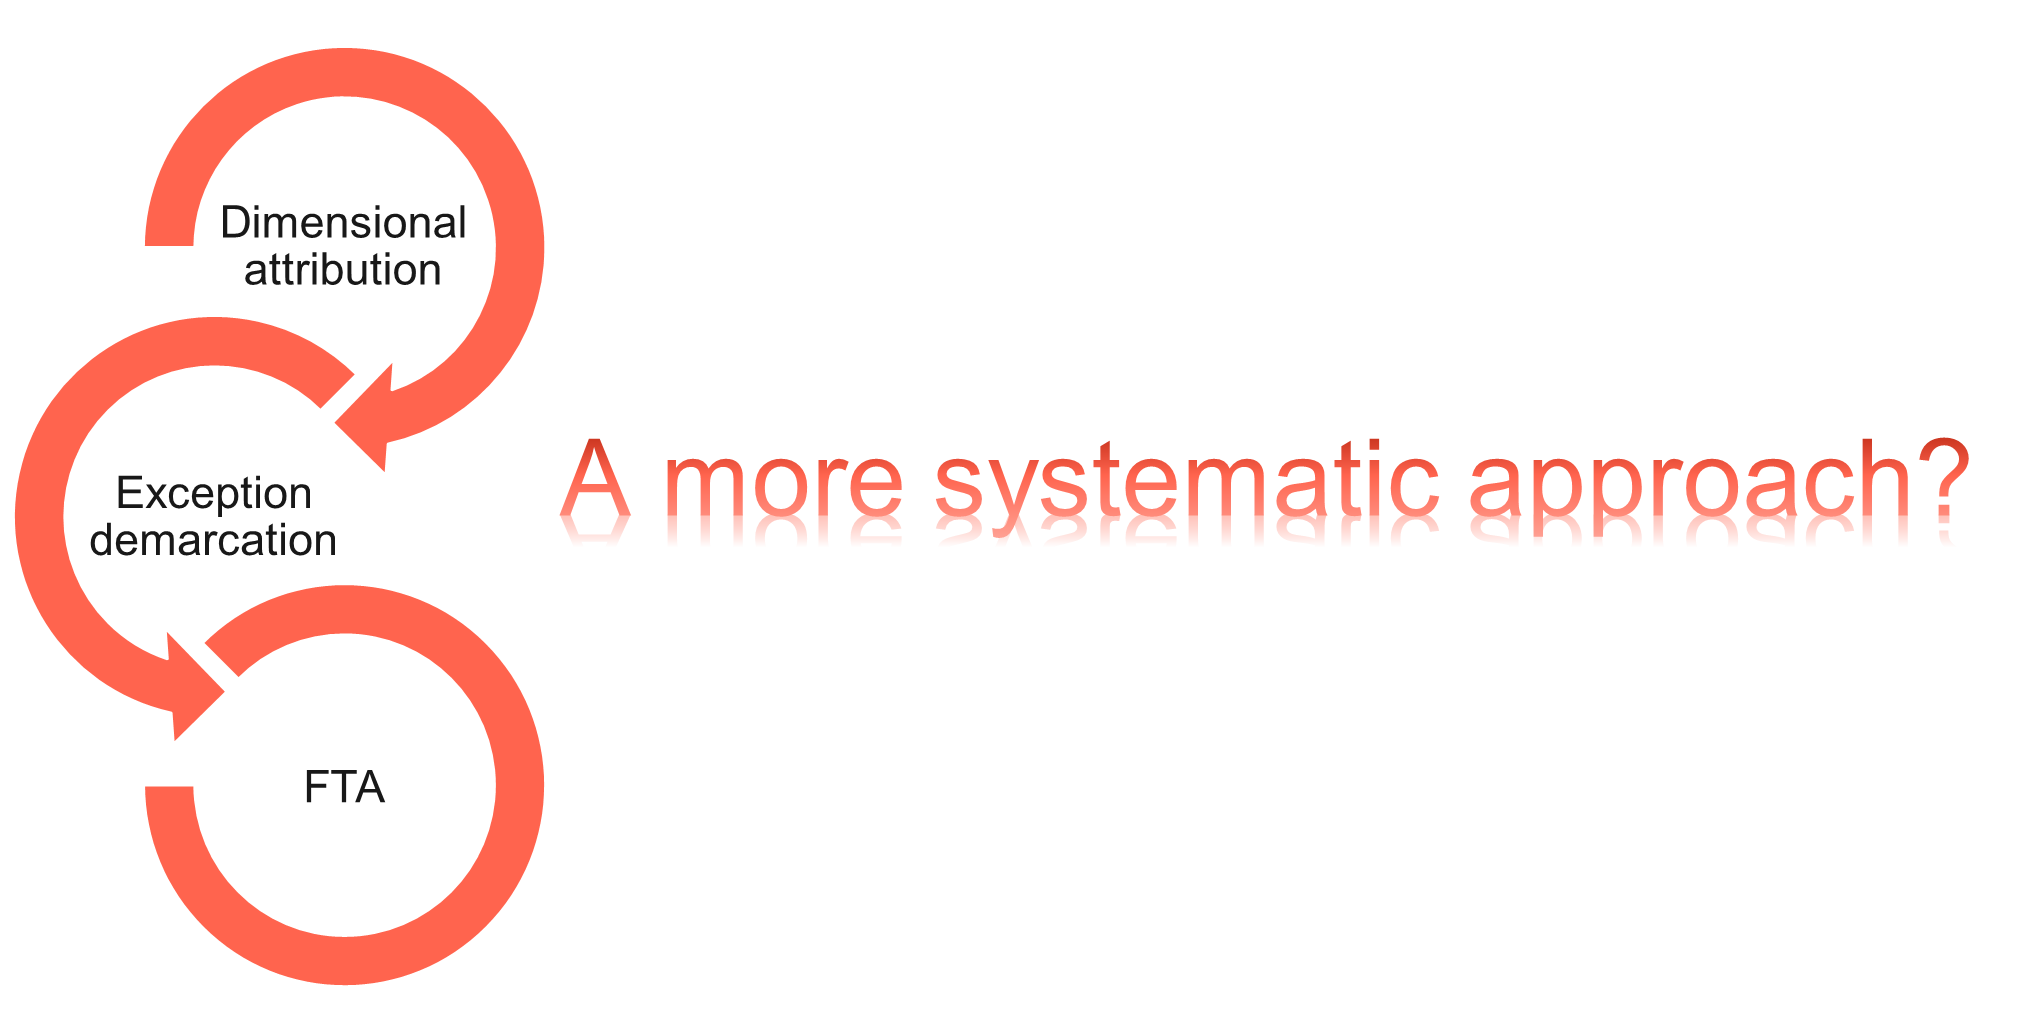
In summary, the answer we give is the three steps on the left of the figure above, which are dimensional attribution, exception demarcation, and FTA (fault tree analysis). Let's look at these three core steps in detail.
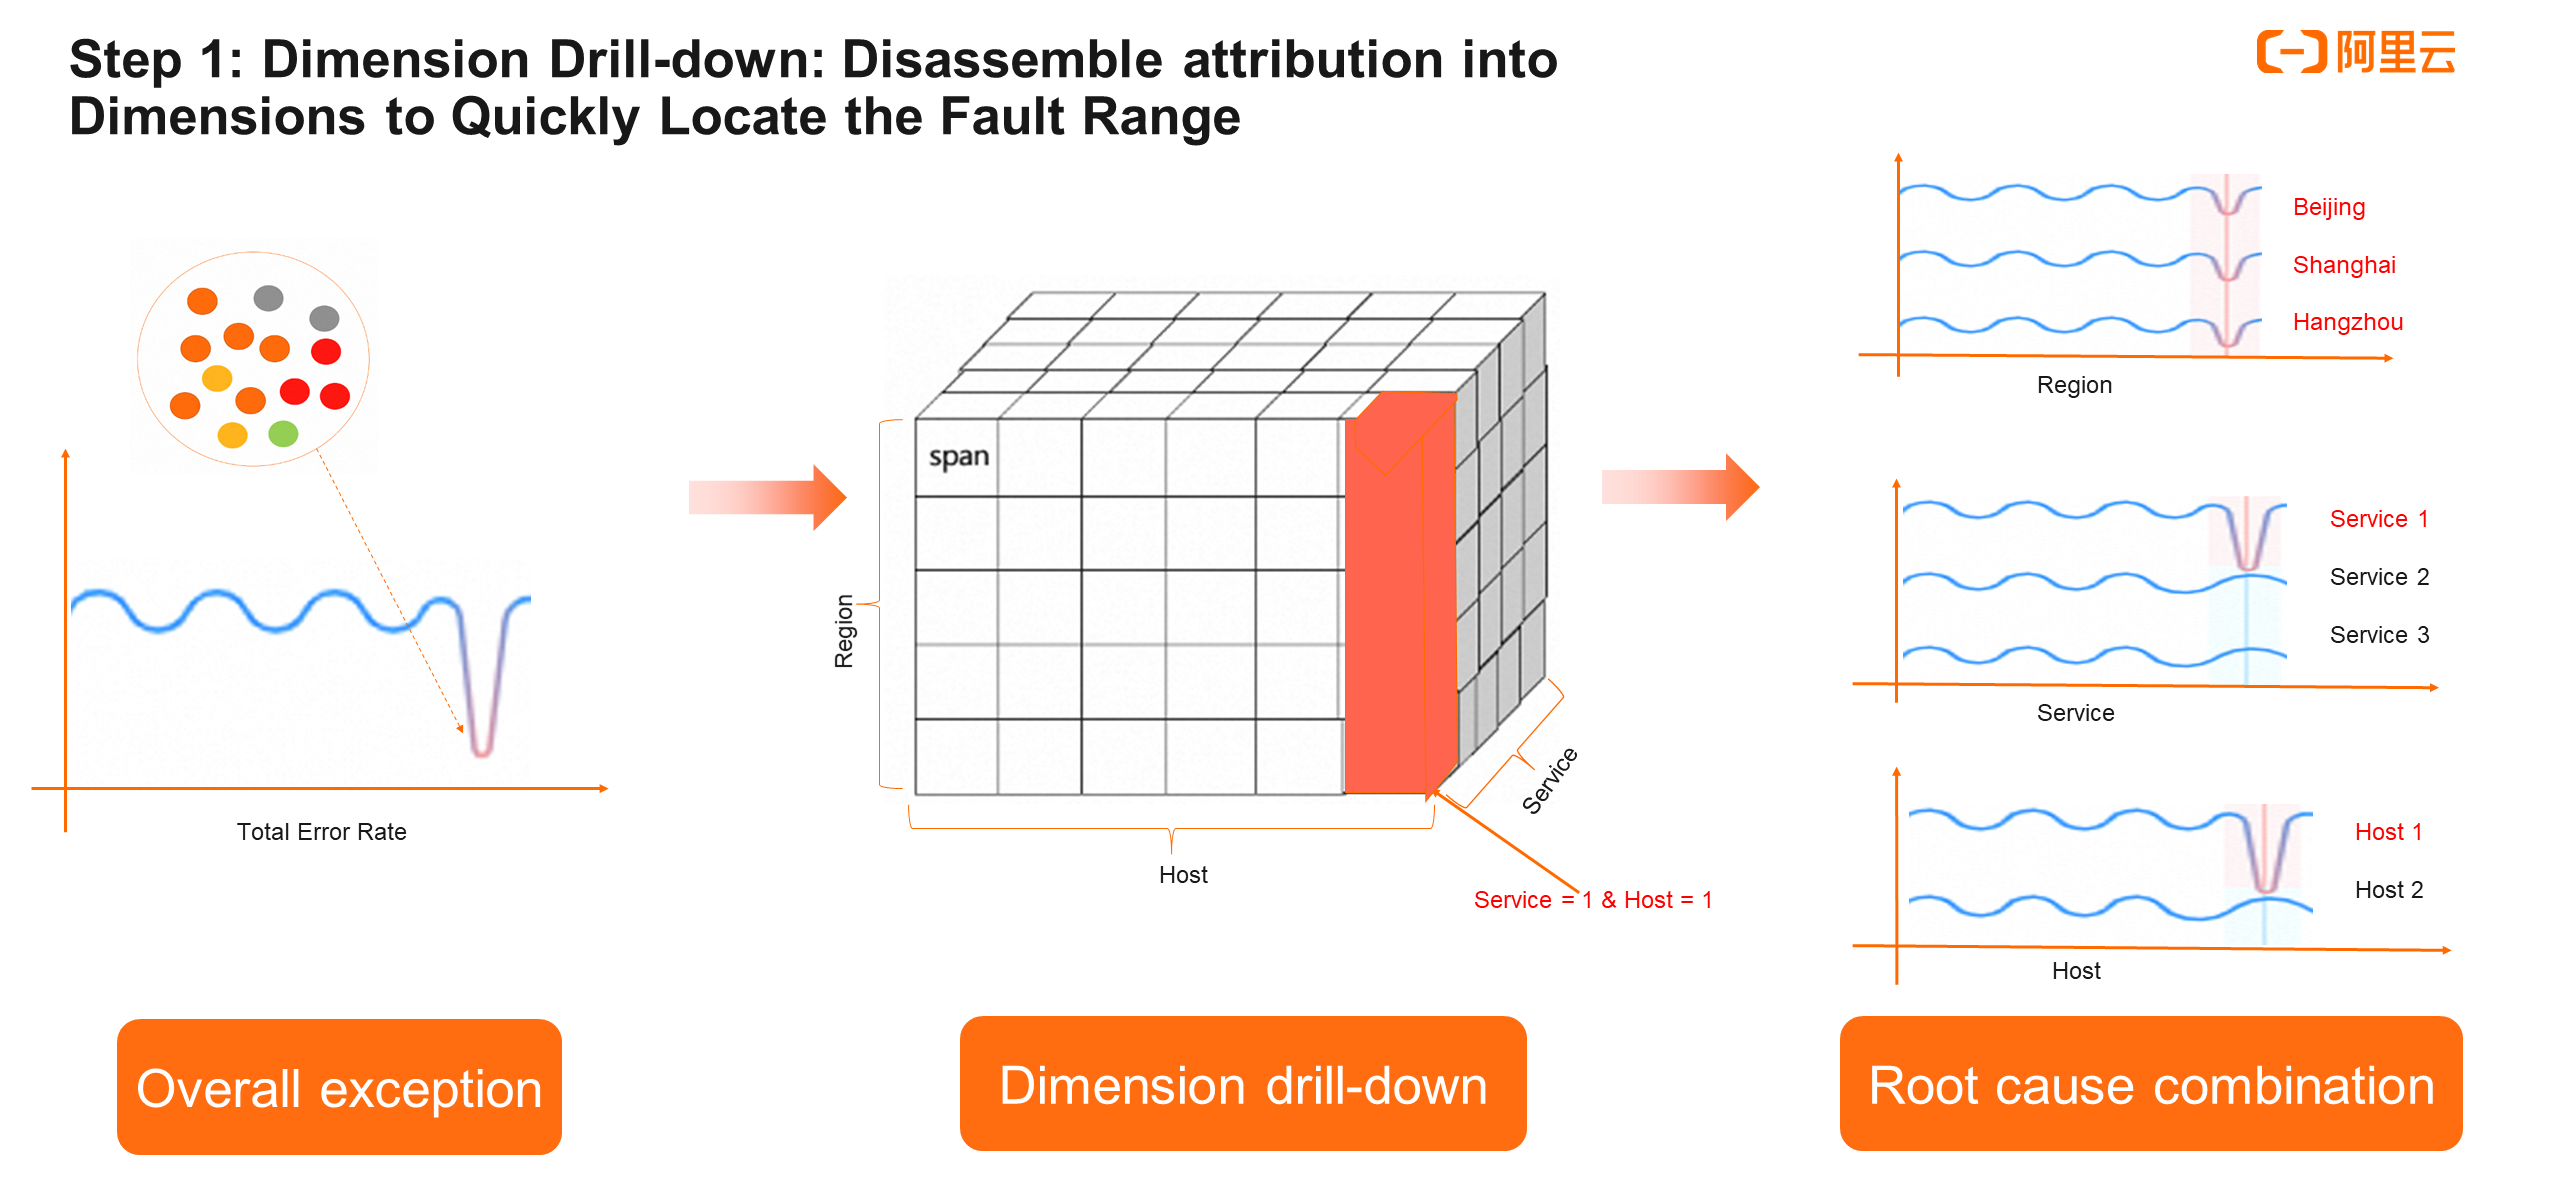
Step 1 is the dimensional attribution, or dimension drill-down analysis. Why do we perform a dimension drill-down analysis?
From the gateway, we know that it has three downstream nodes, so we need to traverse to view the three nodes. With dimensional attribution, however, we can analyze the metrics of the gateway to find the downstream problem lies in the product service.
The common dimension drill-down practice in the industry is to figure out which dimension causes the fault after the overall metrics encounter an exception. The overall metrics are grouped by individual dimension values. For example, for the overall error rate metric, the dimensions include service, region, and host. Each dimension has multiple values. For example, the region dimension includes Beijing, Shanghai, and Hangzhou.
When the overall metrics encounter an exception, drill-down analysis is performed on each dimension to determine which dimension and which value causes the exception. In the process of analyzing each dimension, it is found that all values of some dimensions (such as region) are abnormal, while partial values of other dimensions (host, service) are abnormal. We need to pay special attention to the latter. Through single-dimension drill-down locating, we can know which values are abnormal in each dimension.
Then, we can combine abnormal dimensions and values to achieve the leap from single-dimension analysis to combined-dimension analysis. For example, if the value of the host and the value of the service have an intersection (the abnormal value is both host1 and service1), we can combine the two to determine the root cause. The combined dimension is host1 & service1.
In summary, through single-dimension drill-down analysis and combined-dimension analysis, we can find the specific dimensions and values that cause the overall metric exception, thus quickly narrowing the fault range.
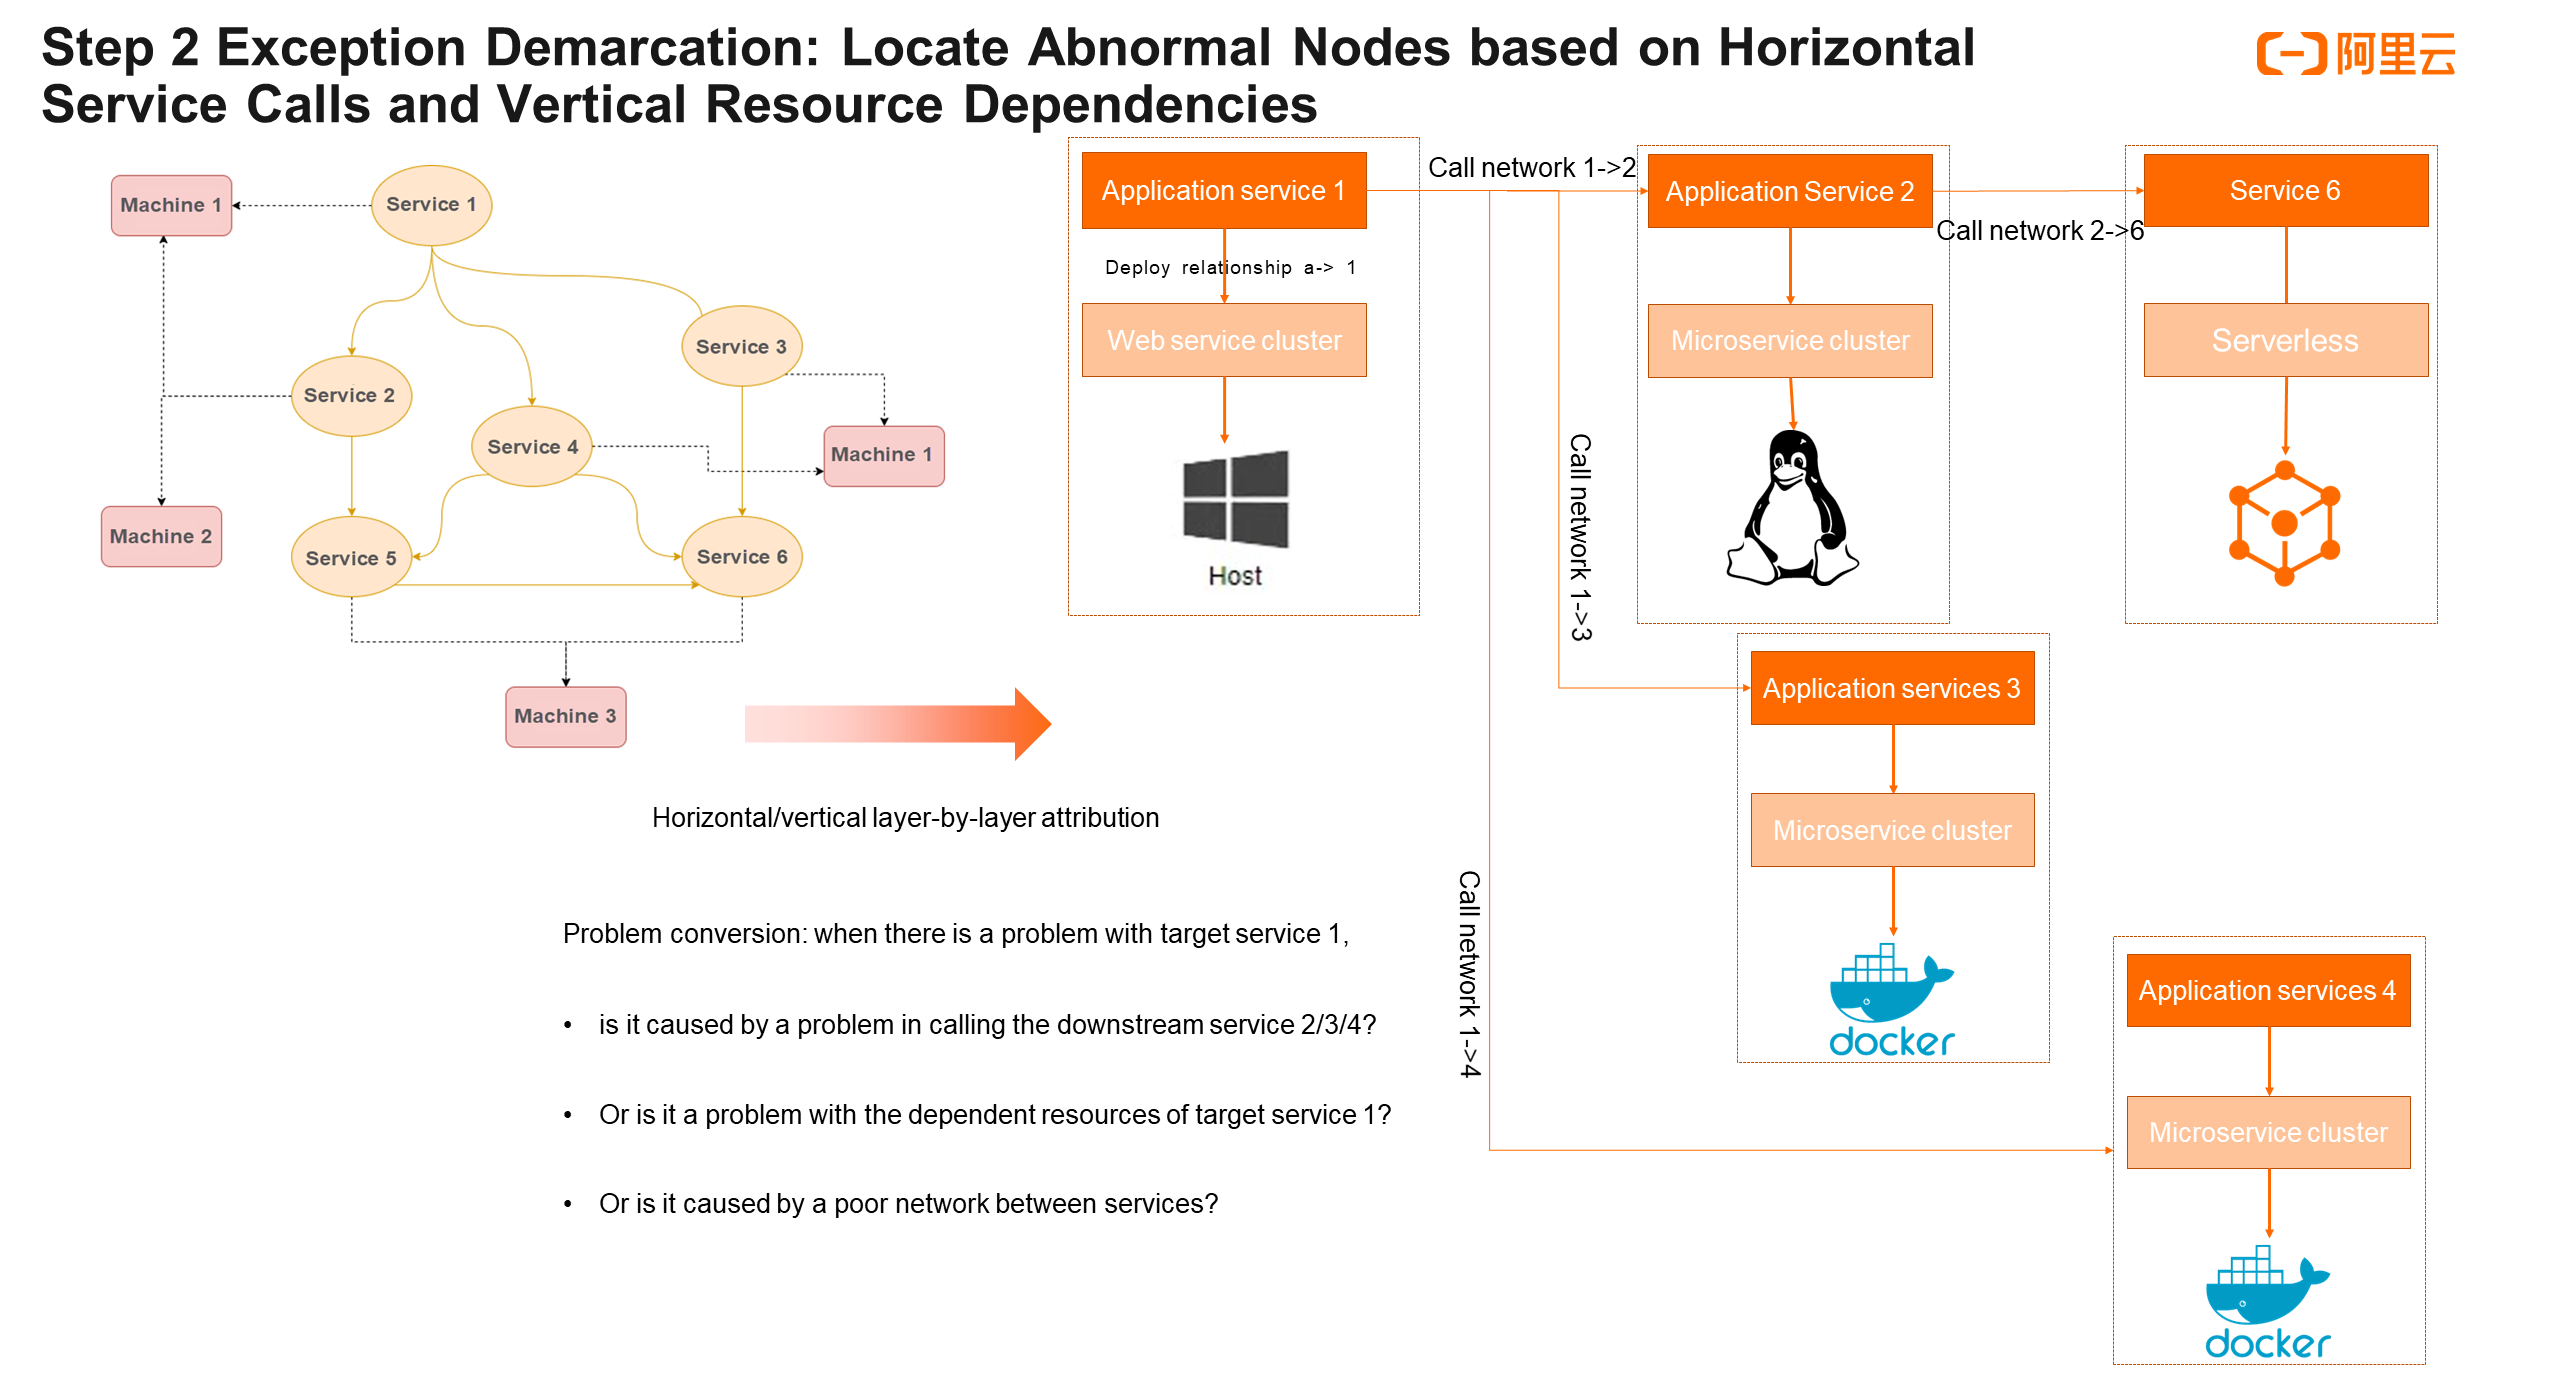
Step 2 is the exception demarcation. In a microservice topology, nodes are called in multiple layers. Apart from dimensional attribution in a single layer, we also need to know in which directions to perform further dimensional attribution.
In a Kubernetes environment, the overall topology is relatively complex, which may contain application topologies and resource topologies. We have simplified the entire microservice topology. To make it simpler, we can consider that there are only two types of nodes in the topology: one is service nodes and the other is machine nodes. After this simplification, the relationship between two service nodes is to call and to be called, and the relationship between a service node and a machine node is to depend and to be depended on. A messy microservice topology is then transformed to be much simpler. Now, we can perform horizontal and vertical drill-down analysis starting from any node.
Take the preceding fault as an example. Assume that the gateway is the target exception service. Starting from it, we can perform horizontal dimensional attribution and complete drill-down analysis of calls. In the vertical direction, it is mainly the relationship of resource dependencies. We can drill down along the resource layer to check for abnormal machine IP addresses. Finally, check whether there is a problem with the network communication of the network edge service that they depend on.
Through horizontal and vertical attribution as well as network communication attribution, root cause analysis can be implemented in a more organized and logical manner. Combined with layer-by-layer service topology analysis, we can analyze all exception nodes in the entire system.
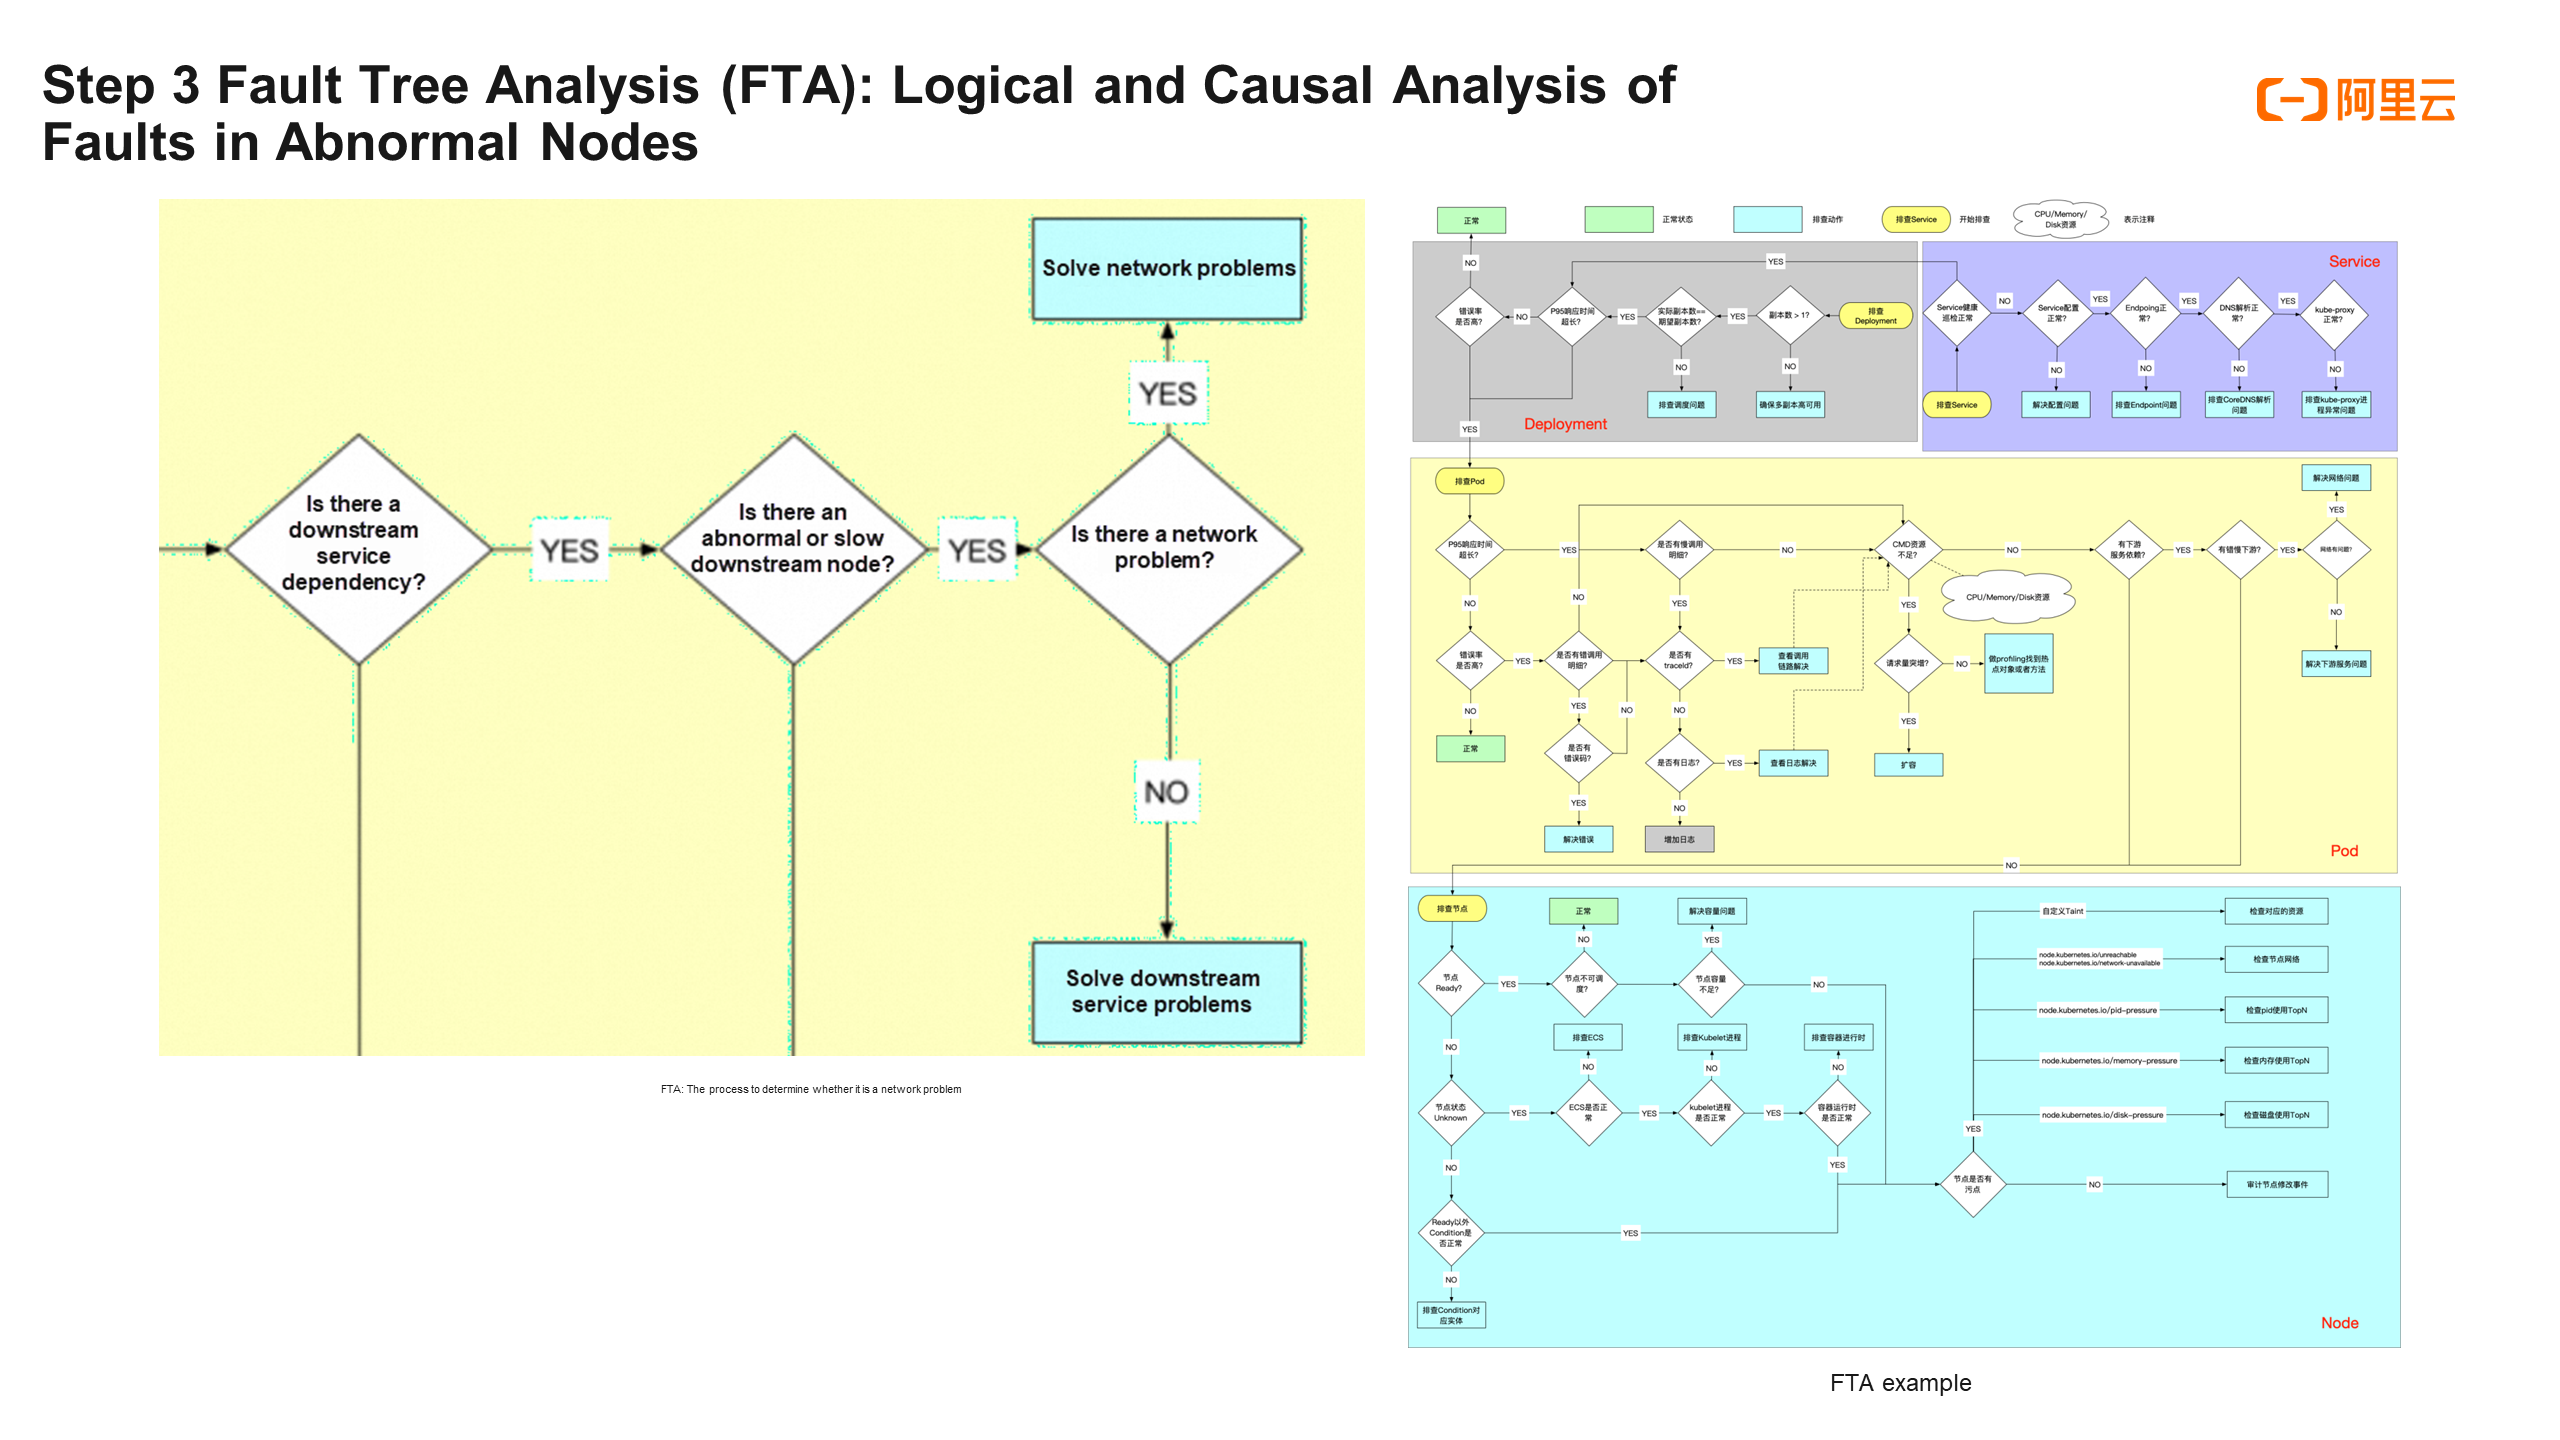
Step 3 is the fault tree analysis. After locating the abnormal node or abnormal network communication, we know on which trace the problem occurred. The question is, what kind of problem is it? Is it a slow call of the network? Or is it related to the CPU of the resource?
There are usually several schemes. One is to make a supervised model to implement fault classification, but it is very demanding for labeled datasets, and the generalization and interpretability of the model are poor. Another scheme is fault tree analysis. Specifically:
First, we need to summarize our experience in microservice troubleshooting and governance into an FTA tree. With the FTA tree, after locating the specific nodes and edges, a condition determination similar to the decision tree can be carried out to implement fault classification. For example, if we have located that the exception lies in the trace of the gateway calling the product service node, we can check whether the gateway has downstream service dependencies, whether there are abnormal or slow downstream nodes, and whether there are problems with its network metrics. If all three conditions are met, this is a network problem.
In this way, a more logical and interpretable fault classification model is implemented.
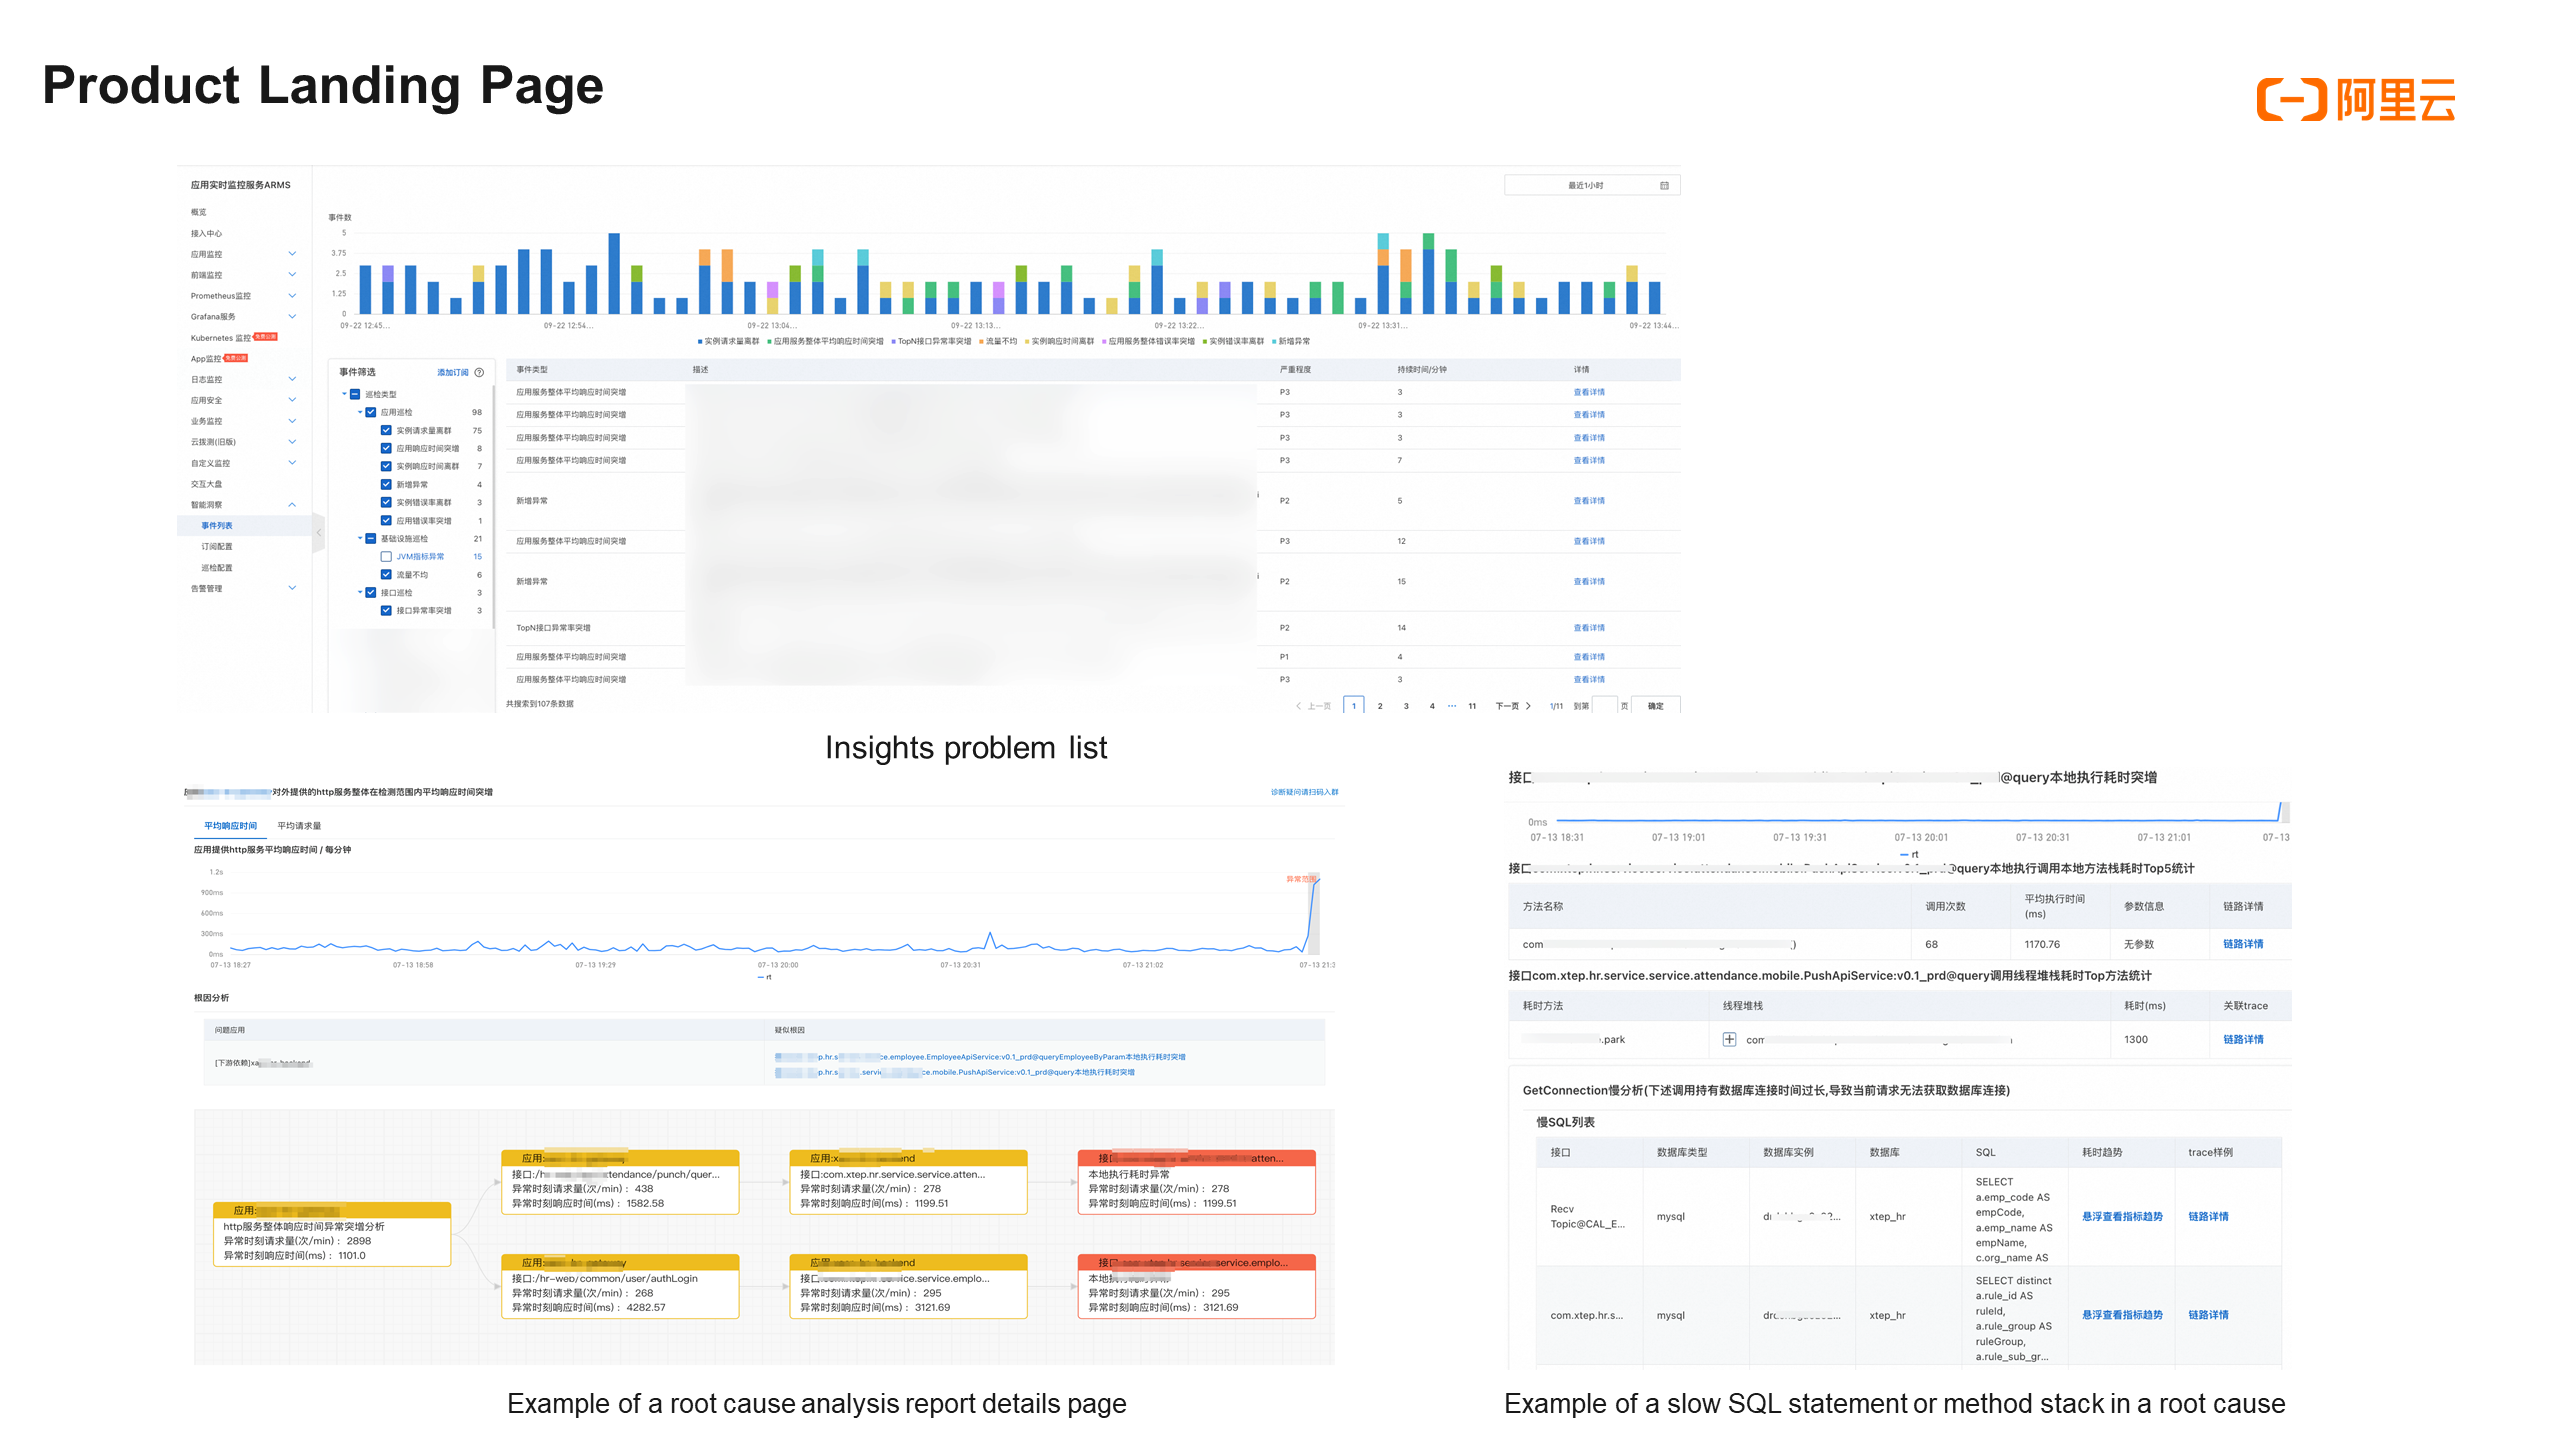
We have integrated the three core steps of the root cause locating model into the root cause analysis product Insights. The figure above shows the exception event list and root cause analysis report provided by Insights. Insights provides two core pages: the exception event list page and the root cause analysis report page. Currently, Insights supports multiple scenarios such as application monitoring and Kubernetes monitoring.
In the specific process of using the product, Insights performs real-time intelligent exception detection after an application is connected to ARMS. The detected exception events are displayed on the exception event list page. You can click Event Details to view the detailed root cause analysis report. The report includes the phenomenon description, key metrics, summary of the root causes, root cause list, and fault propagation trace diagram. You can also click a specific exception in the root cause list to view more exception analysis results, such as exception call method stacks, information about slow SQL statements executed by MySQL, and exception information.
This is the end of our sharing. To sum up, we introduced the three major observability challenges in the Kubernetes environment, and explained the solution of data collection in the Kubernetes environment: how to use eBPF to realize data collection in different layers and realize data correlation. Finally, we also shared the exploration of the practice of intelligent root cause locating in the Kubernetes environment. The core steps are dimensional attribution, exception demarcation, and FTA.
Optimal Multi-language Application Monitoring: ARMS eBPF Edition

212 posts | 13 followers
FollowAlibaba Cloud Native Community - September 8, 2025
Alibaba Container Service - November 15, 2024
Alibaba Cloud Native Community - August 25, 2025
Xi Ning Wang(王夕宁) - July 21, 2023
Alibaba Cloud Native - November 3, 2022
Alibaba Cloud Native Community - December 6, 2022

212 posts | 13 followers
Follow Cloud-Native Applications Management Solution
Accelerate and secure the development, deployment, and management of containerized applications cost-effectively.
Learn More Container Service for Kubernetes
Alibaba Cloud Container Service for Kubernetes is a fully managed cloud container management service that supports native Kubernetes and integrates with other Alibaba Cloud products.
Learn More Apsara Stack
Apsara Stack is a full-stack cloud solution created by Alibaba Cloud for medium- and large-size enterprise-class customers.
Learn More ACK One
Provides a control plane to allow users to manage Kubernetes clusters that run based on different infrastructure resources
Learn MoreMore Posts by Alibaba Cloud Native