By Guqi, Qianlu and Yanhong
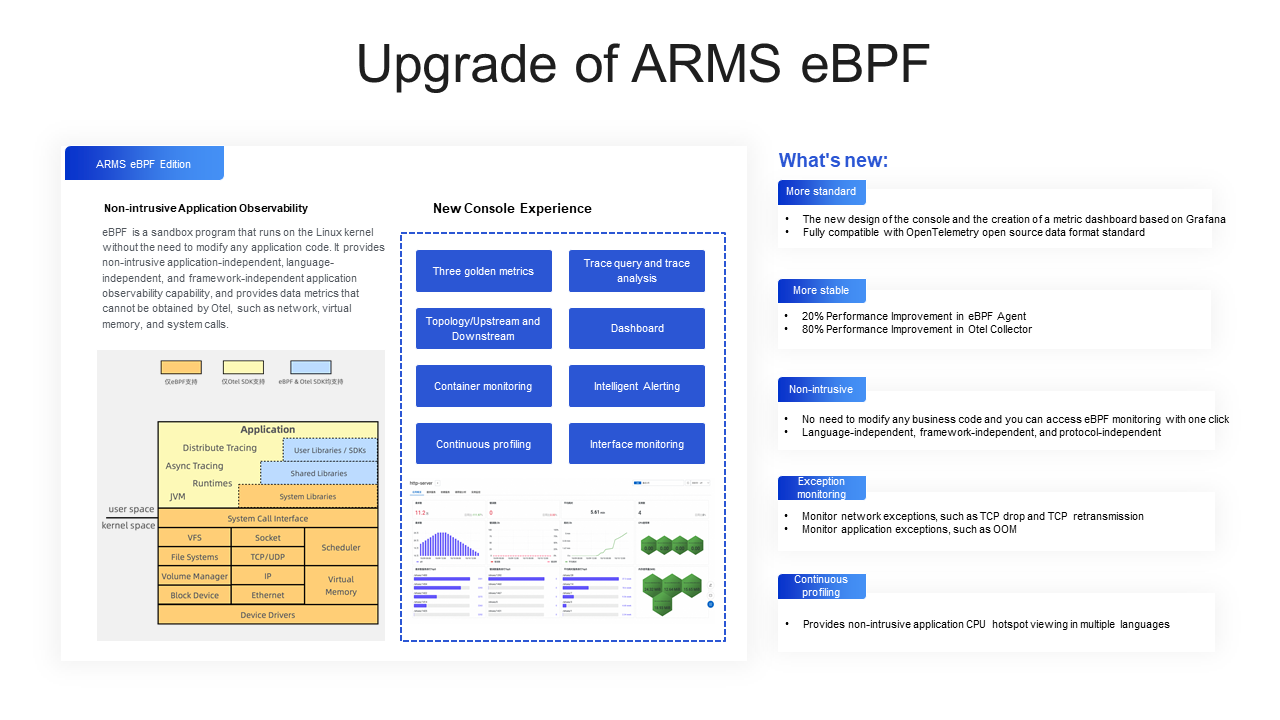
As cloud-native technologies like Kubernetes and Serverless continue to transform R&D and O&M modes, the shift from monolithic to distributed, microservice-oriented application architectures has become more evident. As enterprises integrate more microservices using multiple languages, frameworks, and protocols, the complexity of microservices has increased. Quickly identifying and locating microservice issues through observability has become crucial for O&M personnel and developers.
Observability products need to ensure that the application's current operating architecture, upstream and downstream dependencies, and traffic are normal. However, challenges arise as the number of microservice types increases, particularly in implementing event tracking with different languages, frameworks, and protocols, and the potential impact on performance. To address these issues and meet the end-to-end application monitoring requirements, Application Real-Time Monitoring Service (ARMS) has introduced the application monitoring eBPF edition to enhance the entire application monitoring system through eBPF technology. The following section will focus on the application monitoring eBPF edition.
As the number of microservices surges with the development of businesses, common application observability cannot handle complex scenarios involving specific languages used across different business sectors. Additionally, most non-Java languages require the use of an SDK to access monitoring, significantly reducing the efficiency of research and development personnel. This is where the application monitoring eBPF edition comes into play. It is primarily designed to address application observability challenges in multi-language scenarios, providing non-intrusive and language-independent observability capabilities. For microservices in the Go language, specific monitoring capabilities, such as GC monitoring, memory dump, and profiling, are supported.
The eBPF technology is a sandbox program running on the Linux kernel without changing any source code or loading any kernel modules. It has the following features:
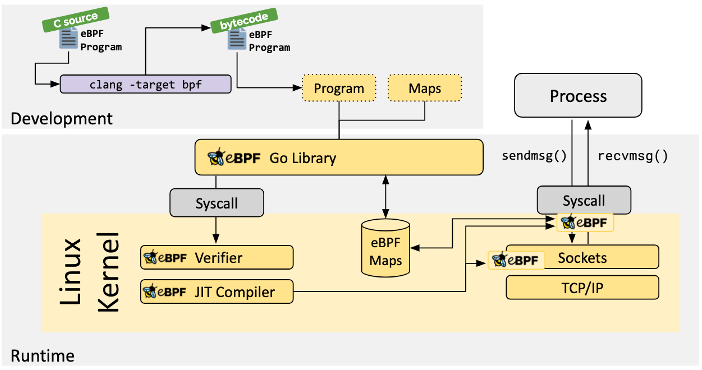
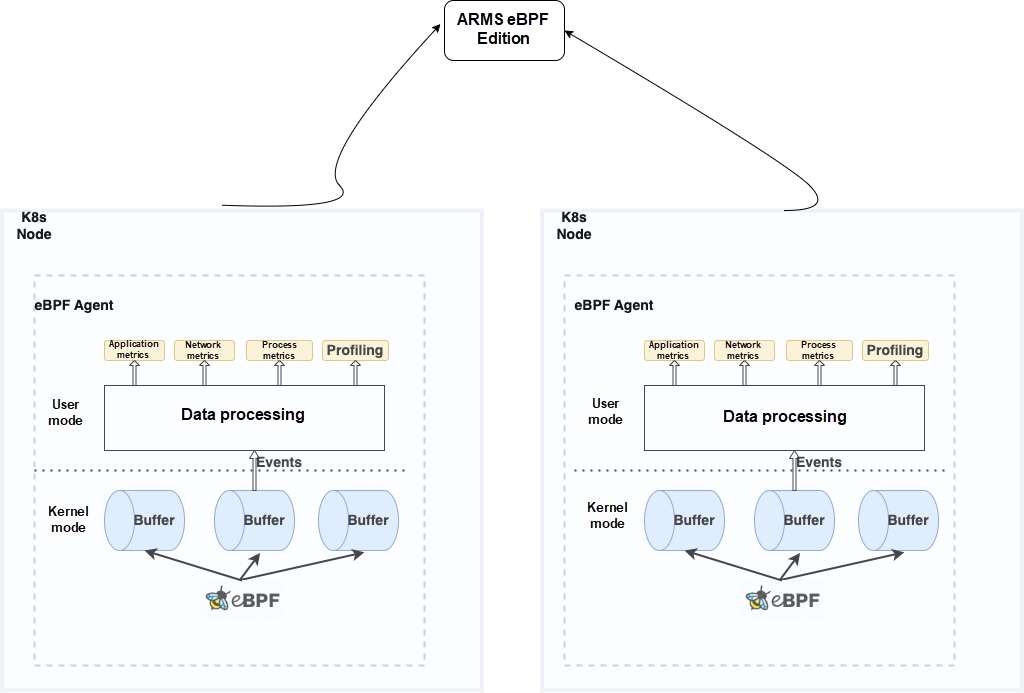
In the Kubernetes environment, the eBPF agent is deployed on each node in Daemonset mode. It runs in the kernel through the program of Load eBPF in the user state, collects data, sends it to the user state for data processing, and then forms different types of metrics.
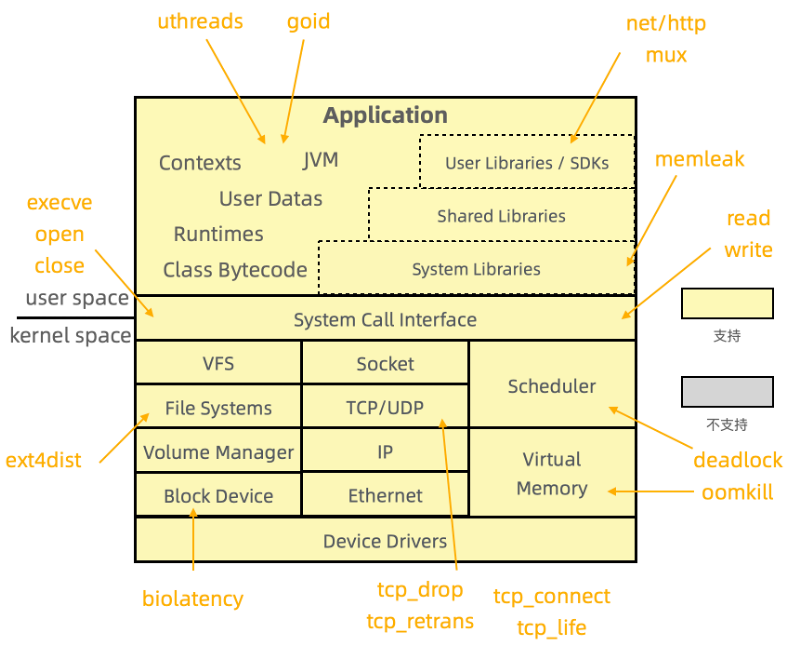
eBPF has three most important advantages in the observability field:
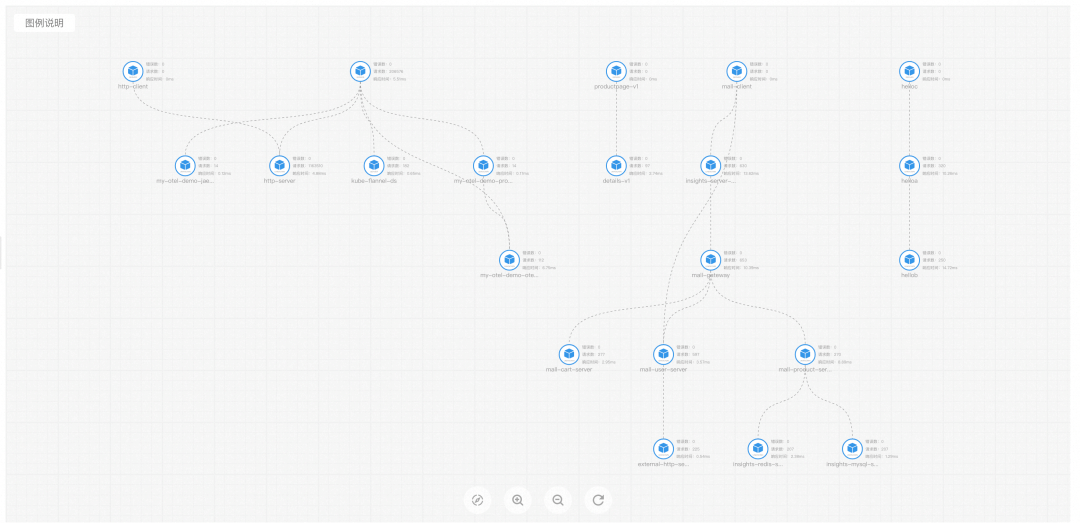
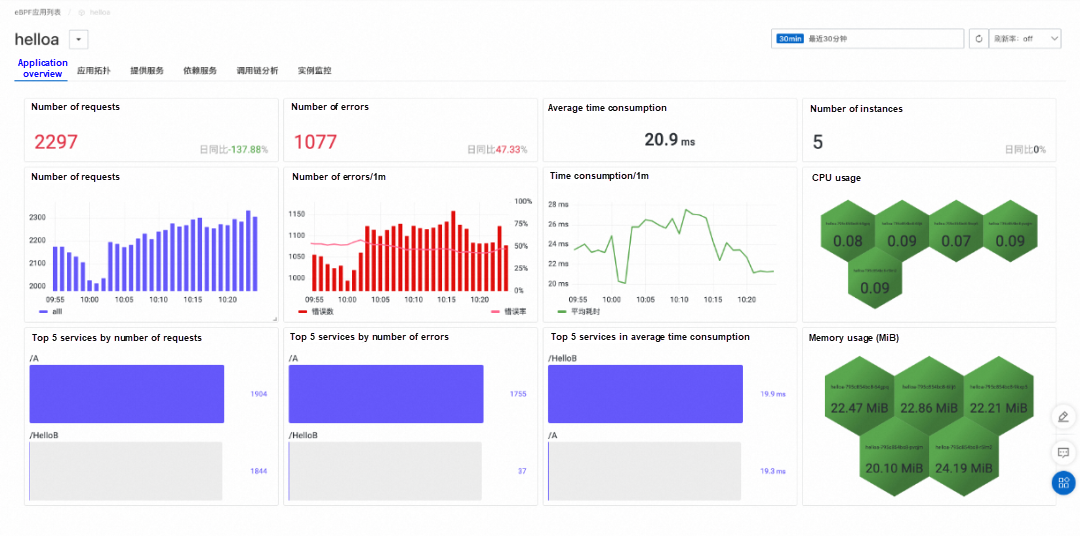
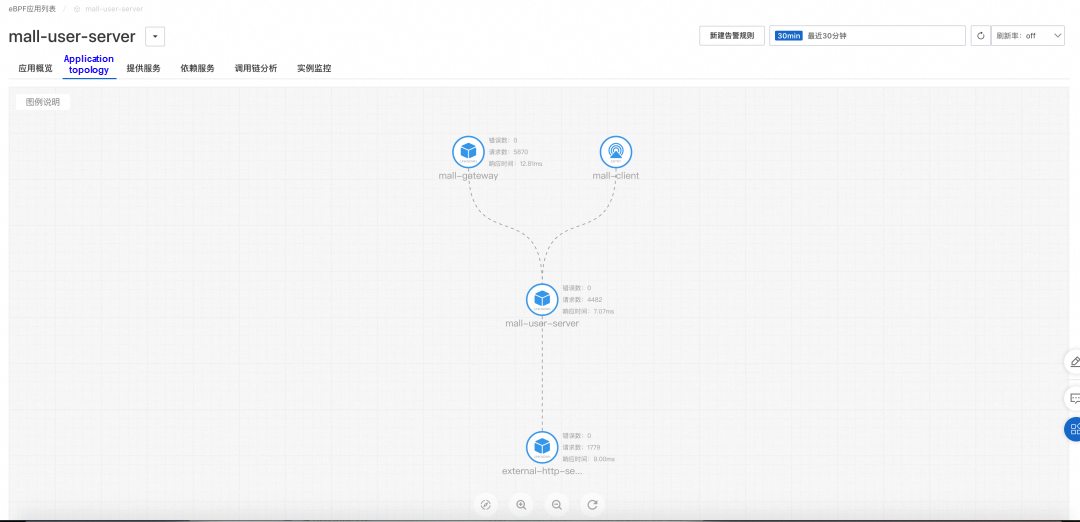
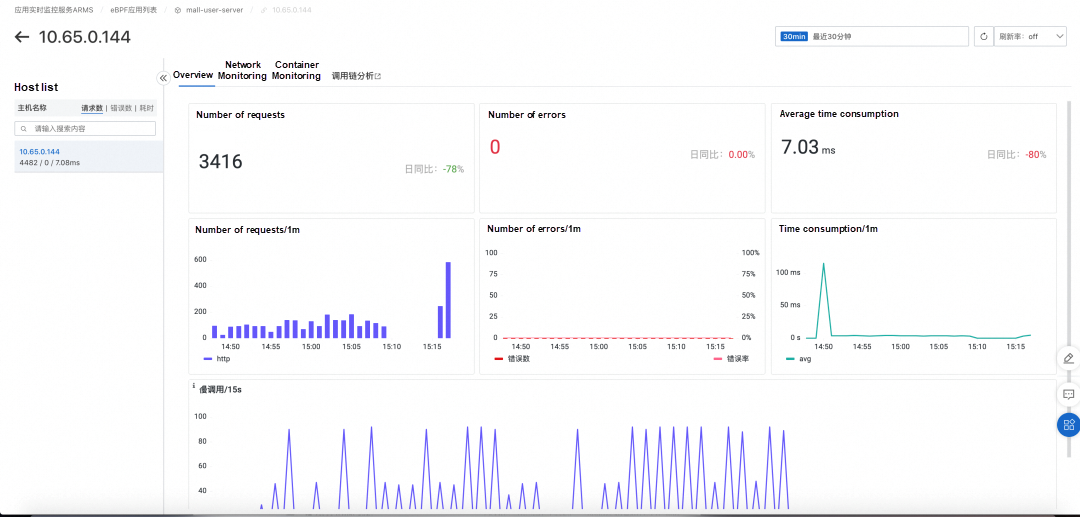
A Kubernetes cluster is created. Currently, ARMS eBPF only supports access to ACK clusters. You can create each cluster as follows:
Install the following monitoring components for a Kubernetes cluster to connect the cluster to ARMS eBPF:
Note: Metric data of ARMS eBPF depends on Prometheus monitoring. Therefore, you must install the Prometheus monitoring agent first.
Before you install the ARMS application monitoring agent, check whether your ACK Serverless cluster has ARMS Addon Token. Otherwise, an error report will occur because you do not have permission. If the cluster has ARMS Addon Token, ARMS performs passwordless authentication. After the component is installed, you can use the ARMS eBPF. If the cluster does not have ARMS Addon Token, you need to manually add permission policies on ARMS and Tracing Analysis to complete authentication. The following describes how to check whether ARMS Addon Token exists and how to attach permission policies:
1) Log on to the ACK console[5]. In the left-side navigation pane, click Clusters. On the Clusters page, click the name of the cluster to go to the cluster details page.
2) In the left-side navigation pane, choose Configurations > Secrets. In the upper part of the page, select kube-system from the Namespace drop-down list and check whether addon.arms.token is displayed on the Secrets page.
1) Log on to the ACK console.
2) In the left-side navigation pane, click Clusters. On the Clusters page, click the name of the cluster that you want to view.
3) On the Cluster Information page, click the Cluster Resources tab and click the link next to Worker RAM Role.
4) On the Permissions tab, click Grant Permission.
5) Select AliyunARMSFullAccess and AliyunTracingAnalysisFullAccess System Permissions and click OK.
Note: Managed Kubernetes clusters: For some managed Kubernetes clusters, the ARMS Addon Token may not exist. Therefore, for managed Kubernetes clusters, it is recommended that you first check whether the ARMS Addon Token exists. If ARMS Addon Token does not exist, you need to manually grant permissions.
By default, ACK dedicated clusters do not have ARMS Addon Token. You need to manually grant permissions.
1) Log on to the ACK console. On the Clusters page, click the name of the cluster that you want to manage.
2) In the left-side navigation pane, choose O&M Management> Prometheus Monitoring.
3) If the Prometheus Monitoring page shows that the Prometheus Service agent is not installed, you need to install it.
4) On the Prometheus Monitoring page, click Install.
ACK console automatically installs the Prometheus Monitoring agent.
Note: The default namespace is arms-prom.
1) Log on to the ACK console. On the Clusters page, click the name of the cluster that you want to manage.
2) In the left-side navigation pane, choose Operations> Cluster Topology.
3) On the Cluster Topology page, click Install. The ARMS eBPF component is automatically installed by the ACK console.
Note: The default namespace is arms-prom.
1) Log on to the ACK console. On the Clusters page, find the cluster that you want to manage and click Applications in the Actions column.
2) On the Deployments page, click Create from YAML in the upper-right corner.
3) Select Sample Template and add the following labels to the spec.template.metadata hierarchy in the Template (YAML format) section.
labels:
armseBPFAutoEnable: "on"
armseBPFCreateAppName: "<your-deployment-name>" // Replace <your-deployment-name> with the name of your application.
The following YAML template provides an example of how to create a deployment application and enable ARMS eBPF:
apiVersion: v1
kind: Namespace
metadata:
  name: arms-demo
---
apiVersion: apps/v1 # for versions before 1.8.0 use apps/v1beta1
kind: Deployment
metadata:
  name: arms-springboot-demo
  namespace: arms-demo
  labels:
    app: arms-springboot-demo
spec:
  replicas: 2
  selector:
    matchLabels:
      app: arms-springboot-demo
  template:
    metadata:
      labels:
        app: arms-springboot-demo
        armseBPFAutoEnable: "on"
        armseBPFCreateAppName: "arms-k8s-demo"
    spec:
      containers:
        - resources:
            limits:
              cpu: 0.5
          image: registry.cn-hangzhou.aliyuncs.com/arms-docker-repo/arms-springboot-demo:v0.1
          imagePullPolicy: Always
          name: arms-springboot-demo
          env:
            - name: SELF_INVOKE_SWITCH
              value: "true"
            - name: COMPONENT_HOST
              value: "arms-demo-component"
            - name: COMPONENT_PORT
              value: "6666"
            - name: MYSQL_SERVICE_HOST
              value: "arms-demo-mysql"
            - name: MYSQL_SERVICE_PORT
              value: "3306"
---
apiVersion: apps/v1 # for versions before 1.8.0 use apps/v1beta1
kind: Deployment
metadata:
  name: arms-springboot-demo-subcomponent
  namespace: arms-demo
  labels:
    app: arms-springboot-demo-subcomponent
spec:
  replicas: 2
  selector:
    matchLabels:
      app: arms-springboot-demo-subcomponent
  template:
    metadata:
      labels:
        app: arms-springboot-demo-subcomponent
        armseBPFAutoEnable: "on"
        armseBPFCreateAppName: "arms-k8s-demo-subcomponent"
    spec:
      containers:
        - resources:
            limits:
              cpu: 0.5
          image: registry.cn-hangzhou.aliyuncs.com/arms-docker-repo/arms-springboot-demo:v0.1
          imagePullPolicy: Always
          name: arms-springboot-demo-subcomponent
          env:
            - name: SELF_INVOKE_SWITCH
              value: "false"
            - name: MYSQL_SERVICE_HOST
              value: "arms-demo-mysql"
            - name: MYSQL_SERVICE_PORT
              value: "3306"
---
apiVersion: v1
kind: Service
metadata:
  labels:
    name: arms-demo-component
  name: arms-demo-component
  namespace: arms-demo
spec:
  ports:
    # the port that this service should serve on
    - name: arms-demo-component-svc
      port: 6666
      targetPort: 8888
  # label keys and values that must match in order to receive traffic for this service
  selector:
    app: arms-springboot-demo-subcomponent
---
apiVersion: apps/v1 # for versions before 1.8.0 use apps/v1beta1
kind: Deployment
metadata:
  name: arms-demo-mysql
  namespace: arms-demo
  labels:
    app: mysql
spec:
  replicas: 1
  selector:
    matchLabels:
      app: mysql
  template:
    metadata:
      labels:
        app: mysql
    spec:
      containers:
        - resources:
            limits:
              cpu: 0.5
          image: registry.cn-hangzhou.aliyuncs.com/arms-docker-repo/arms-demo-mysql:v0.1
          name: mysql
          ports:
            - containerPort: 3306
              name: mysql
---
apiVersion: v1
kind: Service
metadata:
  labels:
    name: mysql
  name: arms-demo-mysql
  namespace: arms-demo
spec:
  ports:
    # the port that this service should serve on
    - name: arms-mysql-svc
      port: 3306
      targetPort: 3306
  # label keys and values that must match in order to receive traffic for this service
  selector:
    app: mysql
--ARMS provides non-intrusive observability for Java services. For Java applications, we recommend you access ARMS. ARMS eBPF edition provides language-independent observability because it is non-intrusive. Currently, ARMS eBPF edition only supports the HTTP protocol.
| Scenarios | ARMS | ARMS eBFP Edition |
| ● Pure Java applications ● Deployment methods: ECS, container, EDAS/SAE hosting, IDC/ other cloud service providers ● Expect no intrusion into business code ● Scenario: application health monitoring/alerting ● Scenario: distributed full Tracing Analysis ● Scenario: perform code-level analysis and troubleshooting for errors, slowdowns, and exceptions ● Scenario: continuous performance profiling to find code hotspots |
★★★★★ Highly recommended |
Not recommended |
| ● Multi-language applications, including Java ● Deployment methods: ECS, container, EDAS/SAE hosting, IDC/other cloud service providers ● Scenario: application health monitoring/alerting ● Scenario: distributed full Tracing Analysis ● Scenario: perform code-level analysis and troubleshooting for errors, slowdowns, and exceptions ● Scenario: continuous performance profiling to find code hotspots |
★★★★★ Highly recommended for Java applications |
★★★ Recommended when a non-intrusive solution is strongly desiredEquipped with regular application performance monitoring/alerting capabilities Limits: weak Tracing Analysis and performance profiling capability |
| ● Multi-language applications, including Java ● Deployment method: Container deployment, and the system kernel is high (or can accept kernel upgrade) ● Expect no intrusion into business code ● Scenario: application health monitoring/alerting |
★★★★★ Highly recommended for Java applications |
★★★★ Equipped with regular application performance monitoring/alerting capabilities No advanced application diagnostics or Tracing Analysis is required |
[1] Activate and upgrade ARMS
https://www.alibabacloud.com/help/en/arms/getting-started/activate-arms#concept-65257-zh
[2] Create an ACK dedicated cluster
https://www.alibabacloud.com/help/en/ack/ack-managed-and-ack-dedicated/user-guide/create-an-ack-dedicated-cluster#task-skz-qwk-qfb
[3] Create an ACK managed cluster
https://www.alibabacloud.com/help/en/ack/ack-managed-and-ack-dedicated/user-guide/create-an-ack-managed-cluster-2#task-skz-qwk-qfb
[4] AMS eBPF edition operating environment requirements and limits
https://www.alibabacloud.com/help/en/arms/application-monitoring-ebpf/getting-started/untitled-document-1698028648754
[5] ACK console
https://account.aliyun.com/login/login.htm?oauth_callback=https%3A%2F%2Fcs.console.aliyun.com%2F
Observability | Best Practices for Using Prometheus to Monitor SQL Server
Building a Next-generation Intelligent Observability System Based on eBPF

212 posts | 13 followers
FollowAlibaba Cloud Native - April 2, 2024
Alibaba Cloud Native Community - April 26, 2024
Alibaba Cloud Native Community - April 18, 2025
Alibaba Cloud Native Community - March 11, 2026
Alibaba Cloud Native Community - January 19, 2023
Alibaba Cloud Native - March 6, 2024

212 posts | 13 followers
Follow Application Real-Time Monitoring Service
Build business monitoring capabilities with real time response based on frontend monitoring, application monitoring, and custom business monitoring capabilities
Learn More Managed Service for Prometheus
Multi-source metrics are aggregated to monitor the status of your business and services in real time.
Learn More Real-Time Livestreaming Solutions
Stream sports and events on the Internet smoothly to worldwide audiences concurrently
Learn More Enterprise Distributed Application Service
A PaaS platform for a variety of application deployment options and microservices solutions to help you monitor, diagnose, operate and maintain your applications
Learn MoreMore Posts by Alibaba Cloud Native