By Guqi
In modern software architecture, microservices have become a popular approach for building scalable and flexible applications. Each microservice is responsible for a specific function, working together to deliver a complete service. Due to the decentralized nature of microservice architecture, effective monitoring is crucial to ensuring high availability, reliability, and service quality. It supports the smooth operation of the entire system and enables continuous business growth..
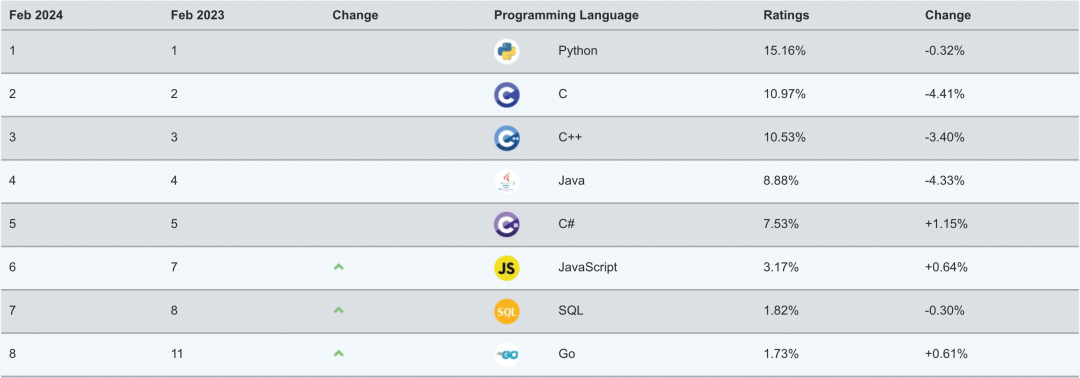
With the popularization of Kubernetes and containerization technology, the Go language is not only applied to cloud-native basic components but also chosen by many emerging businesses as their preferred programming language in various business scenarios. Golang offers multiple RPC frameworks such as Gin, Kratos, and Kitex, and it continues to mature within the microservice ecosystem. According to the latest TIOBE index, Golang ranks in the top 10 programming languages. Therefore, application monitoring of Golang microservices becomes vital for businesses.
The eBPF edition of application monitoring enables non-intrusive observability for Golang microservices by utilizing eBPF technology. It allows capturing the call details of Golang microservices and facilitates non-intrusive CPU profiling and database call analysis for Golang applications.
For detailed product introduction, see Optimal Multi-language Application Monitoring: ARMS eBPF Edition
eBPF (extended Berkeley packet filter) is a powerful technology that allows developers to safely run pre-compiled programs on the Linux kernel without modifying the kernel source code or loading external modules. This unique capability makes eBPF an ideal choice for building modern, flexible, and efficient application monitoring tools.
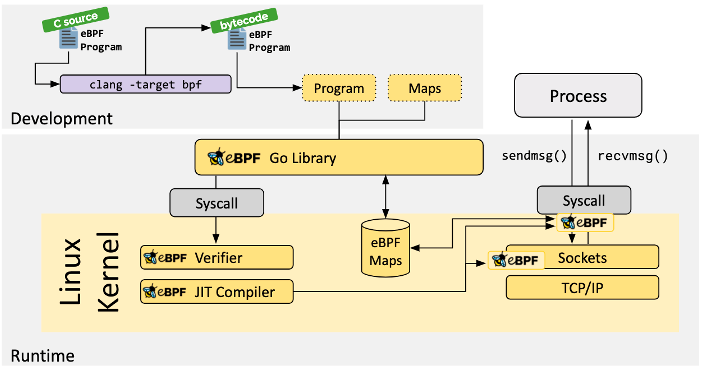
Figure 1.1 How eBPF works
In terms of observability, the advantages of eBPF are prominent:
To connect your Golang application to the application monitoring eBPF edition, see: https://www.alibabacloud.com/help/en/arms/application-monitoring-ebpf/getting-started/access-application-monitoring-ebpf-version
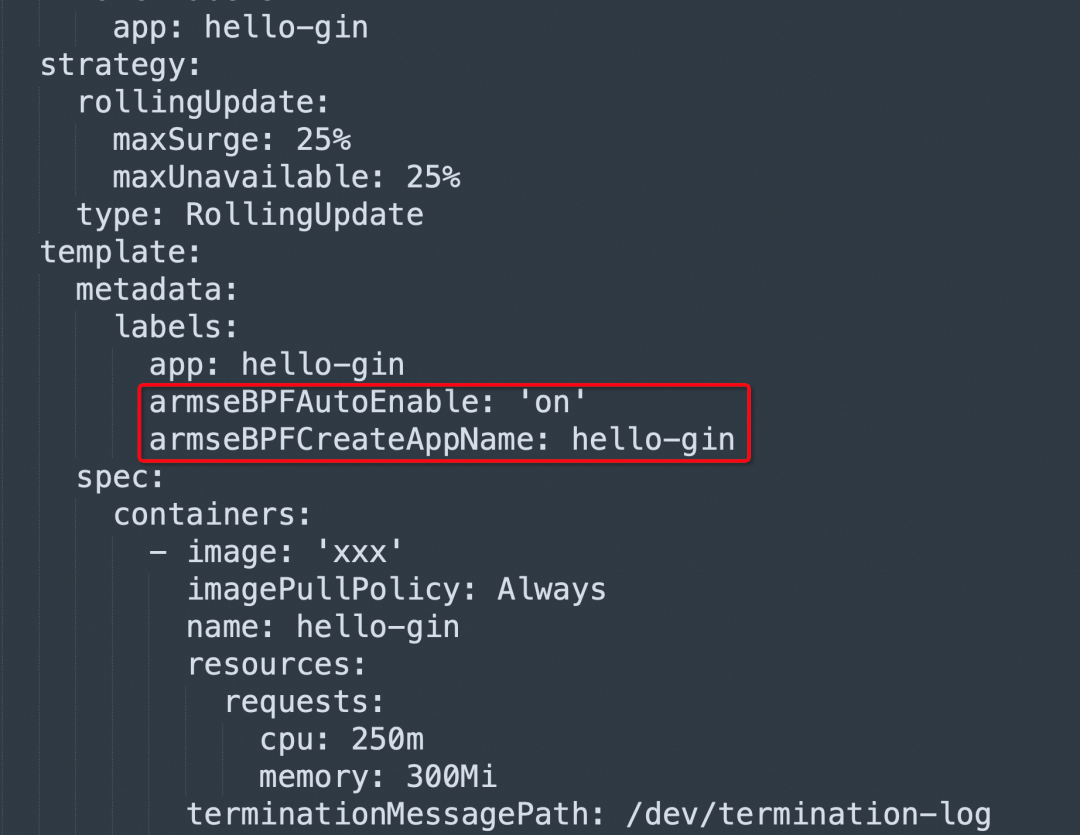
Connecting a Golang application using the Gin framework to the application monitoring eBPF edition involves adding the following configurations to the Deployment, as shown in the following figure
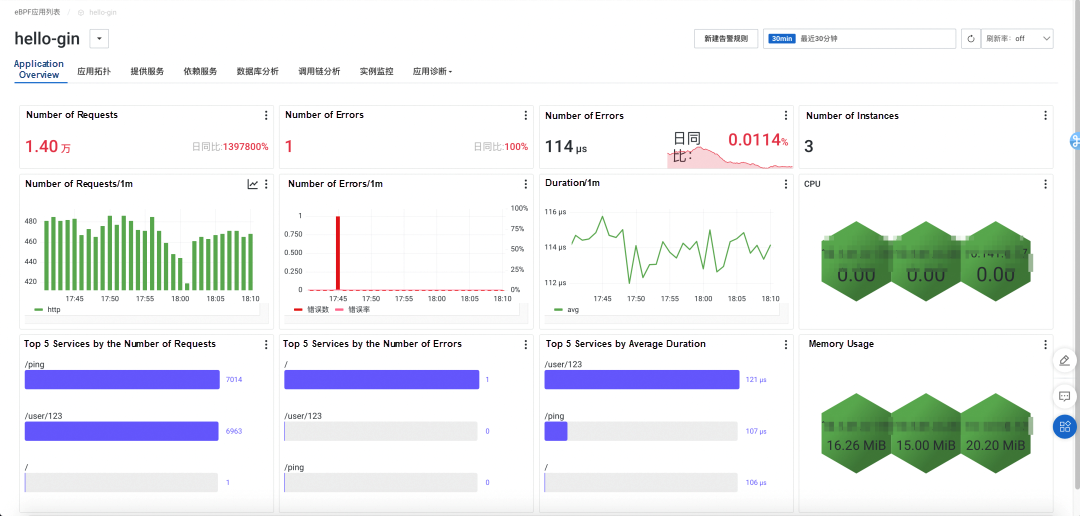
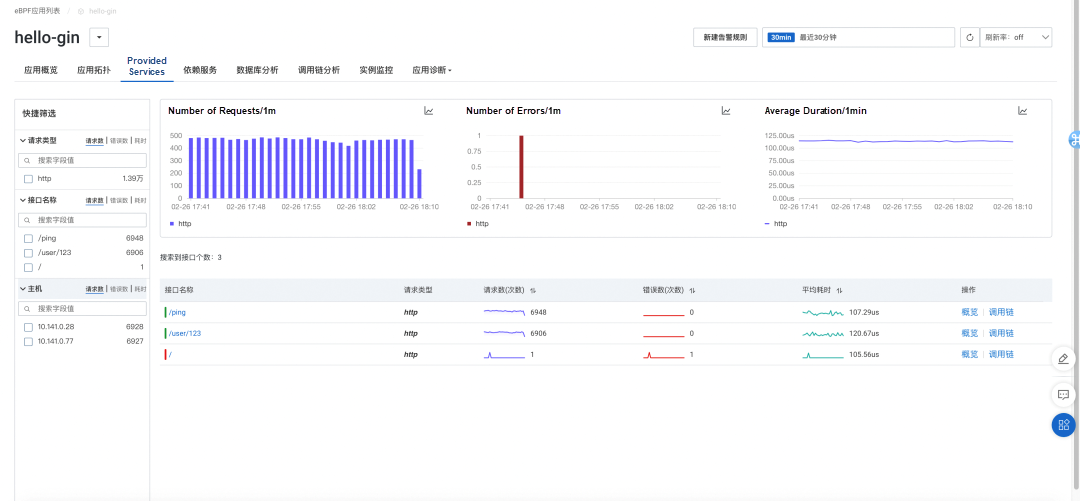
View application details after the application is connected:
Details of service interface call:
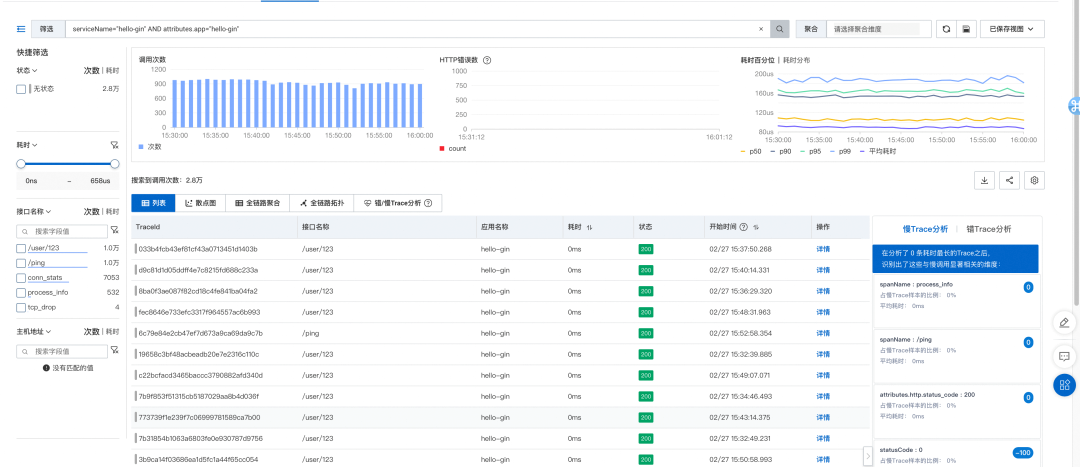
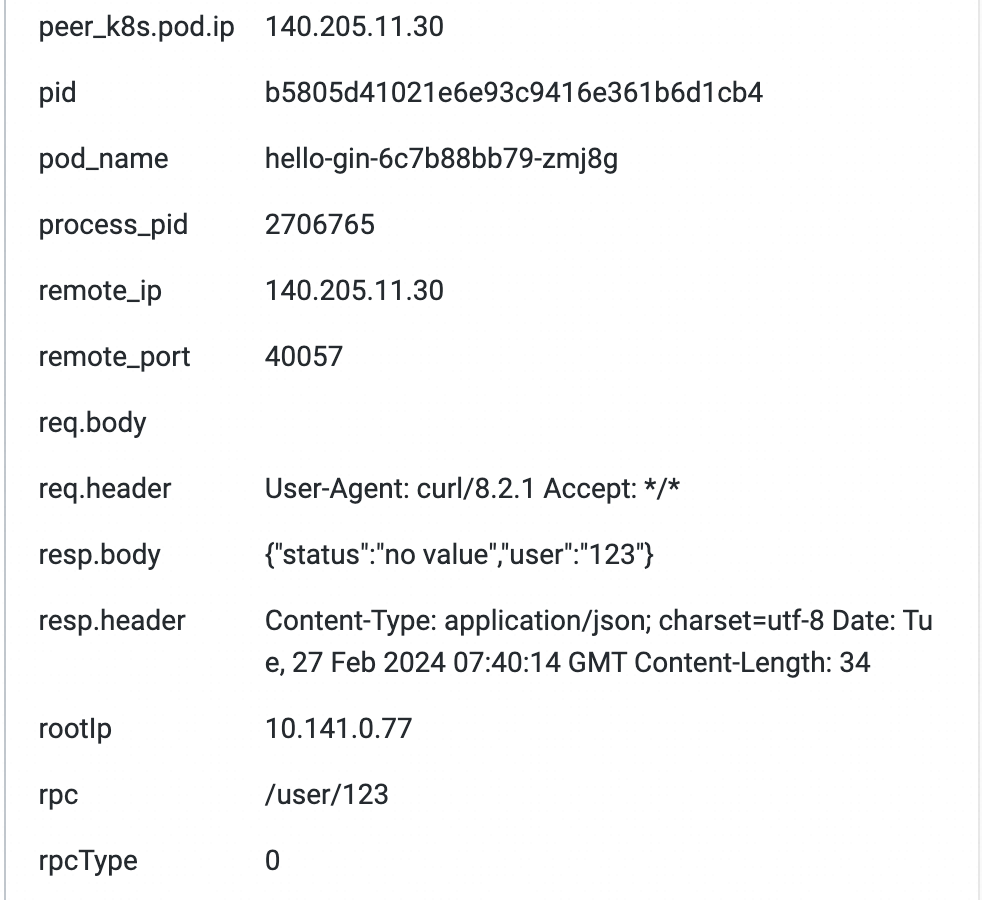
View details of the application call request, including the request body, header, and interface:
Application monitoring eBPF edition introduces the capability of non-intrusive continuous application profiling. We use eBPF to obtain the call stack of the application program and implement the mapping of the corresponding stack ID to the method in the eBPF agent at the same time. We can view the CPU flame graph of the application and visually display the CPU-intensive points during the execution of the business application without any code modification. The flame graph of the HTTP service provided by the Go-Gin framework is shown as follows:
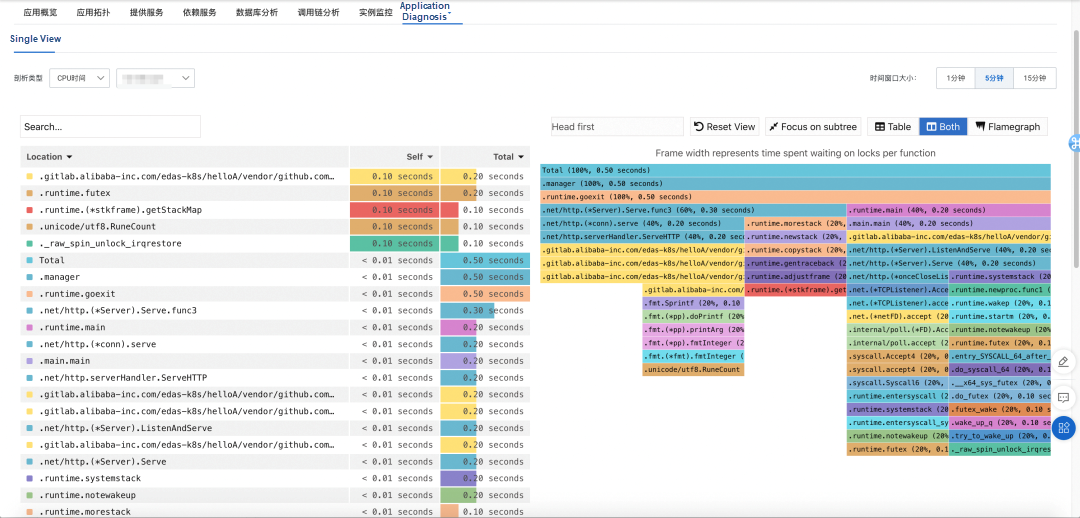
You can view the CPU percentage of processing HTTP requests:
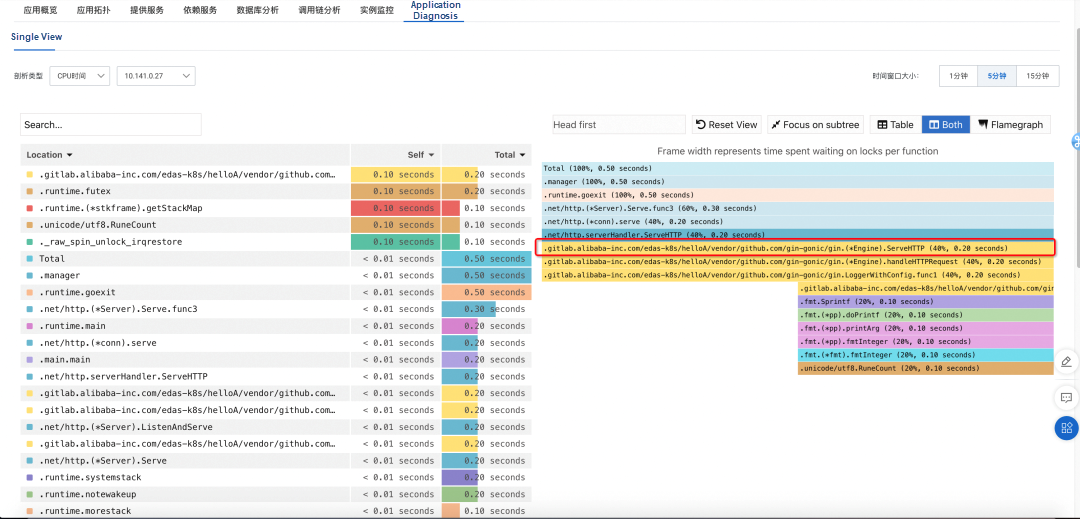
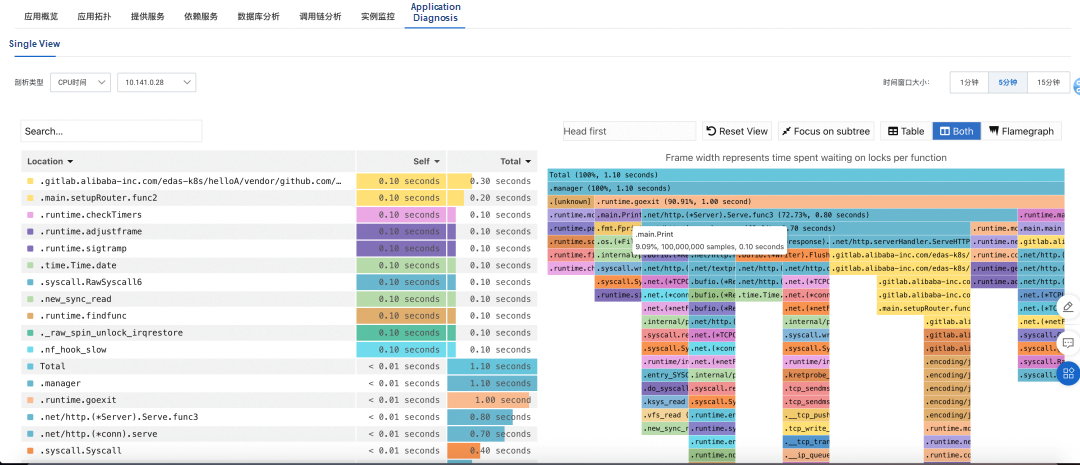
If you add a function of printing data cyclically to the service:
func Print() {
  for {
    fmt.Println("This will print indefinitely every second.")
    time.Sleep(1 * time.Second) // Print data once per second
  }
}
You can find the corresponding Print function from the flame graph, which can quickly locate the CPU percentage in the Golang microservice:
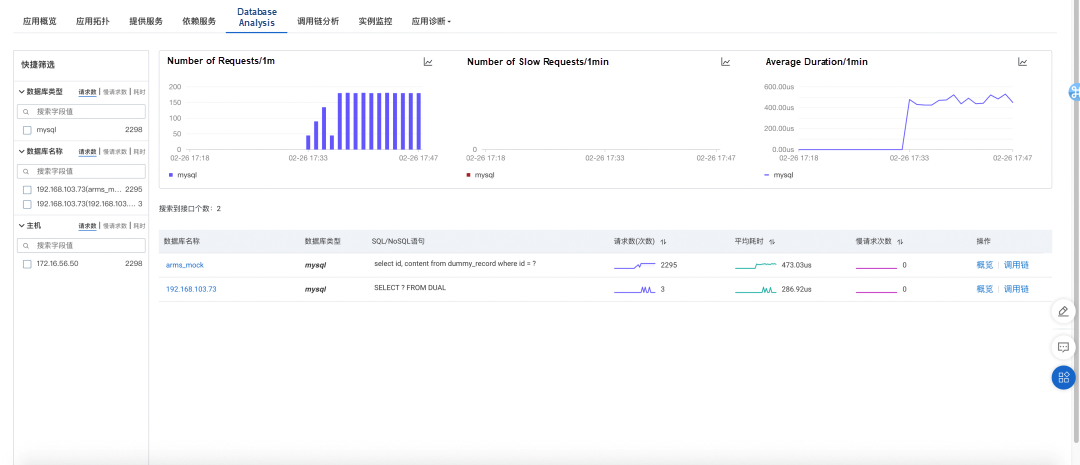
Database is the most widely used middleware product in business applications. Monitoring the calls of business applications to data can quickly find problems, such as slow SQL and the response time of calling databases. Application monitoring eBPF edition provides a call analysis page of databases, as follows:
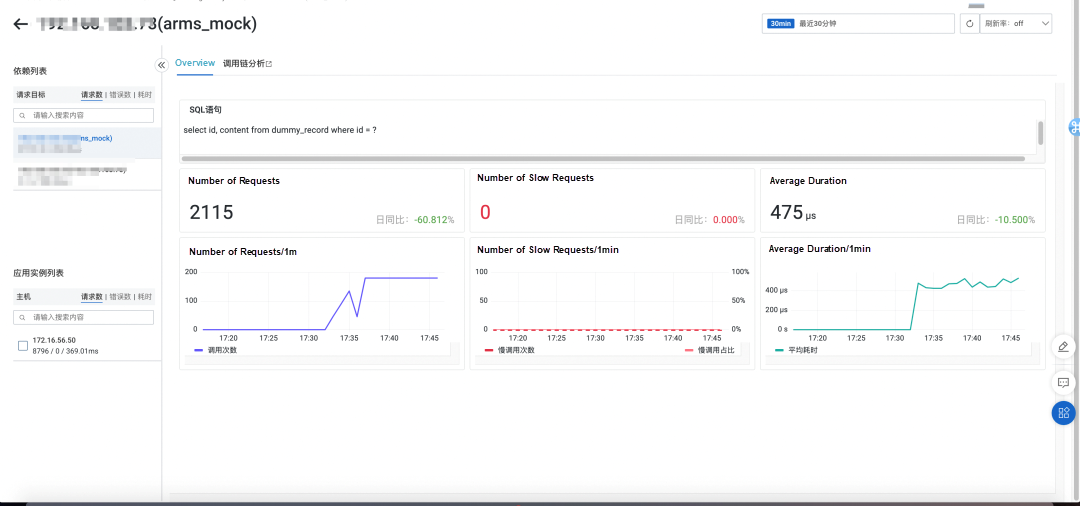
View details of database calls, including the number of database calls, SQL statements (after aggregation), average duration, and number of slow calls (500 ms).
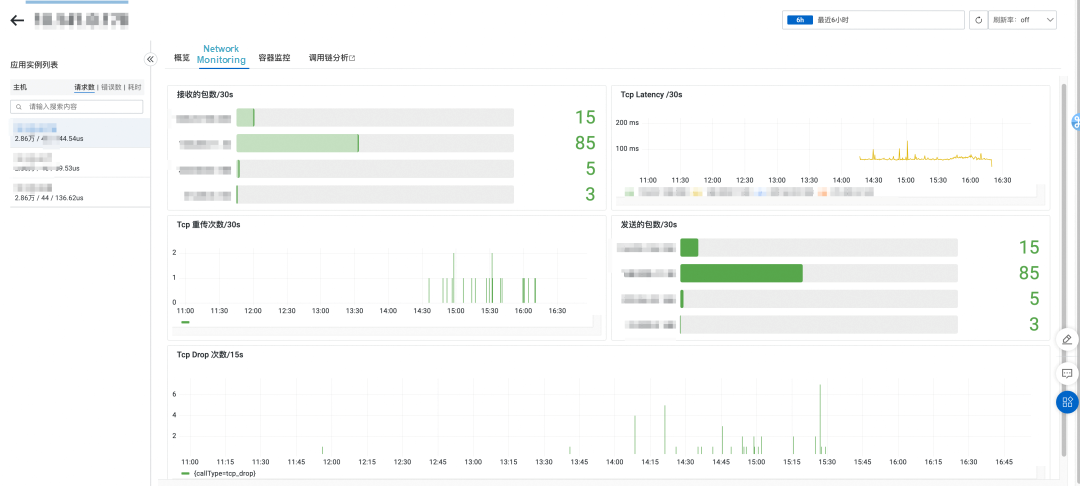
Data from network monitoring describes the number of received packets, the number of sent packets, TCP latency, TCP retransmission, and TCP drop of each instance corresponding to the application.
Non-intrusive Observability Exploration with GraalVM Static Compilation

681 posts | 56 followers
FollowAlibaba Cloud Native - March 6, 2024
Alibaba Cloud Native Community - April 18, 2025
Alibaba Cloud Native - April 2, 2024
OpenAnolis - December 24, 2024
Alibaba Cloud Native Community - August 5, 2025
Alibaba Cloud Native Community - August 19, 2025

681 posts | 56 followers
Follow Microservices Engine (MSE)
MSE provides a fully managed registration and configuration center, and gateway and microservices governance capabilities.
Learn More Apsara Stack
Apsara Stack is a full-stack cloud solution created by Alibaba Cloud for medium- and large-size enterprise-class customers.
Learn More Cloud-Native Applications Management Solution
Accelerate and secure the development, deployment, and management of containerized applications cost-effectively.
Learn More Application Real-Time Monitoring Service
Build business monitoring capabilities with real time response based on frontend monitoring, application monitoring, and custom business monitoring capabilities
Learn MoreMore Posts by Alibaba Cloud Native Community