By Qingfeng, Yibo and Musi

With the popularity of Kubernetes and containerization technology, Golang plays an important role in the cloud-native field and various business scenarios. More and more emerging businesses prefer Golang as the programming language. With rich RPC frameworks such as Dubbo-Go, Gin, Kratos, and Kitex, Golang becomes more mature in the microservices ecosystem and is used in a large number of important open-source projects, including OpenTelemetry Collector, ETCD, Prometheus, Istio, and Higress.
However, compared to Java which can use bytecode enhancement technology to achieve non-intrusive application monitoring, Golang is still at a disadvantage in this regard. Currently, most monitoring capabilities for Golang applications are connected through SDK, such as OpenTelemetry SDK which requires developers to perform manual instrumentation, but it will lead to the following issues:
• Cumbersome trace instrumentation: Each call point needs to be instrumented, and you should pay attention to trace context propagation to prevent trace concatenation errors.
• Complex metrics statistics: Statistics are required for each call, and you must also pay attention to the metric divergence.
• Frequent SDK version updates: Golang only officially maintains the latest two versions. When upgrading business applications, you must upgrade SDK at the same time, which involves a heavy workload.
To solve these problems, the Alibaba Cloud ARMS team collaborated with the programming language and compiler team to develop the non-intrusive instrumentation technology for Golang applications in OpenTelemetry and release a commercially supported agent for Go applications provided by ARMS.
Typically, the go build command goes through the following steps to compile a Golang application:
(1) Source code analysis: Parse the source code file first by using the Golang compiler and convert it into an Abstract Syntax Tree (AST).
(2) Type check: Perform the type check after parsing to ensure that the code conforms to the type system of Golang.
(3) Semantic analysis: Analyze the semantics of the application, including the definition and use of variables, package imports, etc.
(4) Compiler optimization: Convert the syntax tree into an intermediate representation and perform various optimizations to improve the efficiency of code execution.
(5) Code generation: Generate machine code for the target platform.
(6) Linking: Combine different packages and libraries into a single executable file.
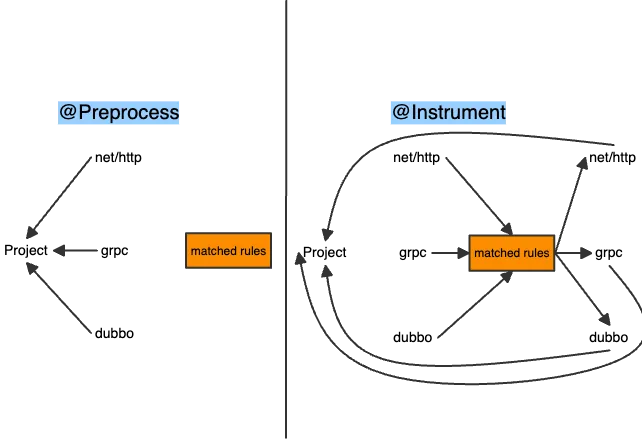
After the automatic instrumentation tool is used, two phases are added before the above steps: pre-processing and code instrumentation.

At this stage, the tool analyzes the third-party library dependencies of the user project code, matches them with the existing instrumentation rules to find the appropriate ones, and configures the additional dependencies required by these instrumentation rules in advance.
The instrumentation rules define the specific framework for the specific version and the specific codes that should be instrumented into the standard library. Different types of instrumentation rules are used for different purposes. Currently, the existing types of instrumentation rules include:
• InstFuncRule: Instrument the code when a method enters and exits
• InstStructRule: Modify a struct to add a field
• InstFileRule: Add a file to participate in the original compilation process
When pre-processing is completed, the go build -toolexec aliyun-go-agent cmd/app is called for compilation. The -toolexec parameter is the core of automatic instrumentation. It is used to intercept the regular building process and replace them with custom tools, so developers can customize the construction process more flexibly. The aliyun-go-agent evoked here is the automatic instrumentation tool, thus entering the code instrumentation phase.
At this stage, the trampoline jump will be inserted for the destination function according to the rules. The trampoline jump is essentially a complex If statement and allows for code instrumentation at the entry and exit points of the destination function to collect monitoring data. In addition, we will perform multiple optimizations at the AST level to minimize the additional performance overhead of the trampoline jump and improve the efficiency of code execution.
After completing the above step, the tool will modify the compilation parameters and then call the go build cmd/app to compile normally, as described earlier.
Take the net/http instrumentation as an example:
First, we distinguish the following three types of functions: RawFunc, TrampolineFunc, and HookFunc. RawFunc is the original function to be instrumented. TrampolineFunc is the trampoline function. HookFunc is the onEnter/onExit code that needs to be instrumented into the entry and exit of the original function. RawFunc goes to TrampolineFunc through the instrumented TJump. TrampolineFunc then constructs the context, prepares to recover error handling, and finally goes to HookFunc to execute the instrumentation code.

Next, we take net/http as an example to demonstrate how the automatic instrumentation at compile time instruments the monitoring code for the destination function (*Transport).RoundTrip(). The framework will generate the following TJump at the entry point of this function, which is an If statement (actually one line, but written in multiple lines for demonstration) and will go to TrampolineFunc:
func (t *Transport) RoundTrip(req *Request) (retVal0 *Response, retVal1 error) {
    if callContext37639, _ := OtelOnEnterTrampoline_RoundTrip37639(&t, &req); false { /* NO_NEWWLINE_PLACEHOLDER */
    } else {
        defer OtelOnExitTrampoline_RoundTrip37639(callContext37639, &retVal0, &retVal1)
    }
    return t.roundTrip(req)
}
The OtelOnEnterTrampoline_RoundTrip37639 is TrampolineFunc which prepares the error handling, calls the context, and then goes to the ClientOnEnterImpl:
func OtelOnEnterTrampoline_RoundTrip37639(t **Transport, req **Request) (*CallContext, bool) {
    defer func() {
        if err := recover(); err != nil {
            println("failed to exec onEnter hook", "clientOnEnter")
            if e, ok := err.(error); ok {
                println(e.Error())
            }
            fetchStack, printStack := OtelGetStackImpl, OtelPrintStackImpl
            if fetchStack != nil && printStack != nil {
                printStack(fetchStack())
            }
        }
    }()
    callContext := &CallContext{
        Params:     nil,
        ReturnVals: nil,
        SkipCall:   false,
    }
    callContext.Params = []interface{}{t, req}
    ClientOnEnterImpl(callContext, *t, *req)
    return callContext, callContext.SkipCall
}

var ClientOnEnterImpl func(callContext *CallContext, t *Transport, req *Request)
The HookFunc ClientOnEnterImpl is the instrumentation code, which can perform tracing and report metrics data. The ClientOnEnterImpl is a function pointer that is configured in advance in the otel_setup_inst.go automatically generated in the pre-processing. It points to the clientOnEnter:
// == otel_setup_inst.go
package otel_rules

import http328 "net/http"
...

func init() {
    http328.ClientOnEnterImpl = clientOnEnter
    ...
}

// == otel_rule_http59729.go
func clientOnEnter(call *http.CallContext, t *http.Transport, req *http.Request) {
    ...
       var tracer trace.Tracer
    if span := trace.SpanFromContext(req.Context()); span.SpanContext().IsValid() {
        tracer = span.TracerProvider().Tracer("")
    } else {
        tracer = otel.GetTracerProvider().Tracer("")
    }
    opts := append([]trace.SpanStartOption{}, trace.WithSpanKind(trace.SpanKindClient))
    ctx, span := tracer.Start(req.Context(), req.URL.Path, opts...)
    var attrs []attribute.KeyValue
    attrs = append(attrs, semconv.HTTPMethodKey.String(req.Method))
    attrs = append(attrs, attributes.MakeSpanAttrs(req.URL.Path, req.URL.Host, attributes.Http)...)
    span.SetAttributes(attrs...)
    bag := baggage.FromContext(ctx)
    if mem, err := baggage.NewMemberRaw(constants.BAGGAGE_PARENT_PID, attributes.Pid); err == nil {
        bag, _ = bag.SetMember(mem)
    }
    if mem, err := baggage.NewMemberRaw(constants.BAGGAGE_PARENT_RPC, sdktrace.GetRpc()); err == nil {
        bag, _ = bag.SetMember(mem)
    }
    sdktrace.SetGLocalData(constants.TRACE_ID, span.SpanContext().TraceID().String())
    sdktrace.SetGLocalData(constants.SPAN_ID, span.SpanContext().SpanID().String())
    ctx = baggage.ContextWithBaggage(ctx, bag)
    otel.GetTextMapPropagator().Inject(ctx, propagation.HeaderCarrier(req.Header))
    req = req.WithContext(ctx)
    *(call.Params[1].(**http.Request)) = req
    return
}
Through the above steps, we not only
instrument the monitoring code for the function (*Transport).RoundTrip() but also ensure its accuracy and context propagation. These operations are automatically performed at compile time, which saves a lot of time for developers and reduces the possibility of manual instrumentation errors.
To be commercially supported, we not only implement the basic non-intrusive automatic instrumentation but also perform many optimizations to ensure its high efficiency and reliability in the practical production environment. In this regard, we have paid special attention to the automatic propagation optimization for Context and Baggage. Additionally, in order to ensure that the use of the ARMS agent for Go applications does not affect the user's manual calls to the OpenTelemetry SDK code, we have also optimized its compatibility with OpenTelemetry SDK.
Context in OpenTelemetry is a mechanism for delivering information across multiple components and services. It can link distributed Spans together to form a complete trace. The following is a typical usage of Context:
func (tr *tracer) Start(
    ctx context.Context, // Query the Parent Span from ctx when creating a new Span
    name string,
    options ...trace.SpanStartOption
)(
    context.Context, // Save the newly created Span to the Context for propagation and subsequent use
    trace.Span
) { ... }
The design of OpenTelemetry requires users to propagate context.Context correctly. If a link in the trace does not propagate context.Context, only context.Background() or nil can be used when the tracer.Start is finally called. Although no error is reported, the trace will be interrupted.
To ensure that the trace is maintained even when the contex.Context is not propagated, we can save the newly created Span to the GLS when Go is running, and copy the Span information from the old GLS when a new goroutine is created. When a Span is needed, you can query the newly created Span from GLS as the Parent Span.
A Span is a structure similar to a stack, as shown below:
Span1
+----Span2
     +----Span3
+----Span4
When Span3 is created, its Parent Span is Span2. If both Span3 and Span2 are disabled, when Span4 is created, its Parent Span is Span1. Therefore, it is not enough to store only the latest Span. Instead, when the latest Span is disabled, you need to update the new unclosed Span. To solve this problem, we have designed a one-way linked list in GLS. Each time a Span is created, it is added to the end of the list and removed from the list when disabled. The latest unclosed Span at the end of the linked list is always returned when querying. Whenever a new trace starts, we will clear the Span linked list in GLS in case the existing Span is not properly disabled. With this mechanism, when the context.Context is context.Background() or nil, the recently created Span is automatically queried from GLS as the Parent Span. This protects the integrity of the trace. For more information about the above modifications, you can refer to skywalking-go.
Baggage is a data structure used in OpenTelemetry to store and share key-value pairs in trace. Baggage is stored in the context.Context and can be propagated along with the context.Context. The following is a typical usage of Baggage:
// Create a new Baggage
b := baggage.Baggage{}
m, _ = baggage.NewMember("env", "test")
b, _ = b.SetMember(m)

// Save the Baggage to ctx
ctx = baggage.ContextWithBaggage(ctx, b)

// Read the Baggage from ctx when needed
bag = baggage.FromContext(ctx)
Baggage is stored in the context.Context, which means that if context.Context is not propagated, the correct Baggage will not be read and the business function will be invalid. To solve this problem, we have adopted an optimization similar to Span: when the upstream Baggage is received or the call is baggage.ContextWithBaggage(ctx, b), the Baggage is saved to the GLS. If the ctx propagated in when calling baggage.FromContext(ctx) is the context.Background() or nil, it will try to read the Baggage from GLS. Similarly, if the ctx is empty when calling downstream services, it will also read the Baggage from GLS and instrument it into the protocol. When the new trace starts, we will clean up the Baggage in the GLS and copy the key-value pairs of the Baggage with special meaning into the new goroutine when creating one.
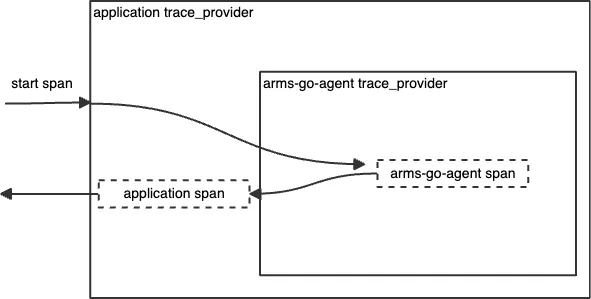
In the practical production environment, users not only pay attention to the telemetry data generated by third-party libraries and middleware but also use OpenTelemetry SDK to perform manual instrumentation to collect the running status of critical paths. To meet this requirement, we have optimized the compatibility with different versions of OpenTelemetry SDK. We use the shadow mechanism to ensure that the business code and the framework Span can be concatenated when the user manually calls the OpenTelemetry SDK code to coexist with the ARMS agent for Go applications.
The shadow mechanism means that the ARMS agent for Go applications itself maintains OpenTelemetry SDK with a set of minimal dependencies, modifies the package name, and deletes unnecessary dependencies to avoid dependency conflicts during compilation. At the same time, the ARMS agent for Go applications uses the bridge mode to wrap the trace_provider in the user's business code into the trace_provider provided by the ARMS agent for Go applications, thus bridging the Span generated in the user's business code to the Span generated by the ARMS agent for Go applications.

The preceding method allows the Span generated by the business that is instrumented through OpenTelemetry SDK and the Span generated by the ARMS agent for Go applications to report to the ARMS server together and display in the ARMS console, so you can migrate existing custom monitoring data at no cost.
The automatic instrumentation technology effectively solves the cumbersome manual instrumentation in microservices monitoring. By intelligently instrumenting monitoring code at compile time, the developers' workload is greatly reduced, and non-intrusion into business code is achieved. The commercially supported service of this solution has been launched and served Alibaba public cloud customers. Its convenience, efficiency, and ease of use have been tested in practice.
We have open sourced this solution and plan to donate it to the OpenTelemetry community. In the future, we will continue to promote the development of the open-source ecosystem and the sharing and iteration of technologies with practical actions to provide efficient observability solutions for the community, Golang developers on Alibaba Cloud, and enterprise users, thus helping users better manage and optimize application performance and stability under the microservices model.
Implement Auto Instrumentation under GraalVM Static Compilation on OTel Java Agent
Spring Cloud Alibaba Integrates the Distributed Scheduled Task Scheduling

675 posts | 56 followers
FollowOpenAnolis - December 24, 2024
Alibaba Cloud Native Community - April 18, 2025
Alibaba Cloud Native Community - August 5, 2025
Alibaba Cloud Native Community - August 19, 2025
Alibaba Cloud Native Community - November 18, 2024
Alibaba Cloud Native Community - September 4, 2025

675 posts | 56 followers
Follow Application Real-Time Monitoring Service
Build business monitoring capabilities with real time response based on frontend monitoring, application monitoring, and custom business monitoring capabilities
Learn More Managed Service for Prometheus
Multi-source metrics are aggregated to monitor the status of your business and services in real time.
Learn More Real-Time Livestreaming Solutions
Stream sports and events on the Internet smoothly to worldwide audiences concurrently
Learn More Enterprise Distributed Application Service
A PaaS platform for a variety of application deployment options and microservices solutions to help you monitor, diagnose, operate and maintain your applications
Learn MoreMore Posts by Alibaba Cloud Native Community