By Musi
As the concept of cloud-native continues to gain traction, the Golang programming language has become increasingly popular. More and more developers are using Golang to write applications and programming libraries. However, despite OpenTelemetry becoming the actual standard for observability, the official support for Golang in OpenTelemetry is not fully mature. Developers are mostly limited to manual instrumentation using the opentelemetry-go SDK.
Today, the Programming Language and Compiler team, along with the Alibaba Cloud Observability team, have developed a Golang Agent 0.1.0-RC version that adheres to the OpenTelemetry specification. The goal is to achieve non-intrusive observability of Golang applications through automatic instrumentation at compile time.
Many may wonder, The OpenTelemetry community is already quite mature, so why do we need this OpenTelemetry Golang Agent? Let's take a look from the perspective of a Golang developer at the available options in the OpenTelemetry community for monitoring Golang applications.
When you enter the community, the most starred project you will see is the opentelemetry-go SDK. Using the SDK for manual instrumentation is indeed convenient for smaller projects. For example, if a user needs to measure the duration of an interface, he can simply add a Span before and after the interface.
func parentMethod(ctx context.Context) {
  tracer := otel.Tracer("otel-go-tracer")
  ctx, span := tracer.Start(ctx, "parent span")
  fmt.Println(span.SpanContext().TraceID()) // Print the trace ID
  span.SetAttributes(attribute.String("key", "value"))
  span.SetStatus(codes.Ok, "Success")
  childMethod(ctx)
  span.End()
}
However, as the project iterates, users need to manually instrument an increasing number of methods. If the user's business logic expands from a single method call to a chain like A->B->C, the user must add the same instrumentation logic to both methods B and C, and also pass the context from one layer to the next. As the project scales, the cost of monitoring the Go application increases linearly with each iteration.
func main() {
  shutdown := otel_util.InitOpenTelemetry()
  defer shutdown()

  for i:= 0; i < 10; i++ {
    ctx := context.Background()
    parentMethod(ctx)
  }
  time.Sleep(10 * time.Second)
}

func parentMethod(ctx context.Context) {
  tracer := otel.Tracer("otel-go-tracer")
  ctx, span := tracer.Start(ctx, "parent span")
  fmt.Println(span.SpanContext().TraceID()) // Print the trace ID
  span.SetAttributes(attribute.String("key", "value"))
  span.SetStatus(codes.Ok, "Success")
  childMethod(ctx)
  span.End()
}

func childMethod(ctx context.Context) {
  tracer := otel.Tracer("otel-go-tracer")
  ctx, span := tracer.Start(ctx, "child span")
  span.SetStatus(codes.Ok, "Success")
  grandChildMethod(ctx)
  span.End()
}

func grandChildMethod(ctx context.Context) {
  tracer := otel.Tracer("otel-go-tracer")
  ctx, span := tracer.Start(ctx, "grandchild span")
  span.SetStatus(codes.Error, "error")

  // Business code...

  span.End()
}
Even if users can manually instrument new code as the project iterates, historical code debt can still hinder the effective monitoring of Golang applications. For instance, in a trace like A->B->C->D->...->Z, if the parameters of a method lack the necessary context or contain incorrect context due to historical reasons, it can cause the entire trace to fail to be connected in series. In complex applications, it takes significant time to accurately identify and fix these context propagation issues, leading to high monitoring costs.
func parentMethod(ctx context.Context) {
  tracer := otel.Tracer("otel-go-tracer")
  ctx, span := tracer.Start(ctx, "parent span")
  fmt.Println(span.SpanContext().TraceID()) // Print the trace ID
  span.SetAttributes(attribute.String("key", "value"))
  span.SetStatus(codes.Ok, "Success")
  childMethod(context.TODO()) // The incorrect context was passed for historical reasons
  span.End()
}

func childMethod(ctx context.Context) {
  tracer := otel.Tracer("otel-go-tracer")
  ctx, span := tracer.Start(ctx, "child span")
  span.SetStatus(codes.Ok, "Success")
  grandChildMethod(ctx)
  span.End()
}Due to the complexity introduced by SDK manual instrumentation, the OpenTelemetry community also provides some methods for automatic instrumentation. The officially provided automatic instrumentation method is based on eBPF. With this solution, users do not need to manually modify their business code using the SDK. eBPF can automatically detect Golang applications and collect data related to HTTP, database, and RPC calls, while it also automatically passes through user context to ensure the integrity of the entire trace.
You might wonder: this automatic instrumentation seems perfect, so why not just use it? Though eBPF instrumentation has the above advantages, there are also some limitations:
Given that SDK manual instrumentation is cumbersome and eBPF automatic instrumentation has many limitations, is there a solution that addresses both concerns? OpenTelemetry offers a compile-time automatic instrumentation tool called InstrGen in its contrib repository. InstrGen can parse the syntax tree of the entire project during compilation and insert code at specified methods to enable application monitoring. This compile-time instrumentation solution effectively addresses the pain points of both manual and eBPF automatic instrumentation, theoretically "helping" the user write code with high flexibility. However, InstrGen also has several drawbacks:
The newly open-sourced OpenTelemetry Golang Agent follows a similar approach to InstrGen, automatically instrumenting the user's code during compilation. Normally, the go build command goes through the following main steps to compile a Golang application:
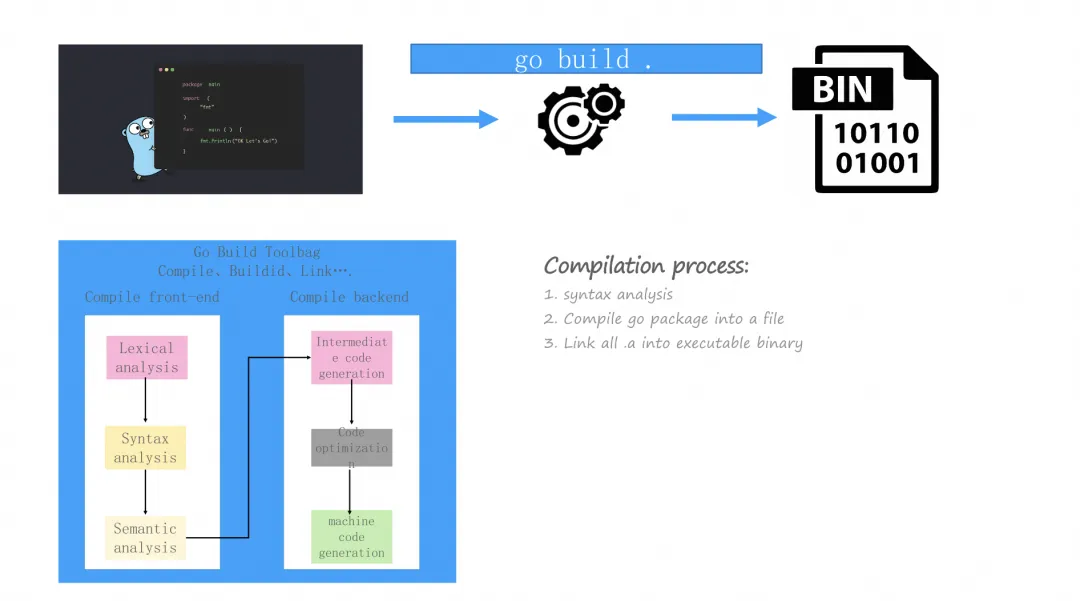
When using the OpenTelemetry Golang Agent, two additional stages are inserted before the above steps: preprocessing and code instrumentation.
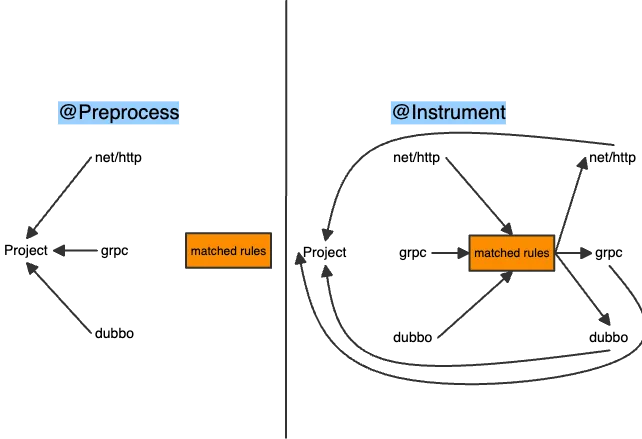
At this stage, the tool analyzes the third-party library dependencies of the user project code, matches them with the existing instrumentation rules to find the appropriate ones, and configures the additional dependencies required for these instrumentation rules in advance.
The instrumentation rules define the code to be injected into the specific version of the specific framework and standard library. Different types of instrumentation rules are used for different purposes. Currently, the existing types of instrumentation rules include:
• InstFuncRule: Instrument the code when a method enters and exits
• InstStructRule: Modify the struct to add a field
• InstFileRule: Add a file to participate in the original compilation process
Once all preprocessing work is ready, the tool calls go build -toolexec otelbuild cmd/app to start the compilation. The -toolexec parameter is the core of automatic instrumentation and is used to intercept the regular build process and replace it with a user-defined tool, allowing developers to customize the build process more flexibly. Here, otelbuild is the automatic instrumentation tool, leading to the code instrumentation stage.
At this stage, the trampoline jump will be inserted for the destination function according to the rules. The trampoline jump is essentially a complex If statement that allows the insertion of instrumentation code at the entry and exit points of the destination function to collect monitoring data. Additionally, multiple optimizations will be performed at the AST level to minimize the performance overhead of the trampoline jump and enhance code execution efficiency.
After completing these steps, the tool modifies the compilation parameters and then calls go build cmd/app for normal compilation, as described earlier.
Once the compilation is complete, the automatic instrumentation logic is compiled into the generated binary. The open source OpenTelemetry Golang Agent provided by the Alibaba Cloud Observability team successfully addresses some pain points of InstrGen:
In OpenTelemetry, the Context is a mechanism used to pass information across multiple components and services. It can link distributed Spans together to form a complete Trace. Here is a typical usage of Context:
func (tr *tracer) Start(
    ctx context.Context, // When creating a new Span, query the Parent Span from ctx
    name string,
    options ...trace.SpanStartOption
)(
    context.Context, // Save the newly created Span to the context for transfer and subsequent use
    trace.Span
) { ... }
The design of OpenTelemetry requires users to correctly propagate context.Context. If context.Context is not propagated at any point in the trace, only context.Background() or nil can be used when tracer.Start is finally called. Although this will not cause an error, it will interrupt the trace.
To maintain the trace even when context.Context is not propagated, we also save the newly created Span in the Golang runtime's goroutine structure (GLS). When a new goroutine is created, it copies the GLS data from the current goroutine. When a new Span needs to be created later, it can query the current Span from the GLS as the Parent.
A Span is a stack-like structure, as shown below:
Span1
+----Span2
     +----Span3
+----Span4
When Span3 is created, its Parent is Span2. If both Span3 and Span2 are disabled, when Span4 is created, its Parent should be Span1. Therefore, storing only the most recent Span is not sufficient; when the most recent Span is closed, the next newest Span that is unclosed should be updated. To solve this problem, we designed a one-way linked list in the GLS. Each time a Span is created, it is added to the end of the linked list and removed from the list when the Span is closed. The query always returns the most recent unclosed Span at the end of the list. Whenever a new Trace starts, we clear the Span list in the GLS to prevent existing Spans from not being properly closed. Through this mechanism, when context.Context is context.Background() or nil, it automatically queries the most recently created Span from the GLS as the Parent, thus preserving the integrity of the trace.
Baggage is a data structure in OpenTelemetry used to store and share key-value pairs within a Trace. Baggage is stored in context.Context and can be propagated along with context.Context. Here is a typical usage of Baggage:
// Create a new Baggage
b := baggage.Baggage{}
m, _ = baggage.NewMember("env", "test")
b, _ = b.SetMember(m)

// Store the Baggage to ctx
ctx = baggage.ContextWithBaggage(ctx, b)

// Read Baggage from ctx when it is needed
bag = baggage.FromContext(ctx)
Baggage is stored in context.Context, which means that if context.Context is not propagated, the correct Baggage cannot be read, and the business functionality will fail. To solve this problem, we adopt an optimization similar to Span: when the upstream Baggage is received or the baggage.ContextWithBaggage(ctx, b) is called, Baggage is saved to the GLS. If baggage.FromContext(ctx) is called with the passed ctx being context.Background() or nil, it will attempt to read the Baggage from the GLS. Similarly, when calling downstream services, if ctx is empty, it will read the Baggage from the GLS and inject it into the protocol. At the start of a new Trace, we clear the Baggage in the GLS, and when creating a new goroutine, we copy the Baggage key-value pairs with special meaning to the new goroutine.
The OpenTelemetry Golang Agent 0.1.0-RC offers richer plugin support, including the following commonly used frameworks:
| Plugin Name | Repository Url | Min Supported Version | Max Supported Version |
|---|---|---|---|
| database/sql | https://pkg.go.dev/database/sql | - | - |
| echo | https://github.com/labstack/echo | v4.0.0 | v4.12.0 |
| gin | https://github.com/gin-gonic/gin | v1.7.0 | v1.10.0 |
| go-redis | https://github.com/redis/go-redis | v9.0.5 | v9.5.1 |
| gorm | https://github.com/go-gorm/gorm | v1.22.0 | v1.25.9 |
| logrus | https://github.com/sirupsen/logrus | v1.5.0 | v1.9.3 |
| mongodb | https://github.com/mongodb/mongo-go-driver | v1.11.1 | v1.15.2 |
| mux | https://github.com/gorilla/mux | v1.3.0 | v1.8.1 |
| net/http | https://pkg.go.dev/net/http | - | - |
| zap | https://github.com/uber-go/zap | v1.20.0 | v1.27.0 |
The project provides extensive documentation to help users better understand and participate in the project. The documentation includes:
• How it works: https://github.com/alibaba/opentelemetry-go-auto-instrumentation/blob/main/docs/how-it-works.md
• How to add a plugin: https://github.com/alibaba/opentelemetry-go-auto-instrumentation/blob/main/docs/how-to-add-a-new-rule.md
• How to debug a project: https://github.com/alibaba/opentelemetry-go-auto-instrumentation/blob/main/docs/how-to-debug.md
• How to write tests for plugins: https://github.com/alibaba/opentelemetry-go-auto-instrumentation/blob/main/docs/how-to-write-tests-for-plugins.md
• Project compatibility: https://github.com/alibaba/opentelemetry-go-auto-instrumentation/blob/main/docs/compatibility.md
• Performance stress testing: https://github.com/alibaba/opentelemetry-go-auto-instrumentation/blob/main/example/benchmark/benchmark.md
• Demo document: https://github.com/alibaba/opentelemetry-go-auto-instrumentation/blob/main/example/demo/README.md
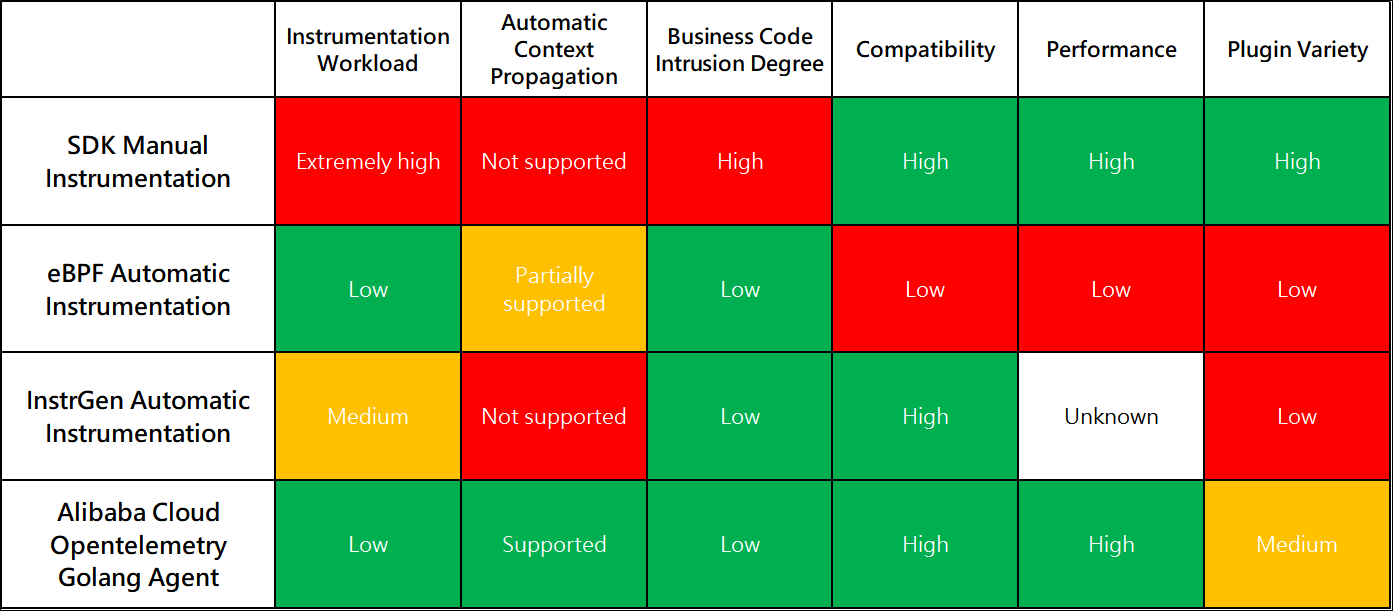
It can be seen that Alibaba Cloud OpenTelemetry Golang Agent has notable advantages in terms of usability, instrumentation workload, and other aspects.
We warmly welcome users to use and contribute to the project. If you encounter any questions during usage, we recommend you first view the various documents available in the project.
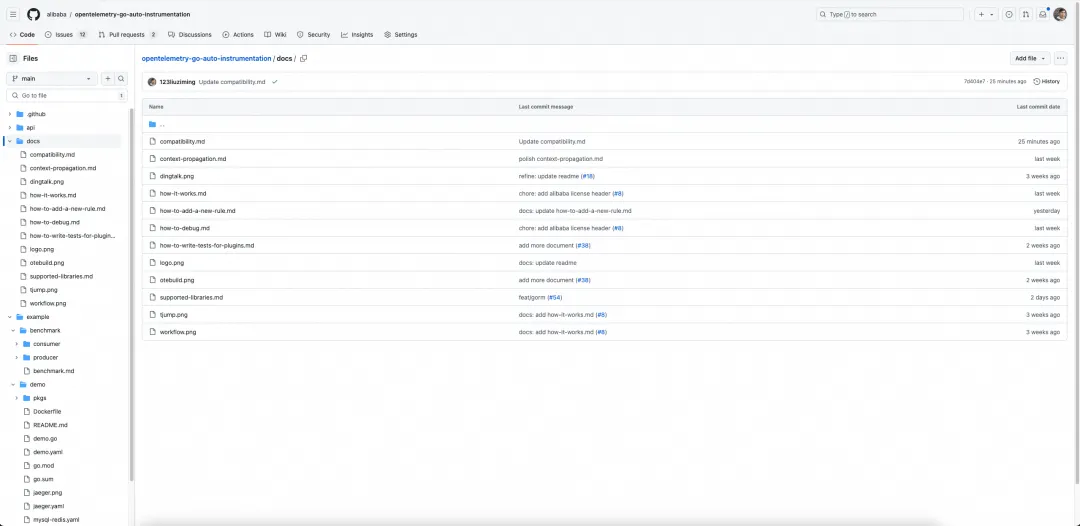
First, we suggest you run the demo of this project to familiarize yourself with the basic workflow. The project provides a demo usage guide to help new users quickly get started with the OpenTelemetry Golang Agent and view the reported data in Jaeger.
If you find any bugs or areas that do not meet your needs while using the project, please provide a detailed description of your issue in the community issue list. Additionally, if you wish to contribute to the community, you can filter for issues labeled "contribution welcome" in the issue list and leave a comment under the issue. Community members will promptly assign the issue to you and assist you in submitting the PR.
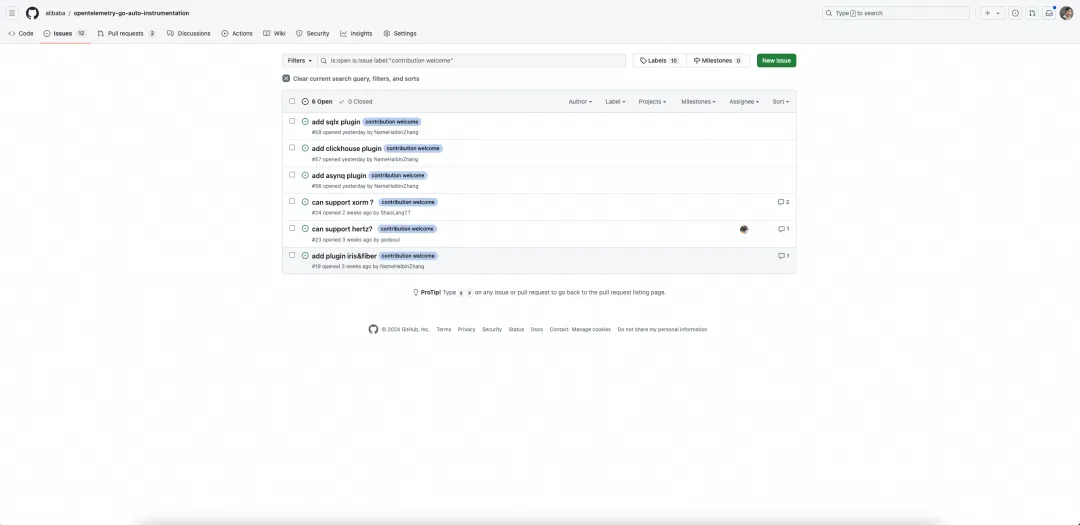
When submitting an issue to the community, you can follow the issue template provided by the community:
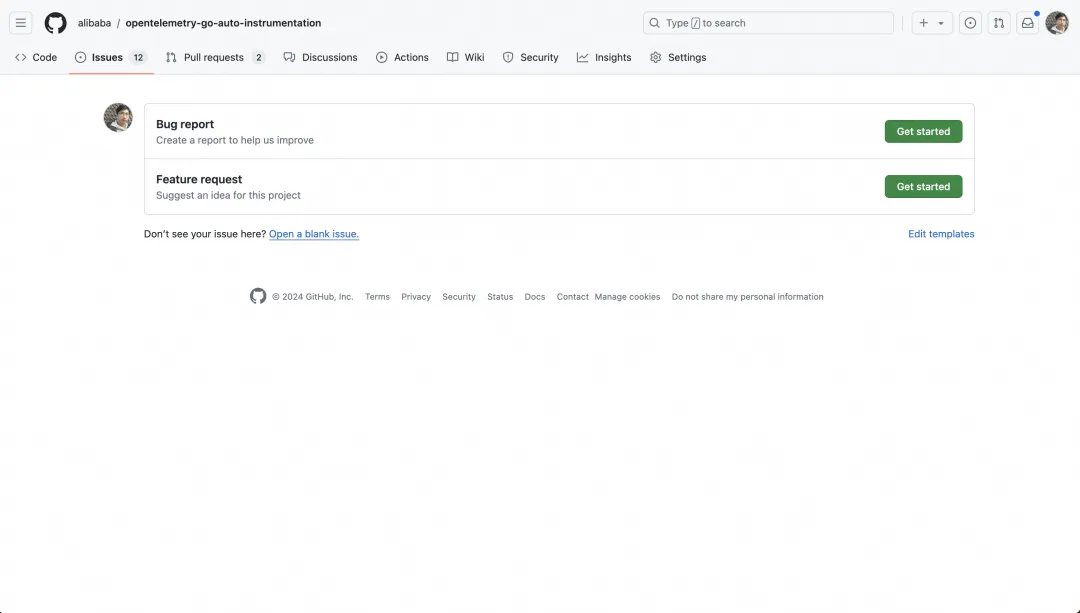
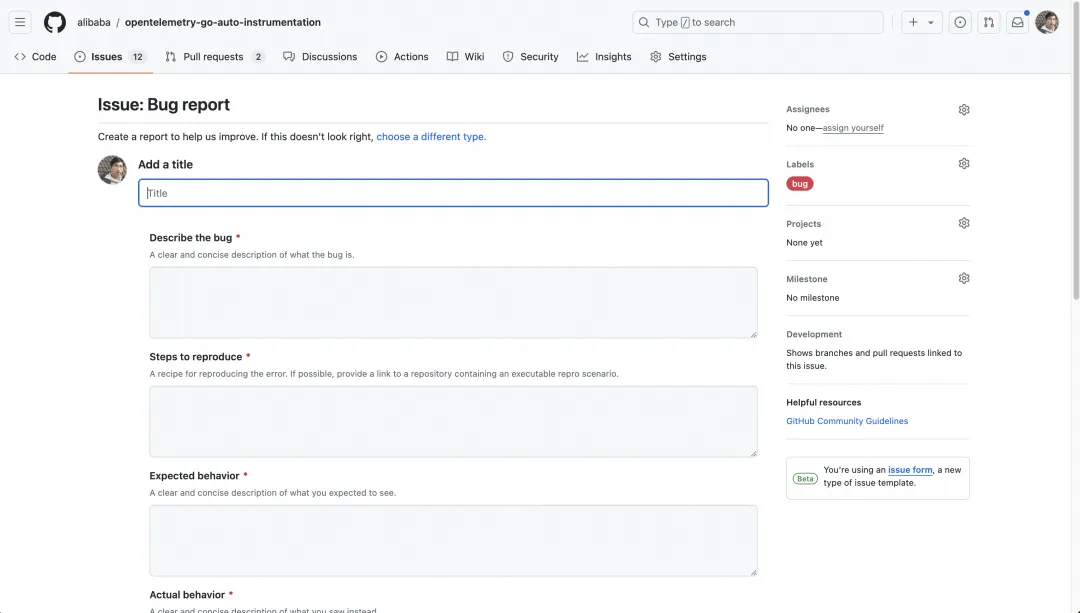
Use the Bug report template to report any bugs you encounter:
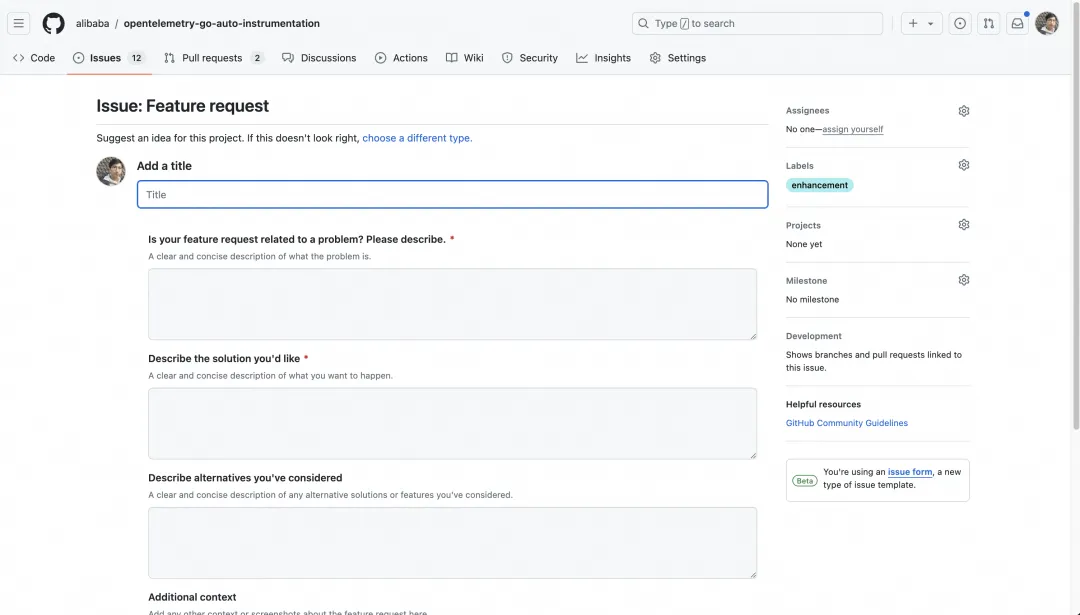
Use the Feature request template to suggest new features you would like to see:
The 0.1.0-RC version is the first release of the OpenTelemetry Golang Agent, currently only supporting trace capabilities for a limited set of frameworks. Our main plans moving forward are as follows:
• Support for more plugins: Commonly used frameworks such as Hertz, Kitex, and Elasticsearch.
• Support for OpenTelemetry metrics statistical analysis and reporting: The current OpenTelemetry metrics specification is not yet fully stable. We will proceed with support once the specification stabilizes.
• Support for Golang runtime metrics reporting: It helps users better monitor key information such as GC frequency and memory usage in Golang.
• Support for continuous CPU/memory profiling and hotspot code analysis.
We plan to donate this open source project to CNCF OpenTelemetry. For the donation proposal, see https://github.com/open-telemetry/community/issues/1961
Open source project address: Link
Faster and Stronger: SLS Introduces High-performance SPL Log Query Mode

673 posts | 56 followers
FollowAlibaba Cloud Native Community - August 5, 2025
Alibaba Cloud Native Community - August 19, 2025
Alibaba Cloud Native Community - October 15, 2024
Alibaba Cloud Native Community - April 18, 2025
Alibaba Cloud Native Community - March 19, 2025
Alibaba Cloud Native Community - March 11, 2026

673 posts | 56 followers
Follow Simple Log Service
An all-in-one service for log-type data
Learn More Managed Service for Prometheus
Multi-source metrics are aggregated to monitor the status of your business and services in real time.
Learn More Cloud-Native Applications Management Solution
Accelerate and secure the development, deployment, and management of containerized applications cost-effectively.
Learn More Lindorm
Lindorm is an elastic cloud-native database service that supports multiple data models. It is capable of processing various types of data and is compatible with multiple database engine, such as Apache HBase®, Apache Cassandra®, and OpenTSDB.
Learn MoreMore Posts by Alibaba Cloud Native Community