By Wupeng

OpenTelemetry is an observability project of the Cloud Native Computing Foundation (CNCF). It aims to provide a standardized solution for the field of observability, solving the standardization of data models, collection, processing, and export of observational data. Moreover, it also provides services unrelated to third-party vendors.
OpenTelemetry's tracing specification reached version 1.0 on February 10, 2021. Based on this milestone, OpenTelemetry will be explored in this article, and its value and development prospects in the observability field will be judged as well.
The following sections will explain OpenTelemetry.
Taken from the What Is OpenTelemetry? page on the official website:
OpenTelemetry is a set of APIs, SDKs, tooling, and integrations that are designed for the creation and management of telemetry data, such as traces, metrics, and logs. New types of observational data may emerge in the future.
The project provides a vendor-agnostic implementation that can be configured to send telemetry data to the backend(s) of your choice. It supports a variety of popular open-source projects, including Jaeger and Prometheus.
OpenTelemetry is not an observability backend like Jaeger or Prometheus. Instead, it supports exporting data to a variety of open-source and commercial backends. It provides a pluggable architecture so additional technology protocols and formats can be easily added.
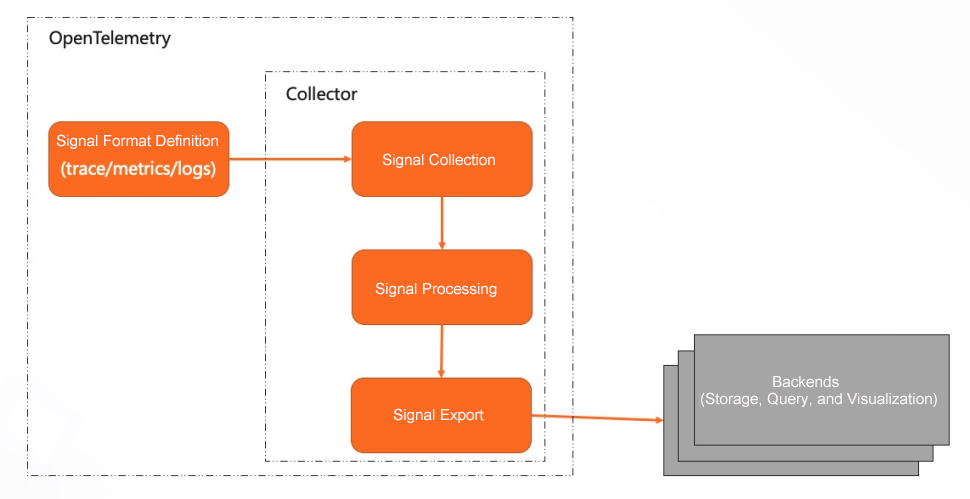
In short, OpenTelemetry does not provide backend services related to observability. These backend services usually provide services, such as storage, query, and visualization.
The following diagram can be used to understand the working scope of OpenTelemetry:
Wikipedia defines observability as, "In control theory, observability is a measure of how well internal states of a system can be inferred from knowledge of its external outputs."
Consider a physical system modeled in state-space representation. A system is said to be observable if, for any possible evolution of state and control vectors, the current state can be estimated using only the information from outputs. Physically, this generally corresponds to information obtained by sensors. In other words, one can determine the behavior of the entire system from the system's outputs. On the other hand, if the system is not observable, there are state trajectories that are not distinguishable by only measuring the outputs.
In summary, observability is a method to derive the internal state of the system from its external output.
The following diagram simplifies the system composition and interaction between systems:
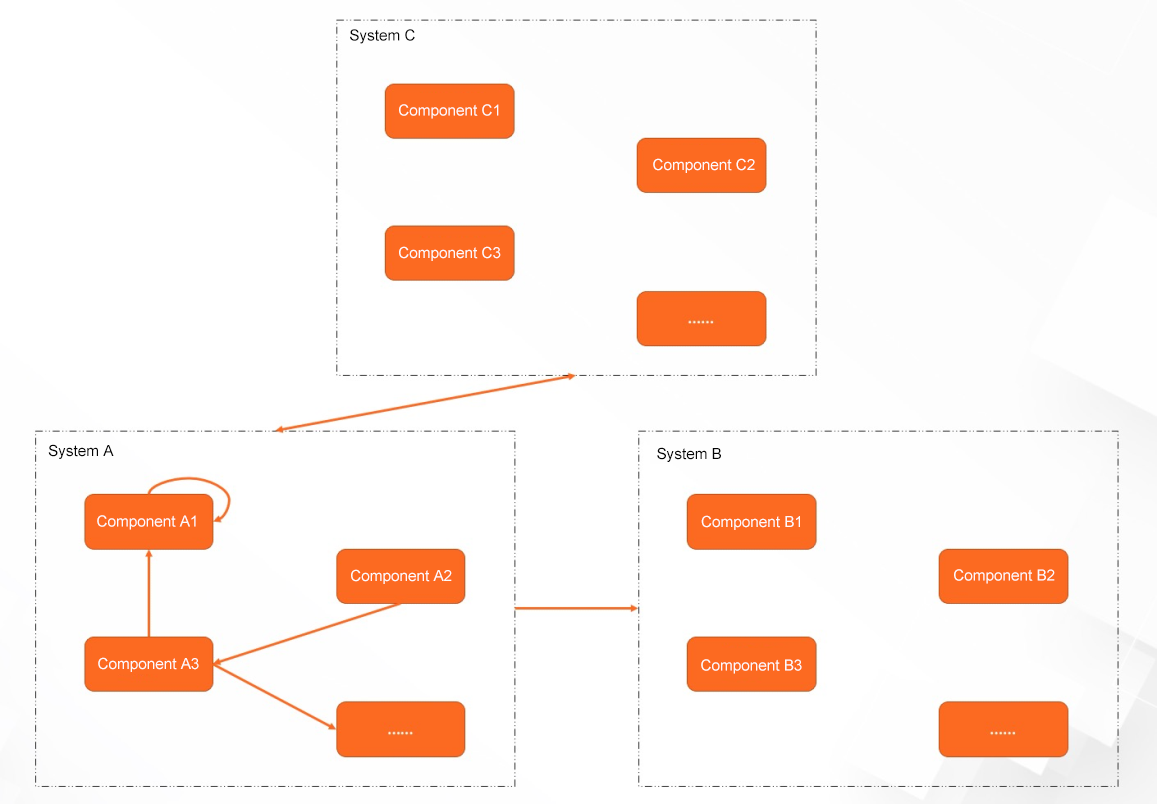
From the interaction diagram above, the interaction behavior of the system has the following forms:
As such, if one wants to know the status of the system through the external output of the system, two forms of information are needed:
The first form can usually be characterized by logs or metrics, while the second form needs to be characterized by trace, adding flags in the flowing information.
The differences between logs and metrics can be understood through their operation methods.
Abstractly, observability involves the following problems:
These are problem domains and specific problems that OpenTelemetry faces, and the specific problems are limited in:
OpenTelemetry standardizes the data model of observational data through specification, and the collection, processing, and export methods, including trace, metrics, and logs. New types of observational data may emerge in the future. For more information, please see OpenTelemetry - specification.
Meanwhile, it is described by protocol buffers for ease of use. For more information, please see OpenTelemetry-proto.
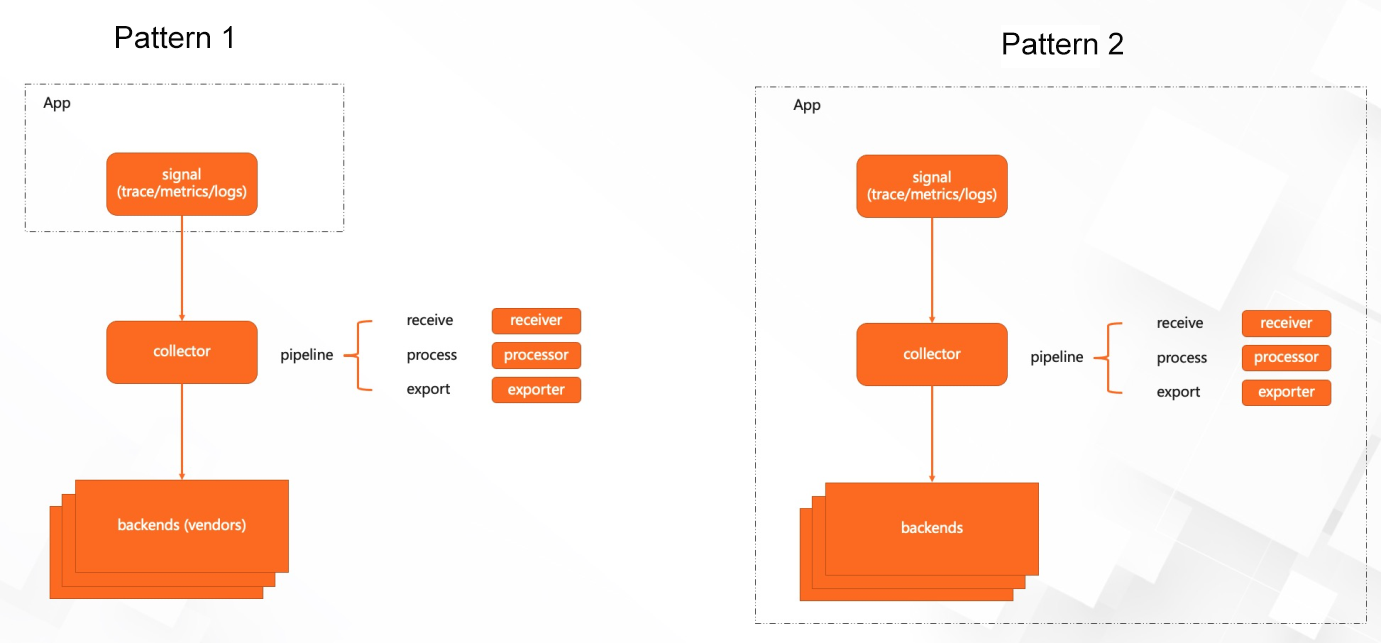
Based on the Specification, OpenTelemetry has made the following efforts to generate and process observational data:
The following diagram shows the components and workflows of OpenTelemetry:
The information below is from CNCF's article entitled, A brief history of OpenTelemetry (So Far). OpenTelemetry is composed of two open-source projects:
The two open-source projects were merged and officially announced as the open-source OpenTelemetry project in May 2019.
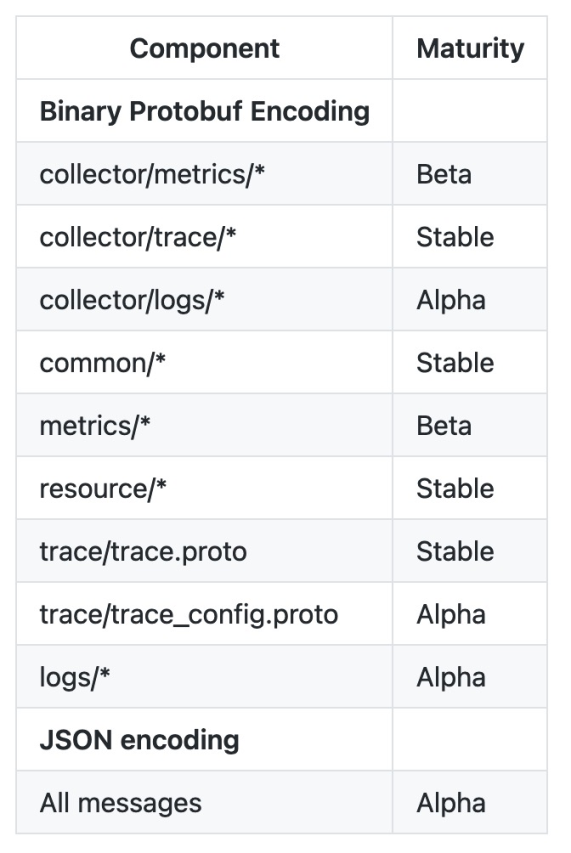
Trace specification reached version 1.0 in February 2021. According to the official maturity model, the specification of trace has reached the stable level, and the specification of metrics has reached the beta level, but the specification of logs is still at the alpha level:
More vendors have paid attention and contributed to OpenTelemetry since its launch.
From OpenTelemetry-Collector-contributions, you can see vendors have focused on the exporter, simply importing the observational data into their own services, which already includes Alibaba Cloud's SLS products:
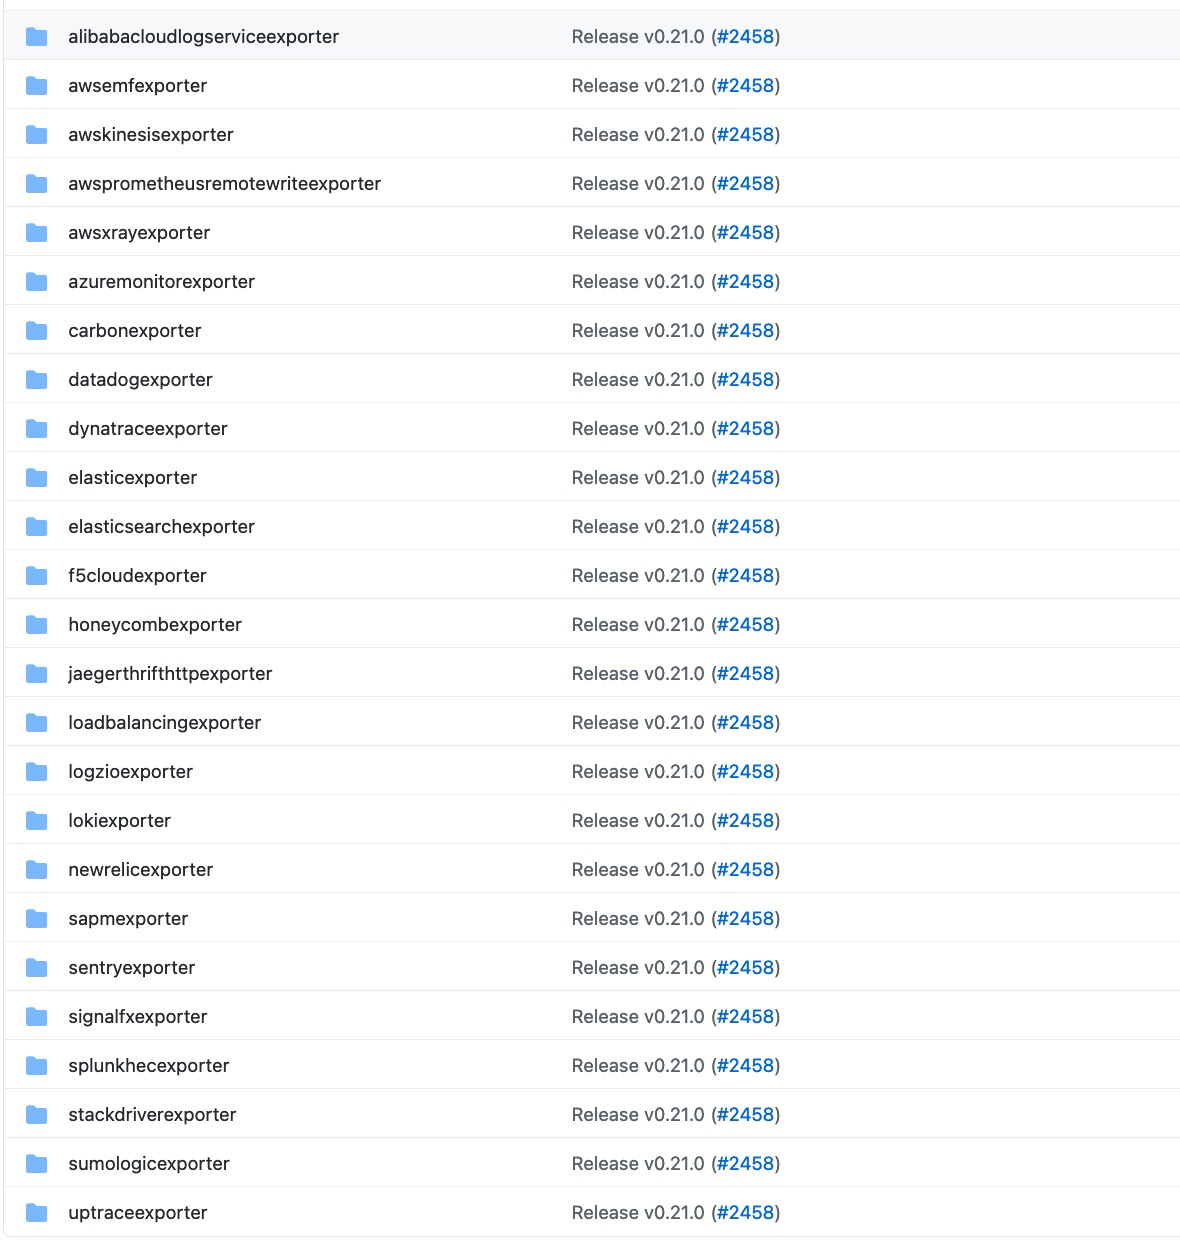
It is believed that vendors will gradually put more effort into the receiver and processor. For example:
For multi-cloud scenarios, the observational data model and the standards of collection, processing, and export defined by OpenTelemetry allow users to connect to multiple cloud vendors through a set of observability standards to avoid vendor lock.
Even if services are provided for a single cloud service, such as internal services of cloud vendors, issues, such as future open-source and external co-construction will be inevitably considered. Open-source costs can also be reduced with observability standards from the community. Furthermore, the concepts, standards, and technologies of observability are evolving constantly. The technology benefits and impact brought by the community can be used better by following up with the community.
Therefore, it is necessary to adopt the industry's observability standards for multi-cloud scenarios and a single cloud vendor.
OpenTelemetry has many concepts. Some common concepts are listed below:
• Related Observational Data
Signal
Instrument
• Related OpenTelemetry Projects
APIs
SDKs
Contribution Packages
• Used Components
Components
Receivers
Processors
Exporters
Extensions
Services
Collector
Controller
Here is a Golang demo that has been written to demonstrate:
For the demo, please see this GitHub link
For specific usage methods, please see the README.md section of the demo. The following is a brief description of the idea:
The cmd/app/server.go file describes the logic of OpenTelemetry and includes two parts:
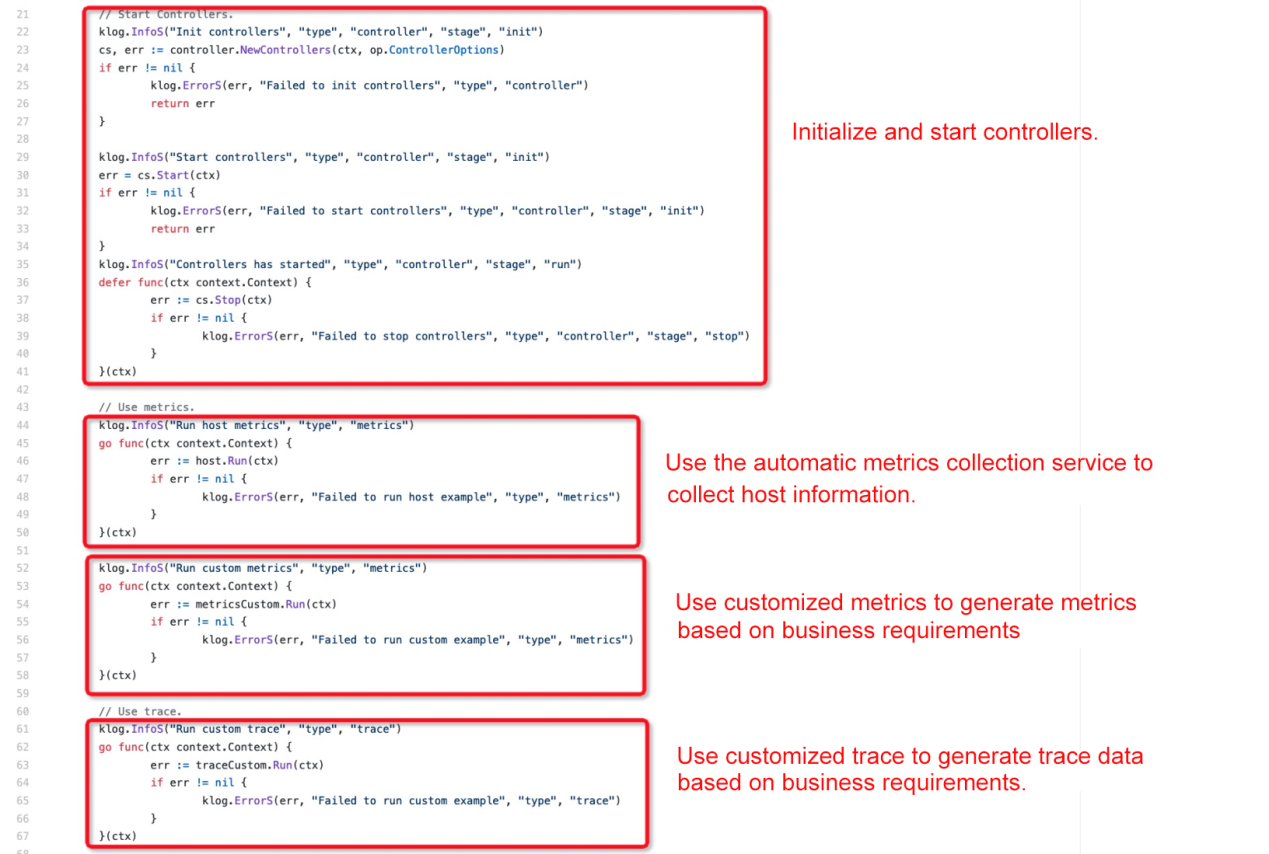
The pkg/ directory encapsulates the controller and signal (trace and metrics), respectively.

An example of exporting observational data to SLS is provided in yaml/, which includes the receiver for receiving observational data that the client can use to push data to the receiver through the gRPC client, processors for data conversion, exporters for data export, and services for enabling components:
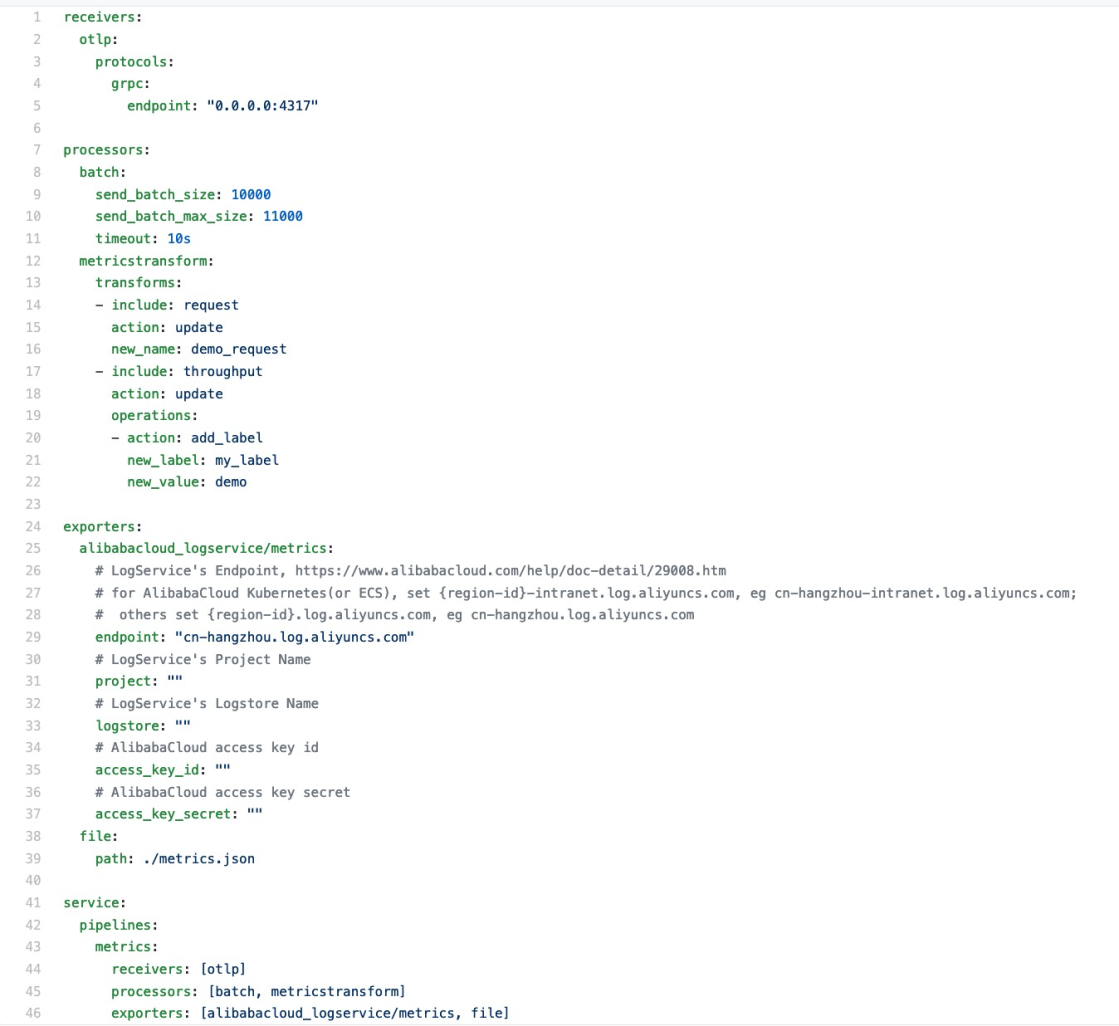
You will gain an intuitive experience of OpenTelemetry's concept, problem domain, solutions, and usage through the analysis above. Also, you can quick start OpenTelemetry through the Golang demo above.
For developers, OpenTelemetry can be used to generate and export traces, metrics, and logs. This reduces the cost of using different types of observational data during development and the cost of connecting to different backend services, such as the open-source project Prometheus or the services of third-party cloud vendors.
For SREs, OpenTelemetry can provide a set of standard data collection, processing, and export processes for observational data and standardize the data during the processing according to the team's requirements. By doing so, it is convenient for the subsequent use of standardized solutions, such as data monitoring and alarm.
Meanwhile, developers and SRE can use the community to continuously iterate their understanding of the observability problem domain and obtain the technical benefits. Then, they can provide feedback on the best practices generated in production to the community, promoting the development of the observability field.
You are welcome to leave a comment on the stability assurance issues while using Kubernetes and the stability assurance tools or services you are looking forward to using.
Go MySQL Driver Integrates Seata-Golang to Solve Distributed Transactions

666 posts | 55 followers
FollowDavidZhang - June 14, 2022
Alibaba Developer - August 9, 2021
Alibaba Cloud Native Community - March 19, 2025
Alibaba Container Service - October 12, 2024
Alibaba Cloud Native Community - March 2, 2026
Alibaba Developer - March 3, 2020

666 posts | 55 followers
Follow Simple Log Service
An all-in-one service for log-type data
Learn More Container Service for Kubernetes
Alibaba Cloud Container Service for Kubernetes is a fully managed cloud container management service that supports native Kubernetes and integrates with other Alibaba Cloud products.
Learn More Log Management for AIOps Solution
Log into an artificial intelligence for IT operations (AIOps) environment with an intelligent, all-in-one, and out-of-the-box log management solution
Learn More Resource Management
Organize and manage your resources in a hierarchical manner by using resource directories, folders, accounts, and resource groups.
Learn MoreMore Posts by Alibaba Cloud Native Community