By Xia Ming (Yahai)
With the rise of cloud-native architectures, observability boundaries and division of responsibilities are redefined. Traditional container/application/business hierarchical monitoring boundaries are broken. The division of labor among Dev, Ops, and Sec is blurred. We realize that the IT system is an organic whole, and the monitoring and diagnosis of IT system status needs an integrated scheme. After years of exploration and practice, the new generation of cloud-native observability systems based on OPLG has become a popular choice for communities and enterprises.
OPLG refers to the unified display of (O)penTelemetry Traces, (P)rometheus Metrics, and (L)oki Logs through (G)rafana Dashboards to meet most scenarios of enterprise-level monitoring and analysis, as shown in the following figure (images from Youtube Grafana Labs). Based on the OPLG system, you can quickly build a unified observability platform covering the full stack of cloud-native applications. It can comprehensively monitor infrastructure, containers, middleware, applications, and user experiences. It organically integrates traces, metrics, logs, and events to achieve stable O&M and commercial analysis goals.
Xiao Ming joined a fashion brand buyer company to help young people find good quality fashion goods. With the expansion of business scale, the requirements of system stability and commercialization analysis for global observability are rising, and the failure of the underlying system affects business revenue and customer satisfaction. Therefore, Xiao Ming's IT department has built a brand-new observability platform through the OPLG system, which has the advantages of fast access, flexible expansion, seamless migration, and heterogeneous integration.
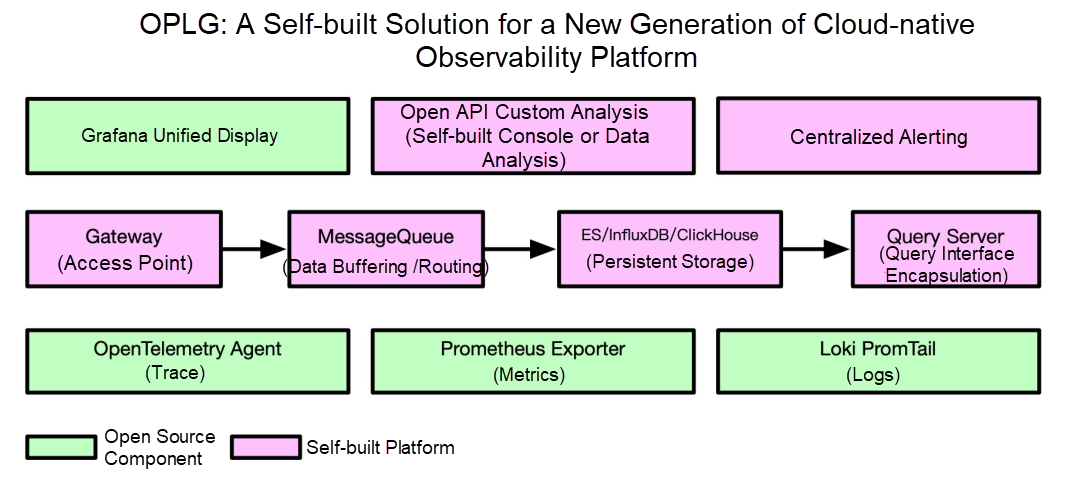
The OPLG system has many advantages, but enterprises will face multiple challenges, especially in the process of in-depth use. Many non-functional issues will become prominent (such as large-scale operation and maintenance, performance, and cost).
The preceding problems are all classic problems that enterprises will face in the process of building observability systems. These performance and availability problems caused by scale require a large amount of R&D and time to precipitate, which increases the operation and maintenance costs of enterprises. Therefore, more enterprises choose to host observability servers to cloud service providers. While enjoying the technical dividends of open-source solutions, they can obtain continuous and stable service guarantees.
The IT department where Xiao Ming works decided to adopt the OPLG hosting solution provided by Alibaba Cloud ARMS to reduce O&M costs and provide observability services stably. This solution provides high-performance, highly available, and O&M-free backend services while retaining the advantages of the open-source solution, helping Xiao Ming's team solve the problem of large-scale O&M in massive data scenarios. In addition, the coverage and integration of observability data are improved through eBPF network detection, Satellite edge computing, and Insights intelligent diagnosis, as shown in the following figure.
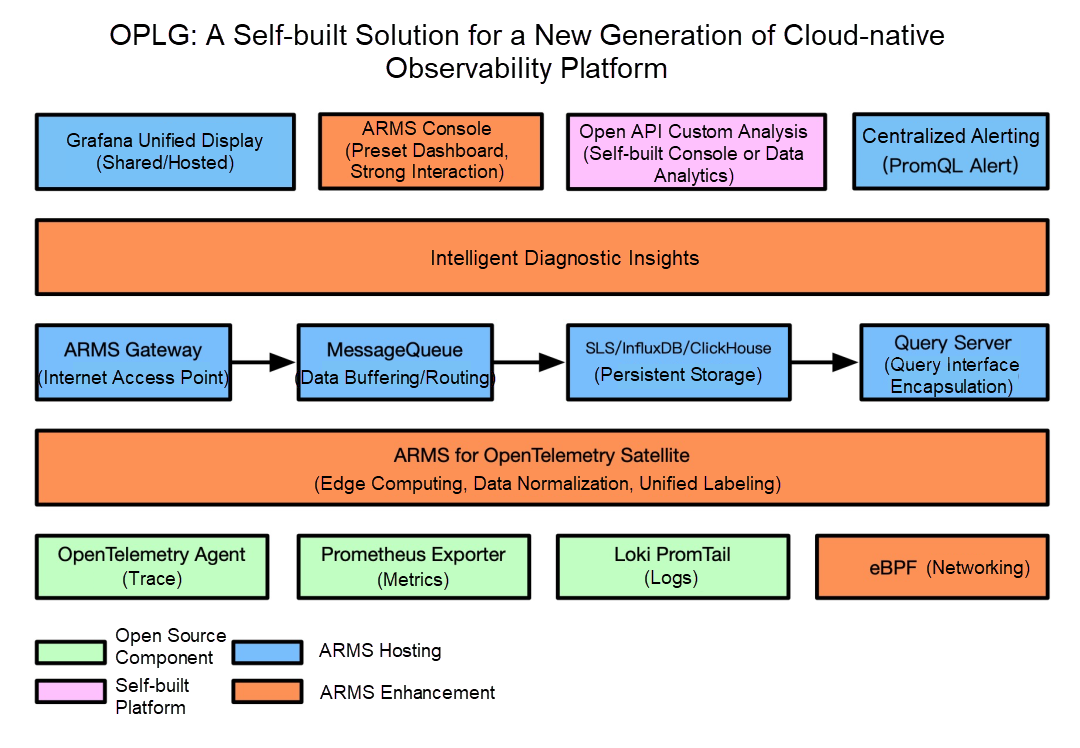
Communities (such as OpenTelemetry and SkyWalking) have been developing edge cluster collection and computing Satellite solutions over the past two years. ARMS for OpenTelemetry Satellite (ARMS Satellite) is a unified edge-side collection and processing platform for observability data (Traces, Metrics, and Logs) developed based on the OpenTelemetry Collector. It is safe, reliable, and easy to use. It is suitable for access to production environments.
ARMS Satellite enables the standardization of multi-source heterogeneous data through data collection, processing, caching, and routing at the edge. It enhances the correlation among the observability data of traces, metrics, and logs. It supports lossless statistics and reduces the cost of data reporting and persistent storage.
ARMS Satellite is deeply integrated with the Alibaba Cloud Kubernetes monitoring component and the Prometheus monitoring component in the Container Service ACK environment. After one-click installation is completed, the Kubernetes container resource layer and network performance data are automatically collected. Combining the application data reported by users (only need to modify endpoints, no code modification) and automatic pre-aggregation metrics, all are reported to the fully hosted server data center and then displayed through Grafana. Finally, panoramic monitoring data collection and analysis covering applications, containers, networks, and cloud components are realized.
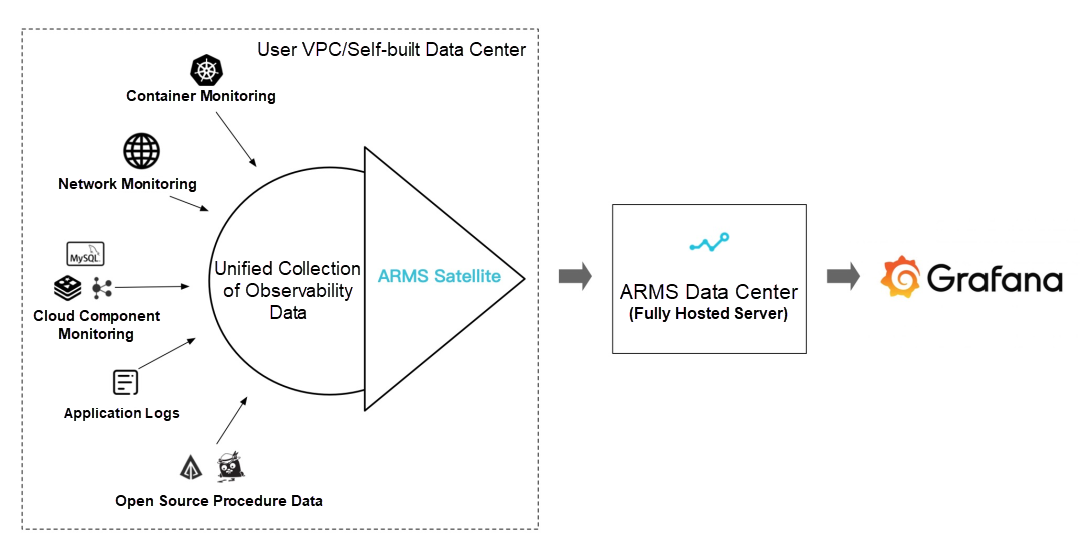
Under the multi-cloud/hybrid cloud architecture, there may be differences in the selection of tracing technologies between different clusters or applications. For example, A uses Jaeger and B uses Zipkin. The data formats reported by different tracing analysis protocols are incompatible with each other and cannot be connected in series, which reduces the efficiency of diagnosis in comprehensive traces.
ARMS Satellite can convert traces from different sources into the OpenTelemetry Trace format and report them to a unified server for processing and storage. Users can easily query and analyze federated data across networks or heterogeneous trace frameworks.
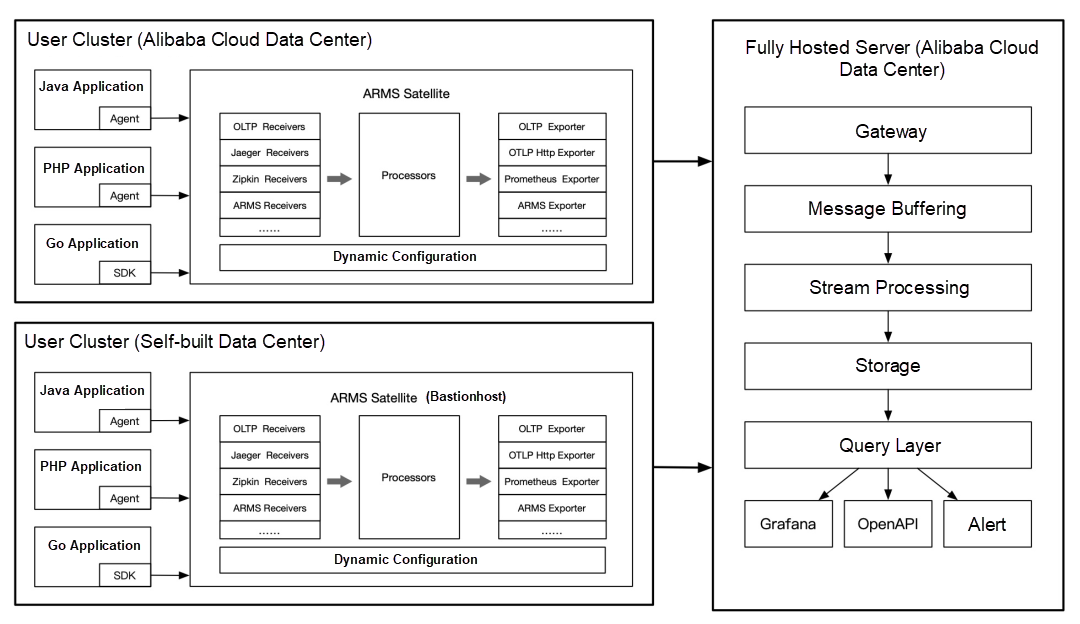
The average daily call volume of the production system can reach 100 million levels, and the cost of full reporting and storage of the traces is high, which is a good choice for sampling and storage of the traces. However, traditional trace sampling will lead to a significant decrease in the accuracy of link statistical indicators. For example, if one million real calls are retained after 10% sampling, the results obtained by the statistics will produce obvious sample skew, which will lead to a high false alarm rate of monitoring and alarm, which is unavailable.
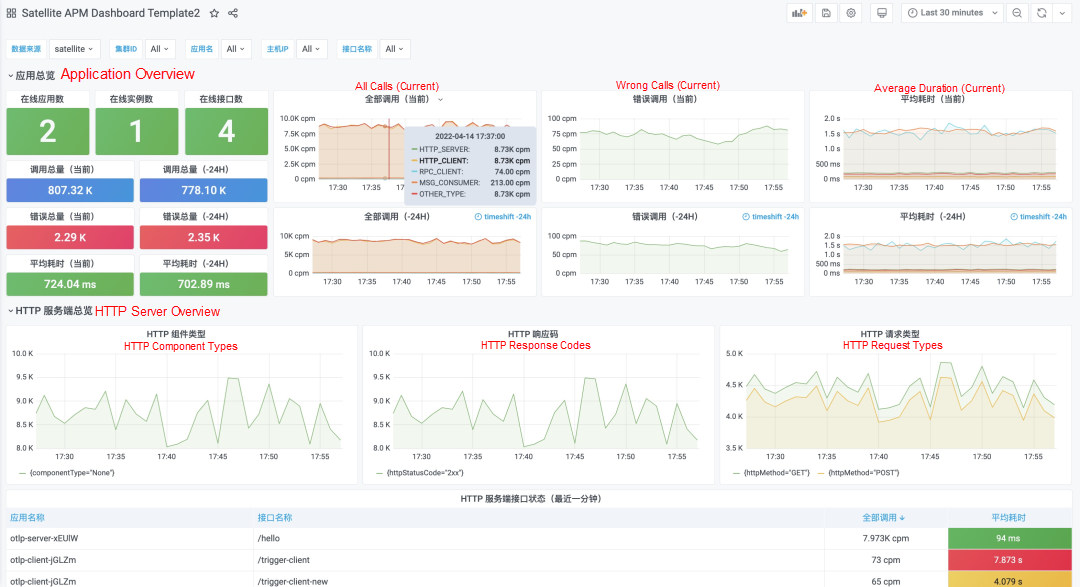
ARMS Satellite supports lossless statistics on trace data, automatically pre-aggregates the received trace data locally, and then performs trace sampling and reporting after accurate statistical results are obtained. This reduces network overheads and persistent storage costs while ensuring the accuracy of application monitoring and alert metrics. The following figure shows the Satellite APM Dashboard of the default integration.
OPLG system has a mature and dynamic open-source community ecology and has been tested by a large number of enterprise production environments. It is a popular choice for building a new generation of cloud-native unified observability platforms. However, OPLG only provides one technical system. Learning how to use it flexibly, solving practical problems, and precipitating the best practices of general industries or scenarios still needs to be explored together.
[1] OpenTelemetry
https://opentelemetry.io/
[2] Prometheus
https://prometheus.io/
[3] Grafana Loki
https://grafana.com/oss/loki/
[4] Grafana Labs
https://grafana.com/
[5] ARMS for OpenTelemetry Satellite
https://www.alibabacloud.com/help/en/application-real-time-monitoring-service/latest/application-monitoring-console-functions
[6] Alibaba Cloud Prometheus Service
https://www.alibabacloud.com/help/en/application-real-time-monitoring-service/latest/what-is-prometheus-service
[7] Alibaba Cloud Kubernetes Monitoring
https://www.alibabacloud.com/help/en/application-real-time-monitoring-service/latest/what-is-kubernetes-monitoring
[8] Alibaba Cloud Grafana Service
https://www.alibabacloud.com/help/en/application-real-time-monitoring-service/latest/what-is-grafana-service
How Does SchedulerX Help Users Solve Distributed Task Scheduling Problems?

673 posts | 56 followers
FollowAlibaba Cloud Community - October 9, 2022
Alibaba Cloud Native Community - July 22, 2022
Alibaba Cloud Native Community - December 6, 2022
Alibaba Cloud Community - January 4, 2026
Alibaba Cloud Native - October 27, 2021
Alibaba Developer - September 6, 2021

673 posts | 56 followers
Follow Managed Service for Prometheus
Multi-source metrics are aggregated to monitor the status of your business and services in real time.
Learn More Simple Log Service
An all-in-one service for log-type data
Learn More Bastionhost
A unified, efficient, and secure platform that provides cloud-based O&M, access control, and operation audit.
Learn More Managed Service for Grafana
Managed Service for Grafana displays a large amount of data in real time to provide an overview of business and O&M monitoring.
Learn MoreMore Posts by Alibaba Cloud Native Community