By Xijie & Baiyu
System observability and fault analysis are important measurement standards in system operation and maintenance. As the system evolves in architecture, resource units, resource acquisition methods, and communication methods, it has faced huge challenges. These challenges are pushing the development of operation and maintenance-related technologies. Before starting today's content, let's talk about the past and present of observability. Monitoring and observability have been developed for nearly 30 years.
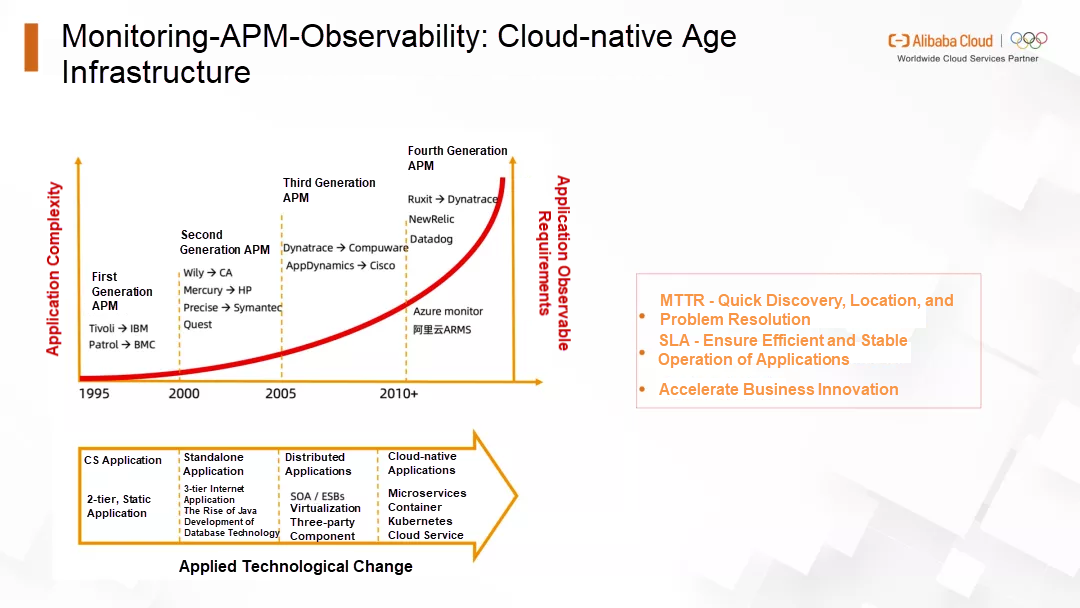
In the late 1990s, with the transfer of computing from mainframe to desktop computers, the application of client-server architecture began to prevail, and people began to pay attention to network performance and host resources. The first generation of APM software was created to help monitor the application of CS architecture. The O&M Team valued network performance and host performance during this period because the application architecture was still simple. We called these tools monitoring tools.
After 2000, the Internet developed rapidly, and the browser became a new user interface. The application evolved into a Browser-App-DB three-tier architecture based on the browser. At the same time, Java became popular as the first programming language of enterprise software. The concept of write once, run anywhere improved the productivity of the code. However, the Java virtual machine blocked the details of code operation, making it more difficult to optimize and troubleshoot. Therefore, code-level tracking diagnosis and database optimization have become new concerns, giving birth to Application Performance Monitoring (APM), a new generation of monitoring tools.
After 2005, distributed applications have become the first choice for many enterprises, and applications based on SOA architecture and ESB have become popular. At the same time, virtualization technology is becoming popular, and the traditional server has faded into an invisible and untouchable virtual resource model. Three-party components (such as Message Queue and cache) have also begun to be applied in production environments. In such a technological environment, a new generation of APM software has been born. Enterprises began to need to carry out comprehensive tracing analysis and monitor virtual resources and three-party components, giving rise to the core capabilities of a new generation of APM.
After 2010, as the cloud-native architecture began to be implemented, the application architecture began to change from a single system to a microservice, and the business logic became calls and requests between microservices. Virtualization has become more thorough, container management platforms have been accepted by more enterprises, and three-party components have evolved into cloud services. The entire application architecture has become a cloud-native architecture. The call path of services became longer, which made the direction of traffic uncontrollable and made troubleshooting difficult. Therefore, new observability is needed. Continuous analysis is carried out in the whole application life process of development, testing, and operation and maintenance by covering various observability data (indicators, logs, procedures, and events) of the whole stack.
It can be seen that observability became the infrastructure of cloud-native. The entire observability has evolved from a simple O&M state to a test development state. The purpose of observability extends from supporting the normal operation of the business to accelerating business innovation and allowing the business to iterate quickly.
The preceding explanation shows that the process from monitoring to APM to observability is evolving. Now, let's talk about their relationships. A classic cognitive model is introduced here. For all things in the world, we usually divide them according to the two dimensions of awareness and understanding.
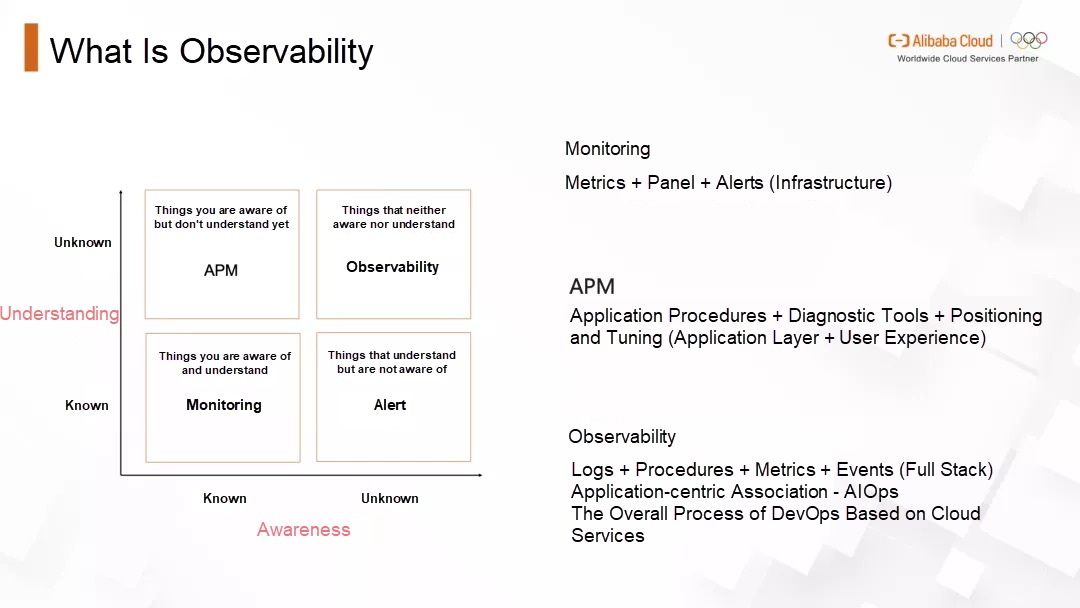
The things we are aware of and understand, we call fact. In the topic just discussed, this part corresponds to monitoring. For example, when carrying out operation and maintenance work, it is designed to monitor the CPU utilization rate of the server at the beginning. This utilization rate is an objective fact whether it is 80% or 90%. This is what monitoring solves, which means based on knowing what to monitor, formulating and collecting corresponding indicators, and establishing a dashboard.
The next thing is what we are aware of but don't understand. For example, it is monitored that the CPU utilization rate reaches 90%, but why it is so high and what causes it, this is a verification process. APM can be used to collect and analyze the application performance on the host and discover a log framework with high latency during application procedure calls. This causes the CPU utilization on the host to soar. This is the reason behind the high CPU utilization through application layer analysis with APM.
The next thing is what we understand but are unaware of. Still take the case of high CPU utilization as an example. If you predict that CPU utilization will soar at some point in the future by learning historical data and associated events, you can take precautions.
Finally, there are things we are unaware of and don't understand. Take the same example. The CPU utilization soars after monitoring, and the application log framework is discovered to be the reason through APM. However, if the user's access data during this period is analyzed, it is found that the response time of requests accessed through Apple terminals in Shanghai is ten times higher than in other cases. However, due to the configuration of the log framework, a large number of Info logs are generated for this type of request, which causes the CPU of some machines to soar. This is an observability process. Observability aims to solve things that you are not aware of in advance (the access performance problem of Apple terminals from Shanghai) or understand (massive info logs are generated by misconfiguring the log framework).
To sum up, in the field of monitoring, we pay attention to indicators, which may focus on the infrastructure layer, such as the performance indicators of machines and networks. Then, the corresponding Kanban and alert rules are established based on these indicators to monitor the events in the known range. After the monitoring finds the problem, APM uses diagnostic tools (such as procedures) based on the application level and memory and threads to locate the root cause of the monitoring indicator exception.
Observability is application-centric. The root cause can be found quickly and directly by correlating and analyzing various observability data sources, such as logs, procedures, metrics, and events. It also provides an observability interface, allowing users to explore and analyze these observability data flexibly and freely. At the same time, observability is connected with cloud services, and the elastic expansion and high availability of applications are strengthened. When problems are found, related problems can be solved quickly, and application services can be restored.
While bringing great business value, observability also brings considerable system construction challenges. This is not only the selection of tools or technologies but an O&M concept. This includes the collection, analysis, and value output of observability data.
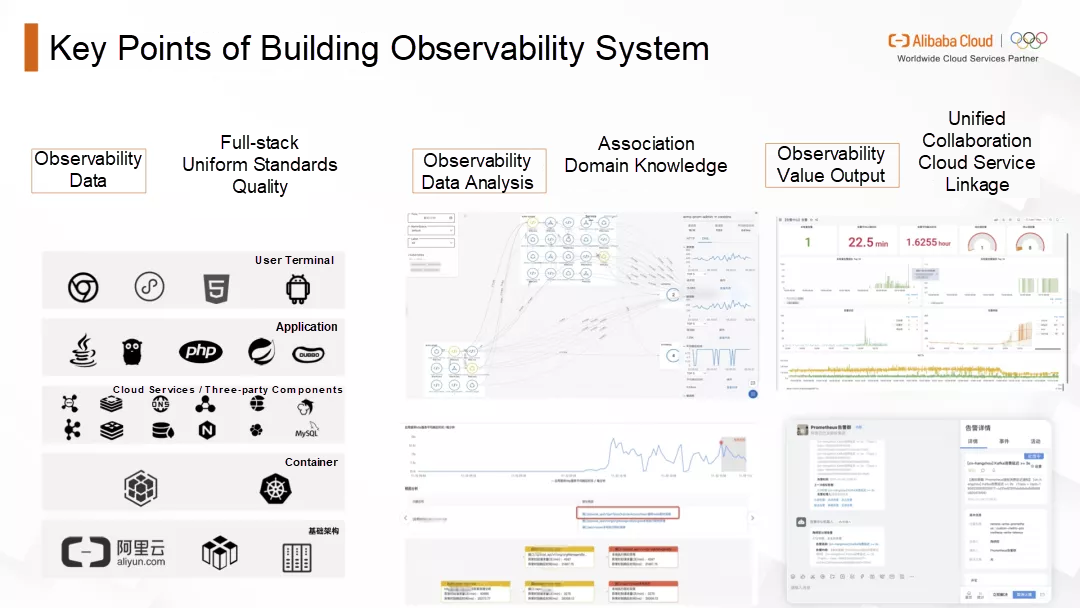
Currently, the observability data implemented in the industry includes three pillars: Logging, Tracing, and Metrics. Some of these common features need attention.
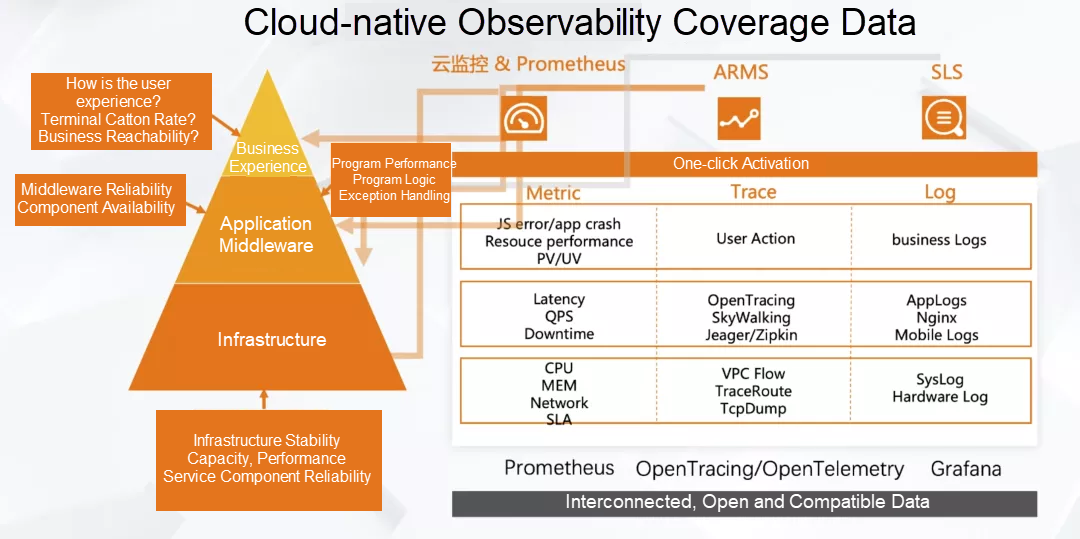
The basic layer, the container layer, the upper cloud application, and the corresponding observability data of the user terminal and the corresponding indicators, procedures, and events need to be collected.
The whole industry is promoting the unification of standards. The first one is metrics. Prometheus has formed a consensus as an indicator data standard in the cloud-native era. The standard of procedure data has become the mainstream with the implementation of OpenTracing and OpenTelemetry. In the field of logs, although its data is less structured and it is difficult to form a data standard, open-source rookies (such as Fluentd and Loki) have emerged in the collection, storage, and analysis. On the other hand, Grafana is becoming clear as a display standard for various observability data.
Data quality is an important part that is easy to be overlooked. On the one hand, data sources of different monitoring systems need to define data standards to ensure the accuracy of the analysis. On the other hand, the same event may cause a large number of duplicate metrics, alerts, and logs. Data with analytical value is analyzed through filtering, noise reduction, and aggregation to ensure data quality. This is why the gap between open-source tools and commercial tools is relatively large. For example, when we collect the traces of an application, what is the maximum number of traces? What is the strategy? Can all be collected when there are mistakes or slowness? Can the sampling strategy be dynamically adjusted based on certain rules? All of these determine the quality of observability data collection.
In the current observability system, the application is a good analysis angle. First of all, applications are related to each other and can be related through traces. These include how microservices are called, how applications and cloud services are called, and how three-party components are called, all of which can be associated through procedures. The application can be vertically mapped to the container layer and the resource layer. Based on applications, global observability data associations are formed by horizontal and vertical correlation. When problems need to be located, unified analysis can be carried out from the perspective of the application.
In the face of massive data, we should know how to find problems quickly and locate them accurately. In addition to using application-centric data associations, you need domain knowledge to locate and analyze problems. The most important thing for observability tools or products is to accumulate the best troubleshooting path, common problem positioning, and root cause decision procedure methods and solidify the relevant experience. This is equivalent to equipping the O&M team with experienced O&M engineers to find problems and locate the root causes quickly. This is different from the traditional AIOps capability.
As mentioned before, observability needs to cover all levels, and each level has corresponding observability data. However, observability-related tools are scattered currently, and how to display the data generated by these tools in a unified way has become a major challenge. The unification of observability data is difficult, including format, coding rules, dictionary values, and other issues. However, unified presentation of data results can be achieved. Currently, the mainstream solution is to use Grafana to build a unified dashboard.
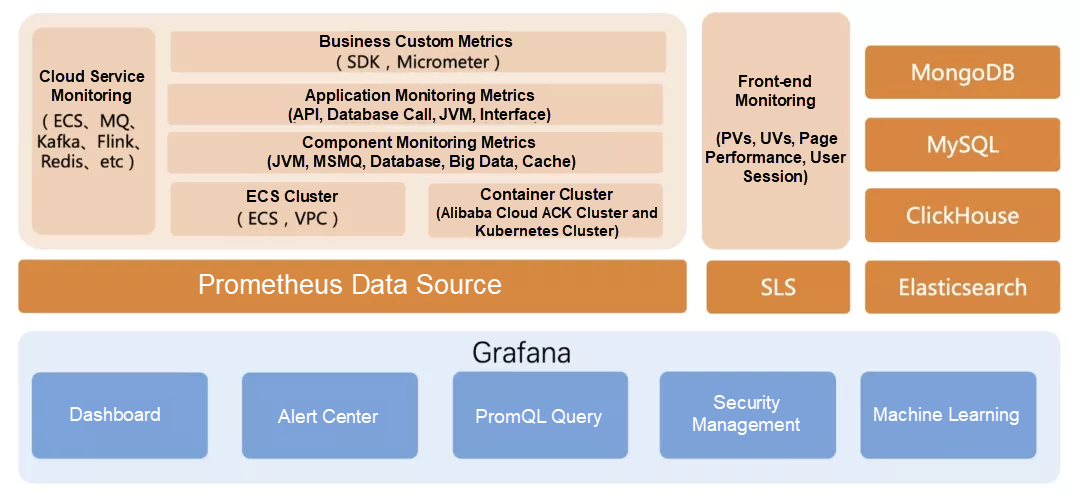
After the unified display and alarm, how to use collaboration platforms (such as DingTalk and WeCom) to find and track problems more efficiently has become an urgent demand.
The observability becomes the foundation of the cloud-native. After the observability platform discovers and locates problems, it needs to quickly integrate with various cloud services and scale or implement SLB to solve the problems faster.
Thanks to the vigorous development of the cloud-native open-source ecosystem, we can easily build a monitoring system. For example, we can use Prometheus + Grafana to build basic monitoring, SkyWalking or Jaeger to build a tracking system, and ELK or Loki to build a log system. However, for the O&M team, different types of observability data are scattered and stored in different backends. It still needs to jump between multiple systems for troubleshooting, and efficiency cannot be guaranteed. Based on these, Alibaba Cloud provides enterprises with Application Real-time Monitoring Service (ARMS), an all-in-one observability platform. As a product family, ARMS includes various products in different observability scenarios.
ARMS has many capabilities as an all-in-one product. The enterprise has created some capabilities similar to ARMS or adopted some products in ARMS, such as application monitoring and browser monitoring. However, a complete observability system is crucial for enterprises, and they hope to build an observability system that meets their business needs based on open-source. In the following example, we focus on how Prometheus + Grafana builds an observability system.
In ARMS, we can establish a Grafana exclusive instance quickly. ARMS Prometheus, SLS Log Service, and CMS CloudMonitor data sources can easily synchronize data. Open Configuration to view the corresponding data source quickly. Reduce the workload of daily data source management as much as possible while quickly accessing various data sources.
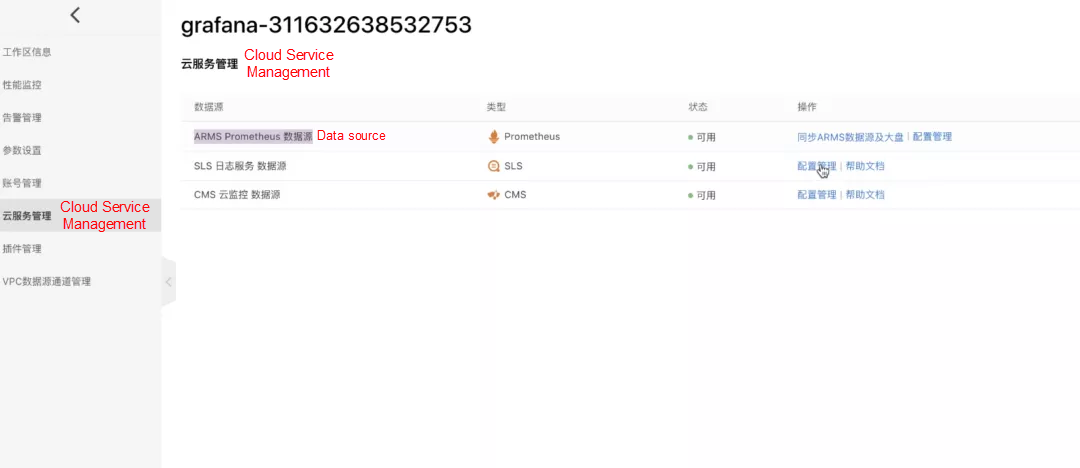
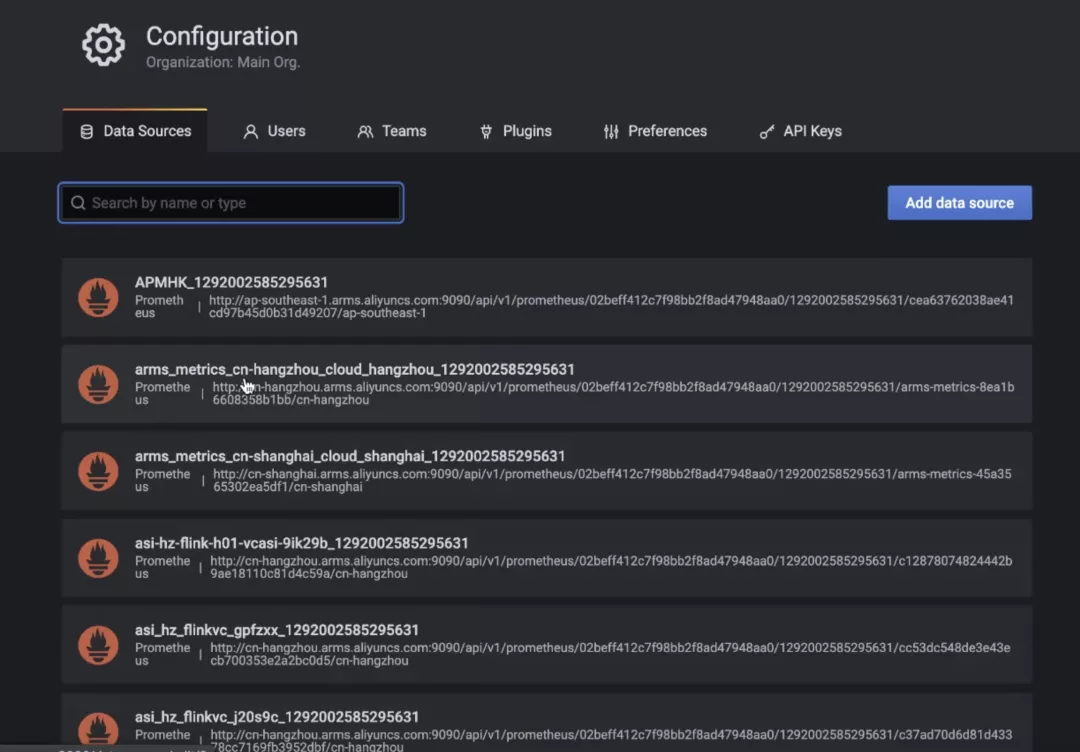
After the data is connected, Grafana creates the corresponding data dashboard automatically. Let's take application monitoring and container dashboards as examples. Basic data are provided by default, such as the three metrics and port changes.
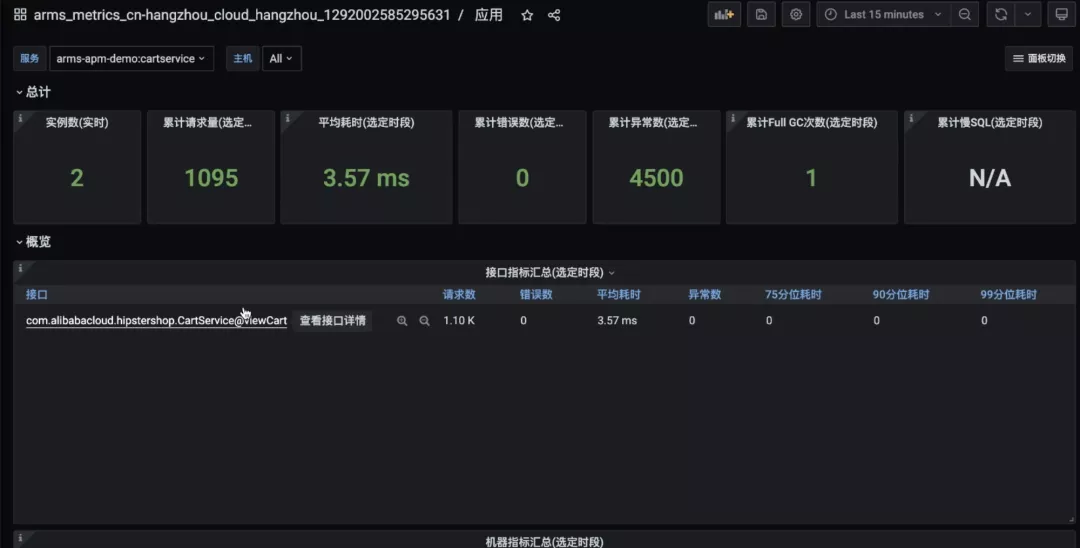
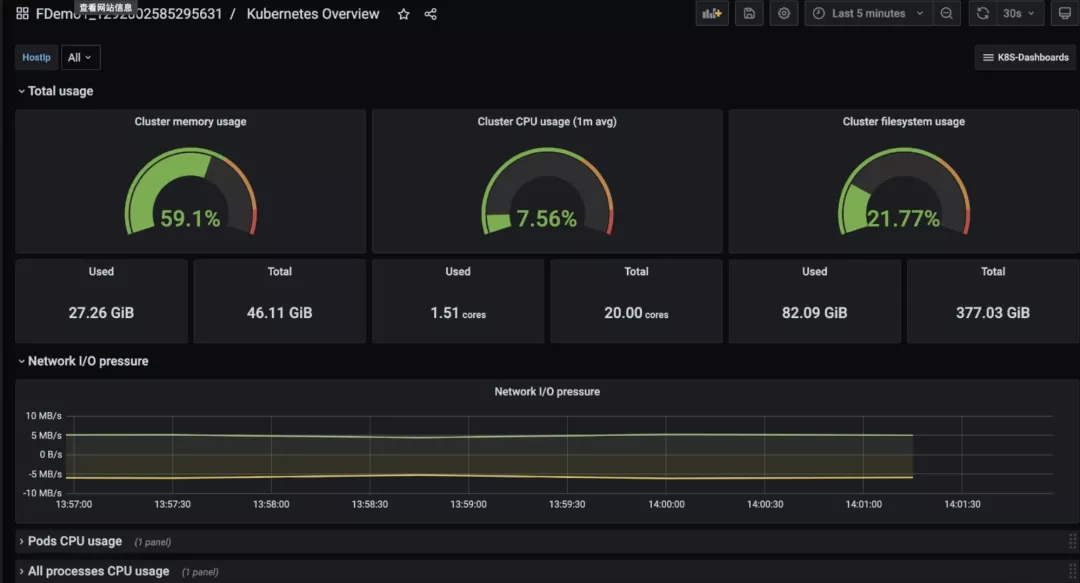
Grafana helps you build up all kinds of dashboards, but what you see is still scattered. In the daily operation and maintenance, it is necessary to create a unified dashboard based on the business domain or application, which can put the data of the infrastructure layer, container layer, application layer, and user terminal layer into the same large dashboard for display, thus realizing overall monitoring.
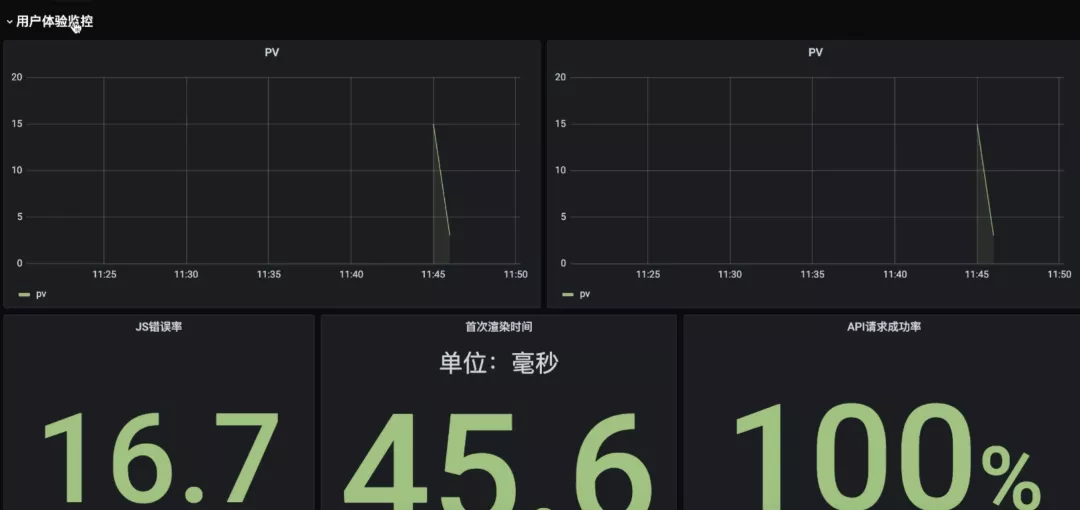
When establishing a full-stack unified dashboard, we prepare for it based on the dimensions of user experience, application performance, container layer, cloud services, and underlying resources.
Key data are presented for the first time, such as the data of PVs and UVs, JS error rate, first paint time, API request success rate, and TopN page performance.
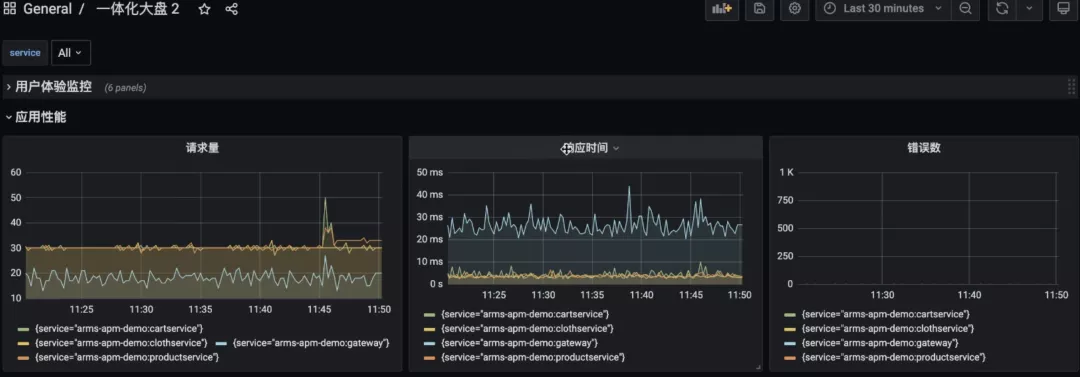
There are three metrics: request volume, error rate, and response time. It is distinguished according to different applications and services.
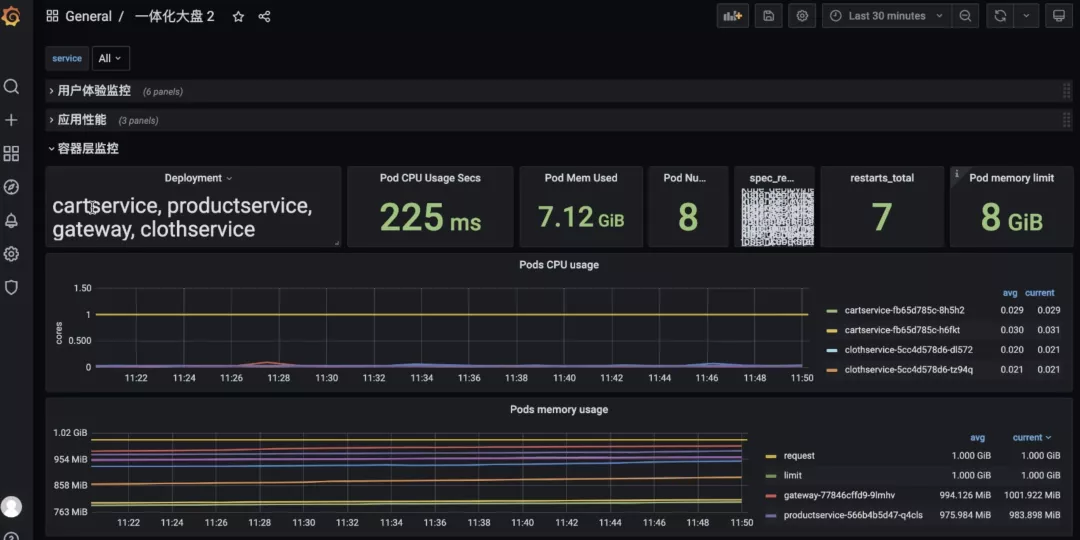
The performance and usage of each pod list which departments are created on these applications. Pod performance information related to these deployments is presented in this section.
Here we take Kafka as an example, such as Message Service, common related data indicators of accumulated messages, consumed messages, and other data.
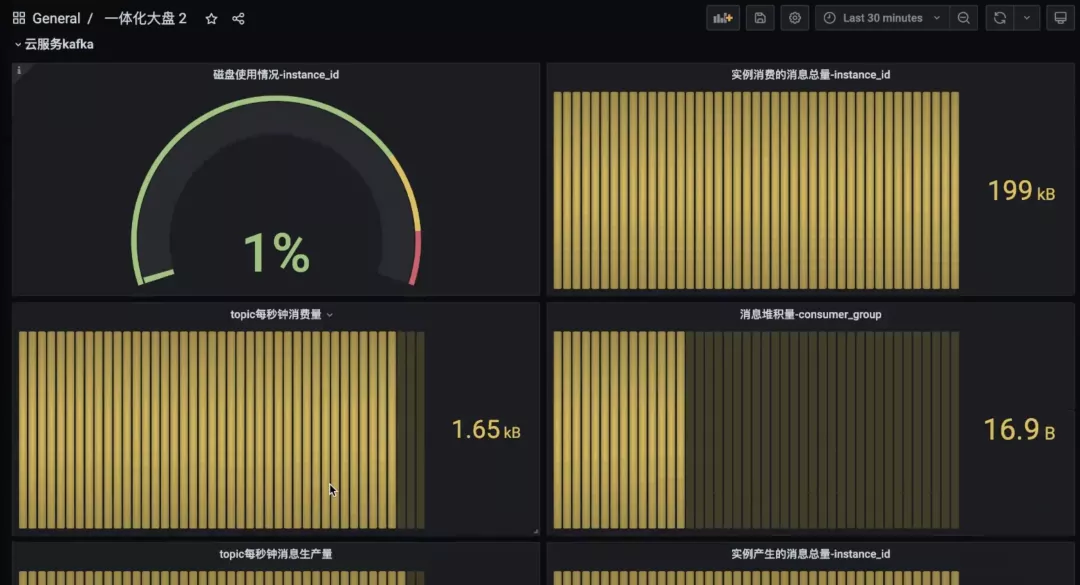
For data such as the host node, CPU, and running Pods:
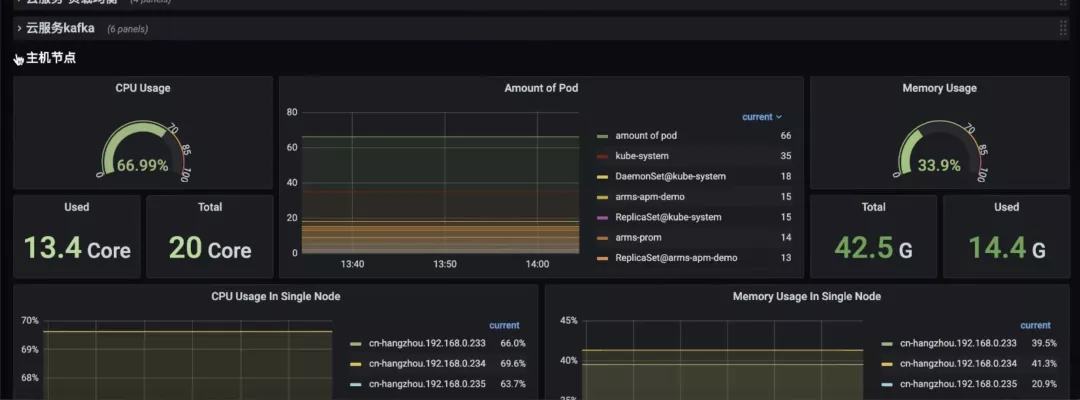
As such, this dashboard covers the overall performance monitoring from the user experience layer to the application layer to the infrastructure container layer. More importantly, the entire dashboard contains data related to all microservices. When using a service, the performance data associated with the service will be displayed independently. Filter at different levels, such as containers, applications, and cloud services. How is it done? When Prometheus collects these cloud services, it will collect all the tags on the cloud services. You can distinguish these cloud services based on different business dimensions or applications by tagging. When we unify the dashboard, we will encounter many data source management problems. Here, we provide a GlobalView feature to gather all Prometheus instances under this username together for a unified query, whether it is information at the application layer or cloud service.
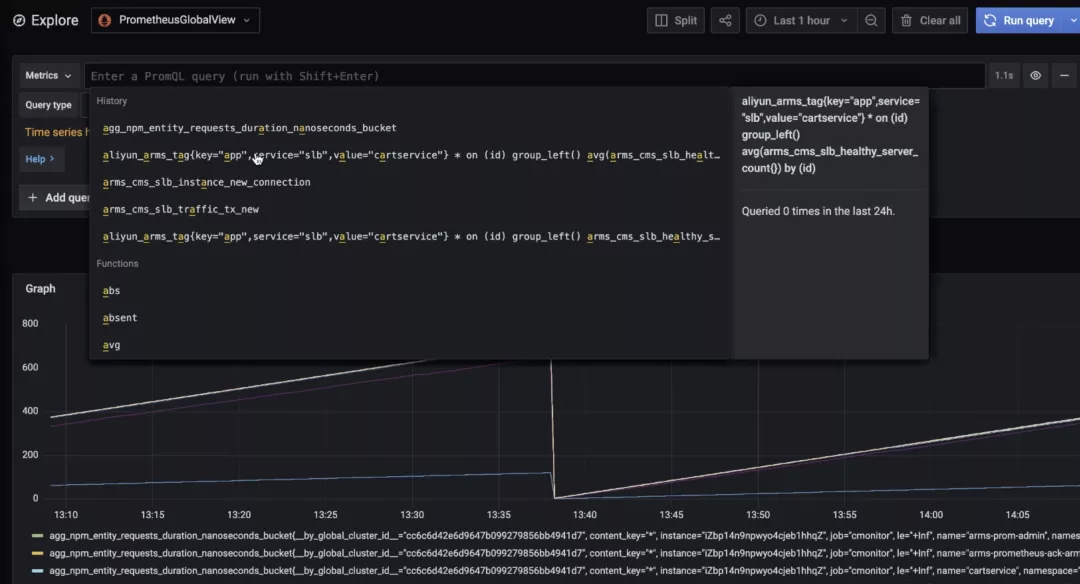
With the help of the preceding scenarios, we put forward the design direction of the observability platform: fusion and analysis of different data at the backend based on the perspective of system and service observation, instead of deliberately emphasizing that the system supports separate queries of the three types of observability data, and shielding users from Metrics, Tracing, and Logging as much as possible in terms of product functions and interaction logic. Establish a complete observability closed loop, from abnormal discovery before an accident and troubleshooting during an accident to active early warning monitoring after an accident, providing an integrated platform for continuous business monitoring and optimizing service performance.
A Discussion on the Cost Reduction and Efficiency Improvement of Enterprises
OPLG: Best Observability Practices of New Generation Cloud-Native

674 posts | 56 followers
FollowAlibaba Cloud Native Community - September 4, 2025
Alibaba Cloud Native Community - January 19, 2026
Alibaba Cloud Native - October 27, 2021
Alibaba Container Service - November 15, 2024
Alibaba Cloud Native Community - August 25, 2025
Alibaba Cloud Native Community - January 19, 2026

674 posts | 56 followers
Follow Managed Service for Prometheus
Multi-source metrics are aggregated to monitor the status of your business and services in real time.
Learn More Managed Service for Grafana
Managed Service for Grafana displays a large amount of data in real time to provide an overview of business and O&M monitoring.
Learn More Application Real-Time Monitoring Service
Build business monitoring capabilities with real time response based on frontend monitoring, application monitoring, and custom business monitoring capabilities
Learn More Cloud-Native Applications Management Solution
Accelerate and secure the development, deployment, and management of containerized applications cost-effectively.
Learn MoreMore Posts by Alibaba Cloud Native Community