The concept of observability first appeared in the electrical engineering field in the 1970s. A system is said to be observable if, for any possible evolution of state and control vectors, the current system state can be estimated using the information from its outputs.

Compared with traditional alarms and monitoring, observability can help us understand a complex system in a more "white box" manner, giving us an overview of the system operation to locate and solve problems quickly. Consider the example of an engine. The alarm only tells whether there is a problem with the engine and certain associating dashboards containing speed, temperature, and pressure. However, it doesn't help us accurately determine which engine part contains the problem. We need to observe each component's sensor data to locate the problem accurately.
The age of electricity originated from the Second Industrial Revolution in the 1870s. The main signs are the broad application of electricity and internal combustion engines. But why was the concept of observability proposed after nearly 100 years? Was there no need to rely on the output of various sensors to locate and troubleshoot faults and problems before? Obviously not. The need to troubleshoot has always been there. But as modern systems are becoming more complicated, we need a more systematic way to support troubleshooting. This is why observability was proposed. Its core points include:
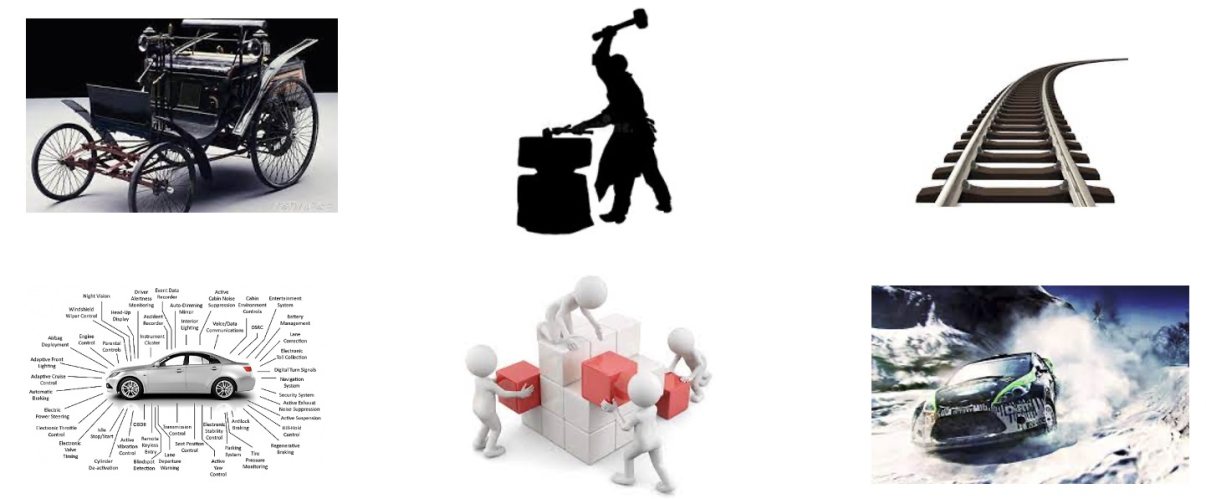
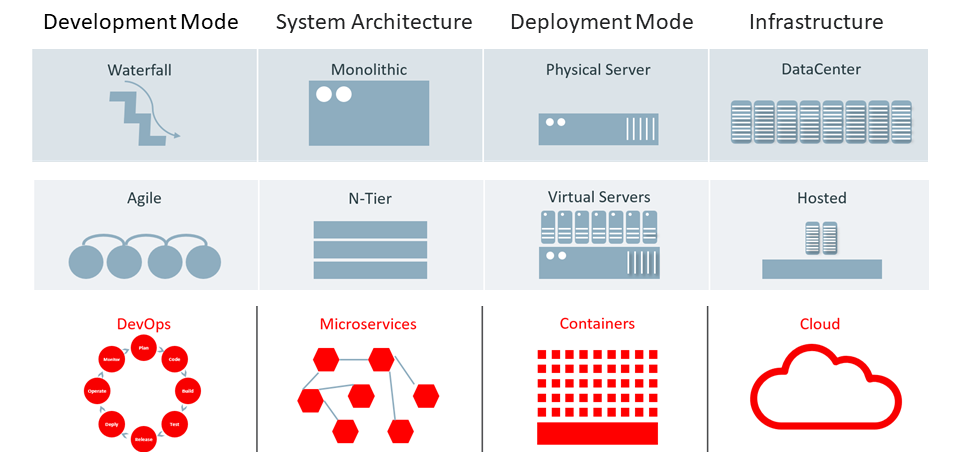
After decades of rapid development, the IT system's development model, system architecture, deployment model, and infrastructure have undergone several rounds of optimization. The optimization has brought higher efficiency for system development and deployment. However, the entire system has also become more complex: the development requires more people and departments today, and the deployment model and operating environment are more dynamic and uncertain. Therefore, the IT industry has reached a stage that requires more systematic observation.
Implementing the IT system's observability is similar to that of electrical engineering. The core is to observe the output of systems and applications and judge the overall working status through data. Generally, we classify these outputs into traces, metrics, and logs. We will discuss the characteristics, application scenarios, and relationships of these three data types in detail in the upcoming sections.

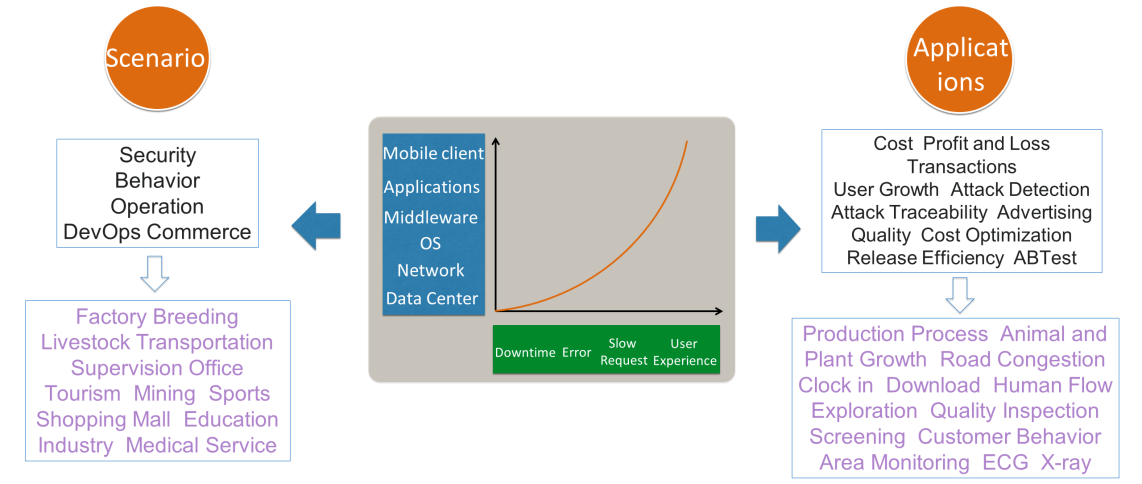
The observability technology of IT systems has been developing rapidly. From a broad perspective, observability-related technologies can be applied not only in IT operation and maintenance (O&M) scenarios but also in general and special scenarios related to the company.
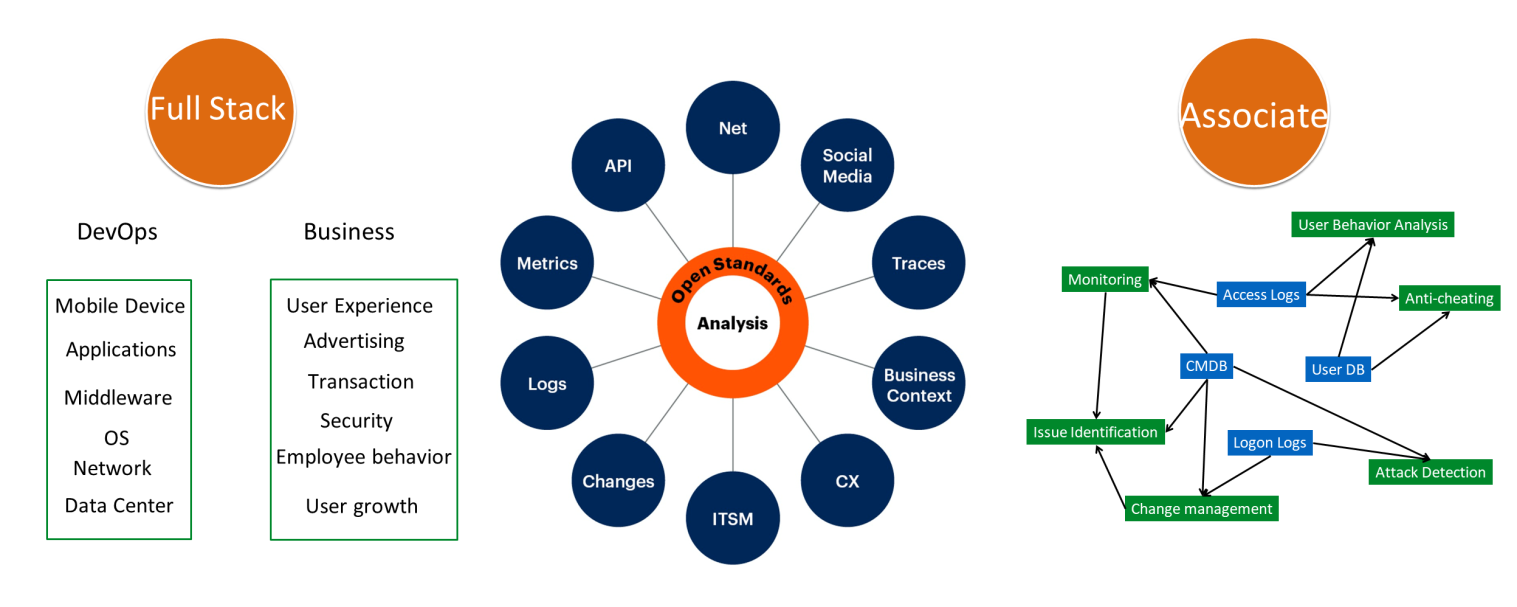
In terms of implementing the observability scheme, we may not be able to build an observable engine that applies to every industry at this stage. Still, we can focus more on DevOps and general corporate business. The two core tasks include:

We can divide the whole process of the observability work into four parts:
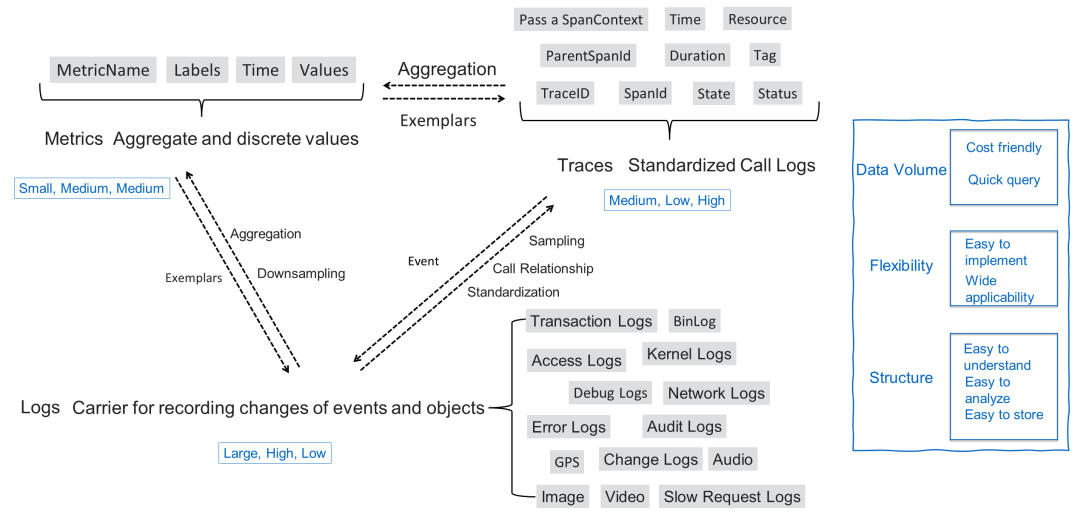
Logs, traces, and metrics can meet various requirements such as monitoring, alerting, analysis, and troubleshooting of the IT system. However, in actual scenarios, we often confuse the applicable scenarios of these three data types. Outlined below are the characteristics, transformation methods, and applicable areas of observability telemetry data:
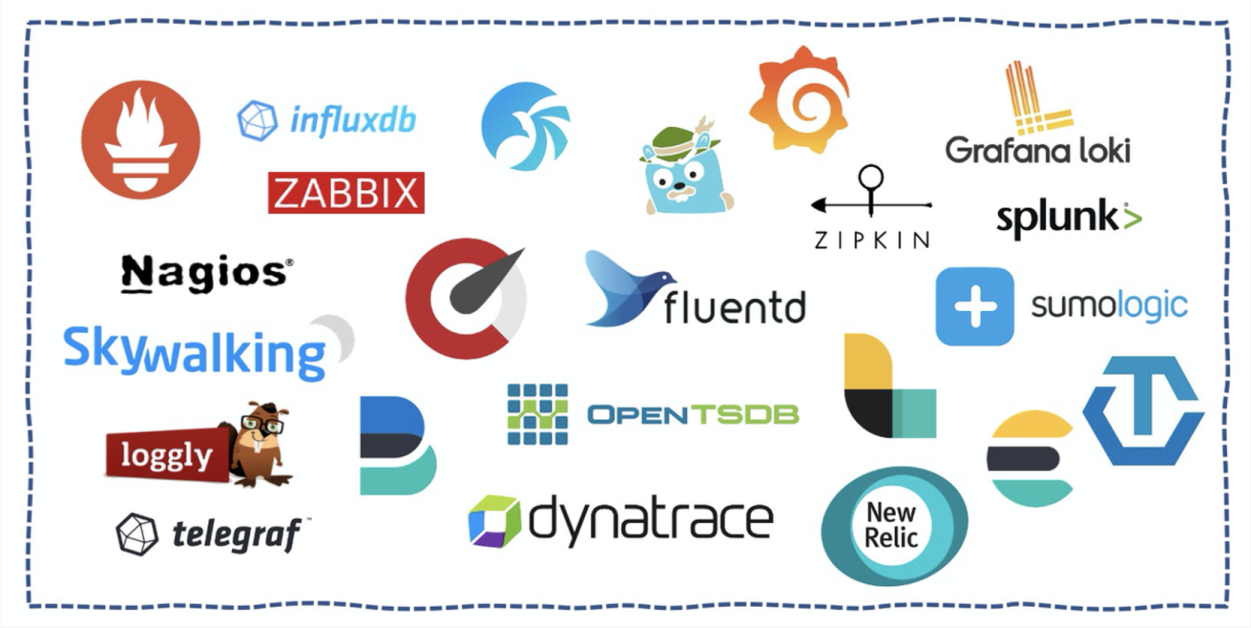
Various observability-related products are available to monitor complex systems and software environments, including many open source and commercial projects. Some of the examples include:
Combining these solutions can help us solve one or several specific types of problems. However, when using such solutions, we also encounter various problems:
In a scenario where multiple solutions are adopted, troubleshooting needs to deal with various systems. If these systems belong to different teams, we need to cooperate with these teams to solve the problem. Therefore, it is better to utilize a solution that collects, stores and analyzes all types of observability data.

Based on the above discussion, let's return to the essence of observability. Our observability engine meets the following requirements:
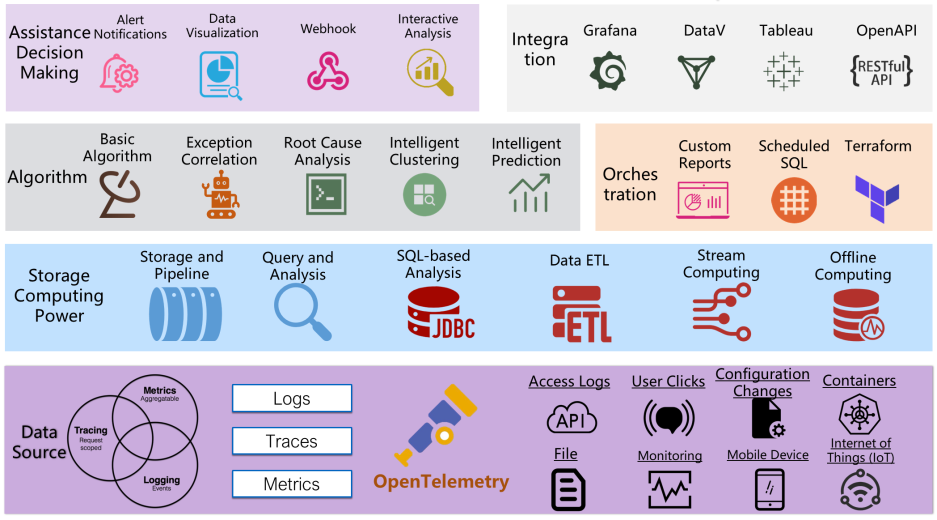
The overall architecture of the observability data engine is shown in the following figure. The four layers from the bottom to the top basically conform to the guiding ideology of the scenario landing: sensor + data + computing power + algorithm:
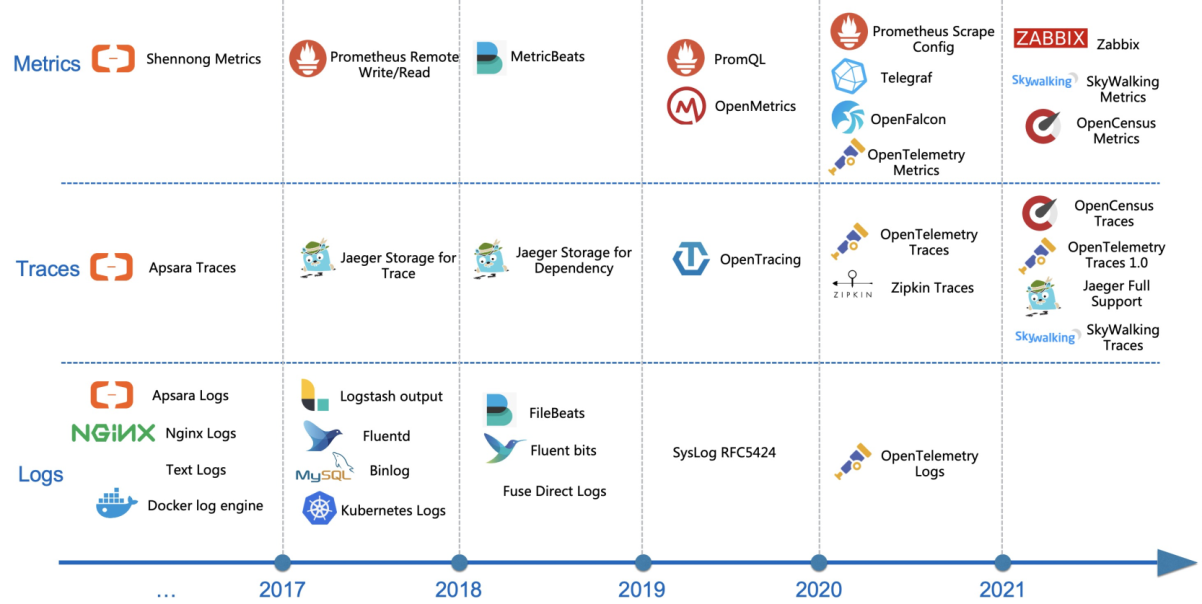
After Alibaba's full adoption of cloud-native technologies, we began to solve compatibility issues with open source and cloud-native protocols and solutions in the observable field. Compared with the closed mode of protocols, being compatible with open source and standard protocols allows you to capture data from various data sources seamlessly. Our platform can effectively optimize this, reducing "reinventing the wheel" work. The preceding figure shows the overall progress of our compatibility with external protocols and agents:
For storage engines, our primary design goal is unification. We are focusing on using a set of engines to store various types of observable data. Our second pursuit is speed. Writing and querying speed can be applied to ultra-large-scale scenarios inside and outside Alibaba Cloud (tens of petabytes of data written per day).

In the case of observability telemetry data, the formats and query features of logs and traces are similar; therefore, we will explain them together:
Logs/Traces
Metrics
At the same time, observability data also has some common features, such as high throughput (high traffic, QPS, and burst), ultra-large-scale query capabilities, and time access features (hot and cold features, access locality, etc.).

We designed a unified observable data storage engine for the above feature analysis. Its overall architecture is as follows:

If the storage engine is compared to fresh food materials, then the analysis engine is the knife for processing these food materials. Based on this analogy, for different food items, we need different types of knives to achieve the best results, such as cutting knives for vegetables, bone-cutting knives for ribs, and peeling knives for fruits. Similarly, there are corresponding analysis methods for different types of observable data and scenarios:
The above analysis methods have corresponding applicable scenarios. Using a particular syntax/language to implement all functions is difficult while ensuring good convenience. Although the capabilities similar to PromQL and keyword query can be realized by extending SQL, a simple PromQL operator may need a large string of SQL statements to implement. Therefore, our analysis engine chooses to be compatible with keyword query and PromQL syntax. At the same time, to facilitate the association of various types of observable data, we have realized the capability to connect keyword queries, PromQL, external DB, and ML models based on SQL. It makes SQL a top-level analysis language, realizing the fusion capability for observable data.
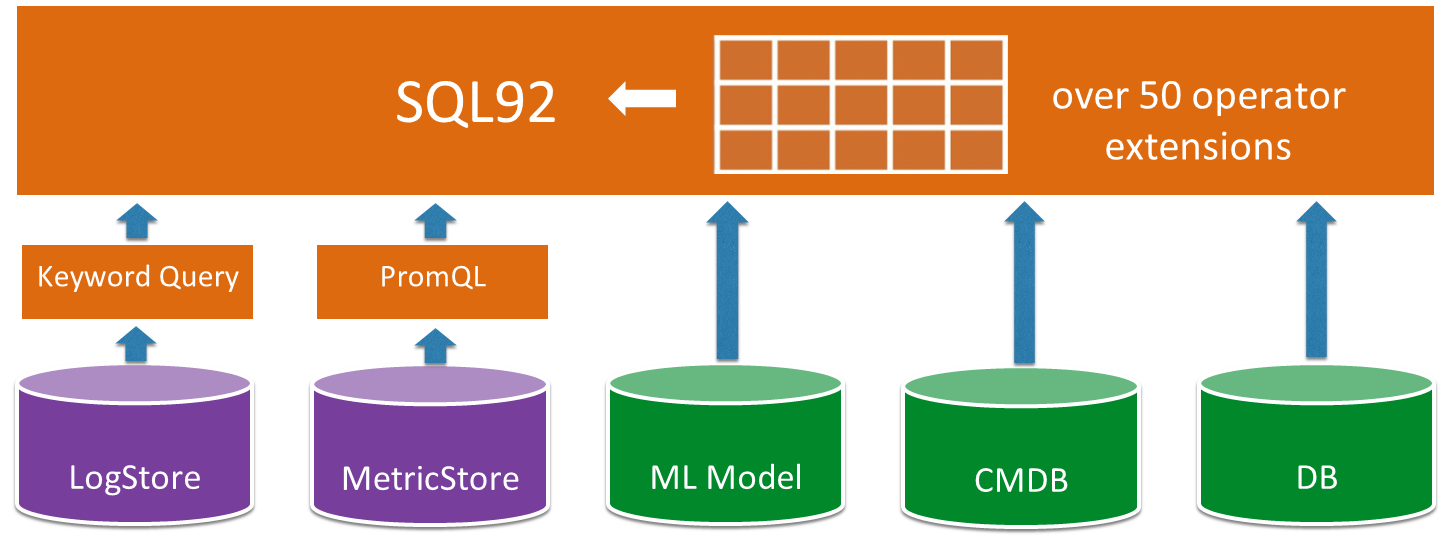
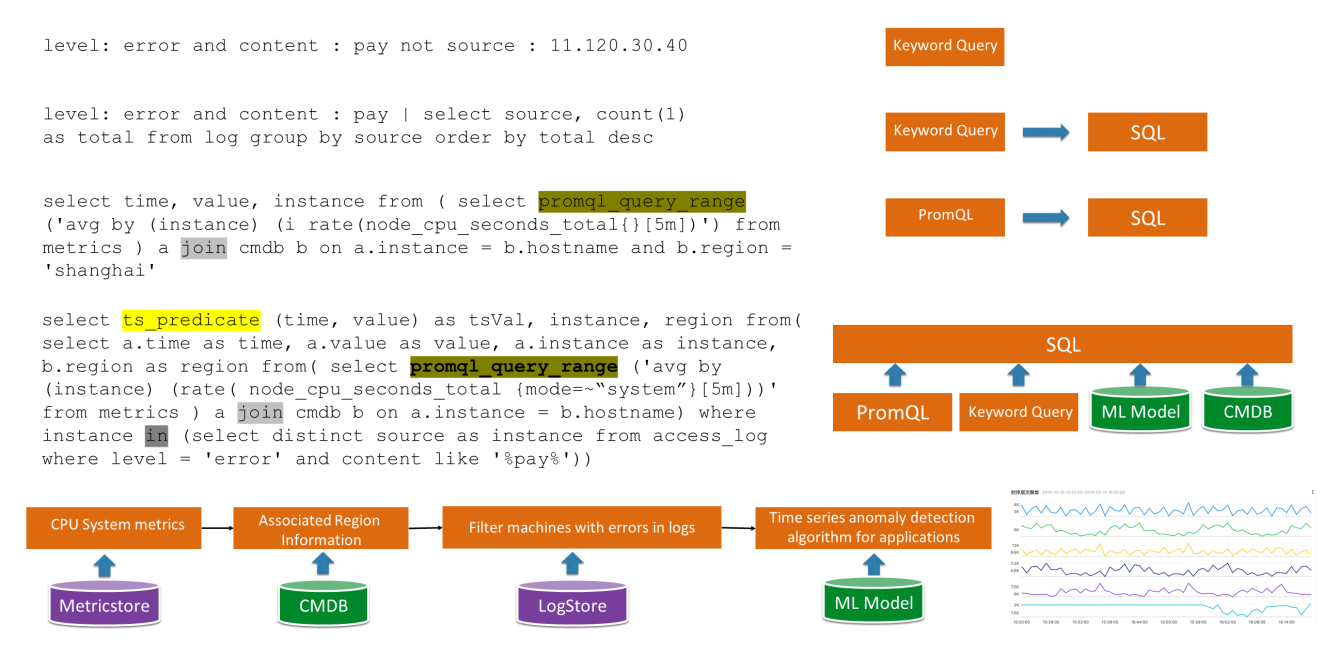
Here are a few application examples of our query/analysis. The first three examples are simple and can be used with pure keyword query, PromQL, or together with SQL. The last one shows an example of fusion analysis in actual scenarios:
First, query the CPU metrics of the machines
In the preceding example, LogStore and MetricStore are queried at the same time, and the CMDB and ML models are associated. One statement achieves a complex analysis effect, which is common in actual scenarios, especially for analyzing complex applications and exceptions.
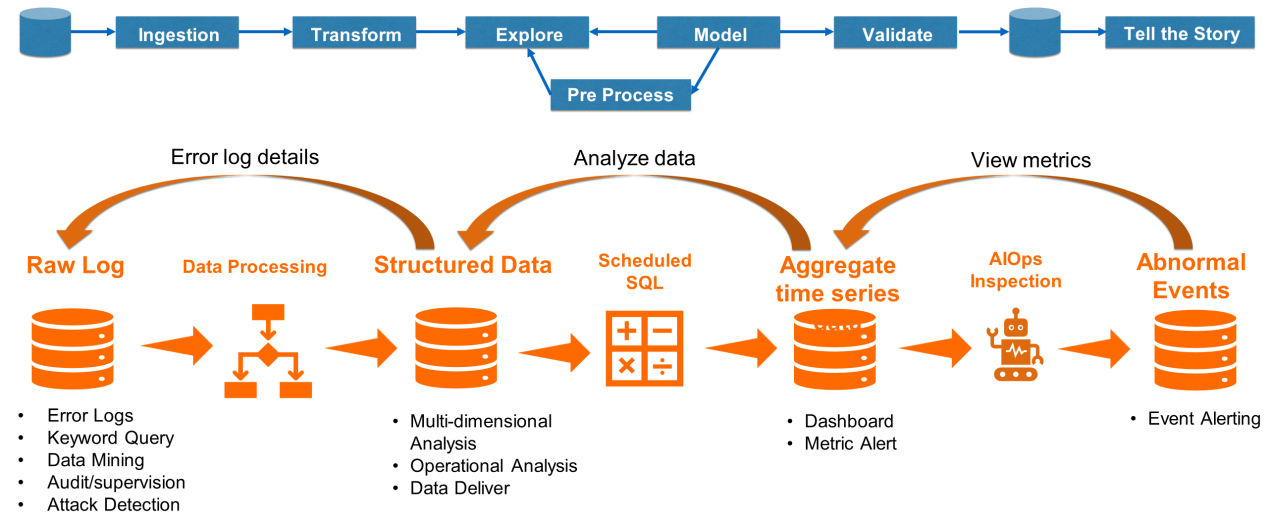
Compared with traditional monitoring, the advantage of observability lies in its stronger capability of data value discovery. Observability allows us to infer the operating state of a system according to output. Therefore, it is similar to data mining, where we collect all complex data types. After formatting, preprocessing, analyzing, and testing the collected data, it "tells stories" based on the conclusions reached. Therefore, when constructing the observability engine, we focus on the capability of data orchestration. This capability can make the data "flow" continuously, providing high-value data from the raw logs. In the end, observability tells us about a system's operational state and helps find answers to questions like "why the system or application is not working." To enable data to "flow," we have developed several functions:
Our data engine currently has over 100,000 internal and external users. It also processes over 40PB of data daily. Many companies are building their own observable platforms based on our data engine to carry out full-stack observability and business innovation. Outlined below are some common scenarios that our engine supports:
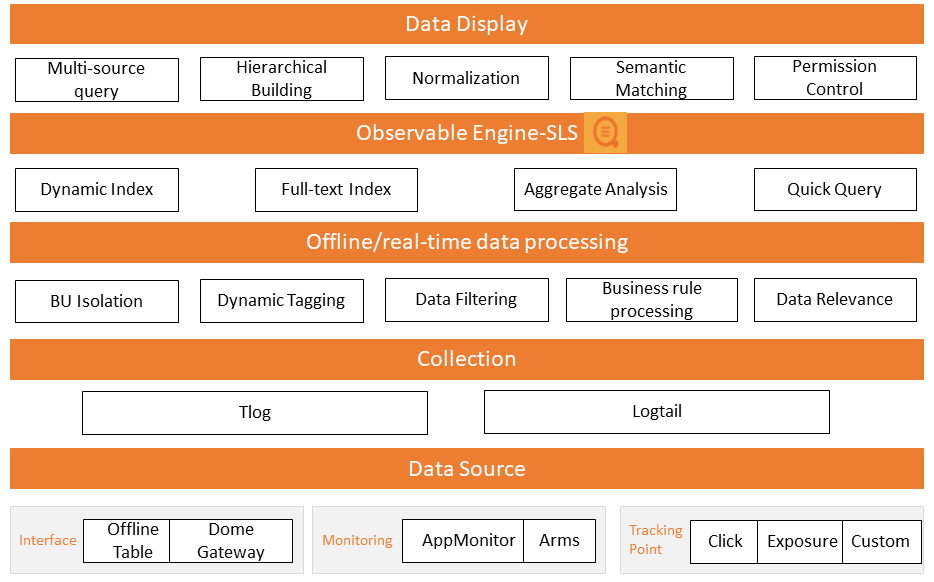
Observability in the comprehensive procedure has always been an important step in DevOps. In addition to the usual monitoring, alarm, and problem troubleshooting, it also undertakes functions, such as user behavior playback/analysis, version release verification, and A/B Test. The following figure shows the comprehensive-procedure observable architecture of one of the products of Alibaba Cloud.
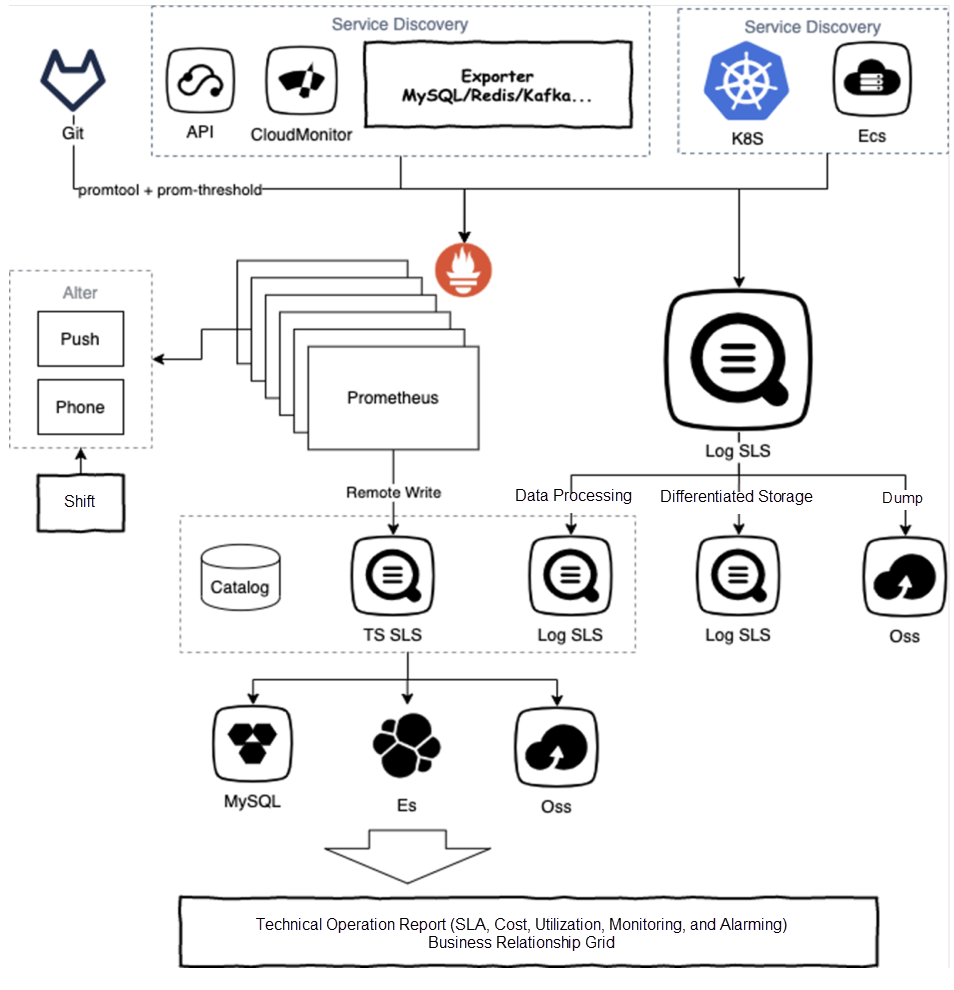
The priority of a commercial company is always revenue and profitability. We all know that profitability is revenue minus cost, and the cost in the IT sector is usually huge, especially for Internet companies. Now, after Alibaba Cloud's full cloudification, Alibaba Cloud's internal teams should also closely observe the IT cost and work hard to reduce costs as much as possible. The following example shows the monitoring system architecture of a customer of Alibaba Cloud. In addition to monitoring the IT infrastructure and business, the system is also responsible for analyzing and optimizing the IT costs of the entire company. The main data gathered include:
Using Catalog and product billing information, we can calculate the IT cost of each department. Similarly, based on each instance's usage and utilization information, we can calculate the IT resource utilization of each department, such as the CPU and memory usage of each ECS. Finally, we can also determine the reasonable degree of the use of IT resources by each department/team as a whole. Based on this information, we can create operation reports to promote the optimization of departments/teams with low reasonable degrees.
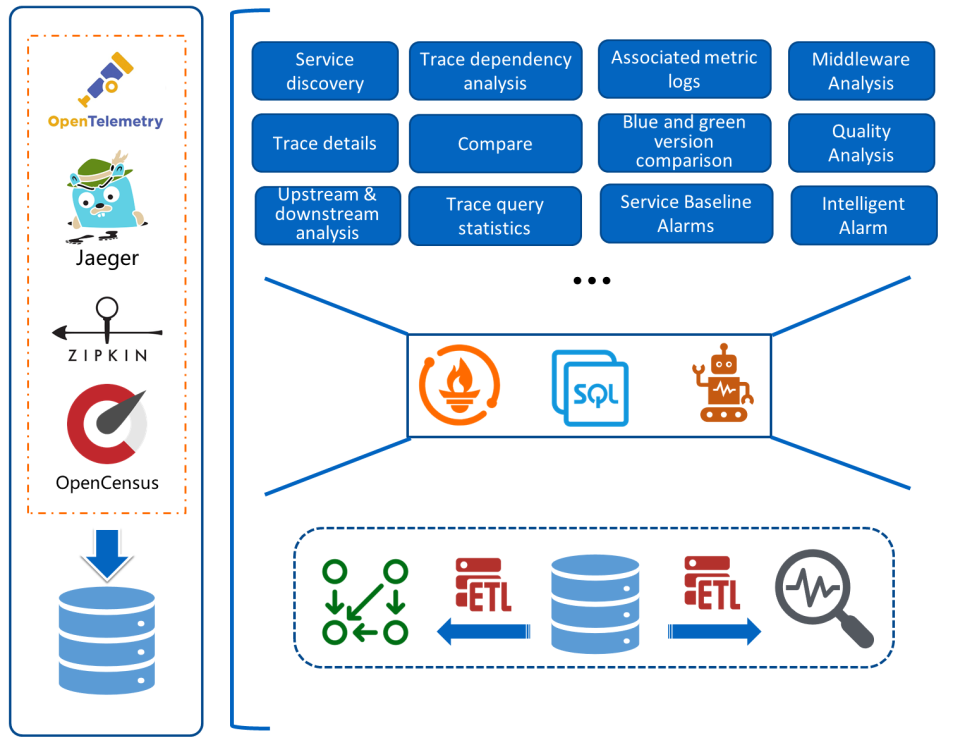
With the implementation of cloud-native and microservices in various industries, distributed tracing analysis (trace) is adopted by more and more companies. For trace, its most basic capability is to record the propagation of a user request in a distributed system and determine the dependency among multiple services. In terms of its features, a trace is a regular, standardized access log with dependency. Therefore, we can use trace for the calculation to mine more value.
The following is the implementation architecture of the SLS OpenTelemetry trace. The core idea here is to calculate trace raw data through data orchestration, as well as obtain aggregated data and implement additional features of various types of traces based on the interfaces provided by SLS. These additional features include:
In the early stage of observability, a lot of work requires manual execution. Ideally, we need an automated system to help us automatically diagnose exceptions based on the observed data when problems occur. It should also determine a reliable root cause and automatically fix issues according to the root cause diagnosis. At this stage, automatic exception recovery is difficult to achieve, but the location of the root cause can be identified through some algorithms and orchestration methods.
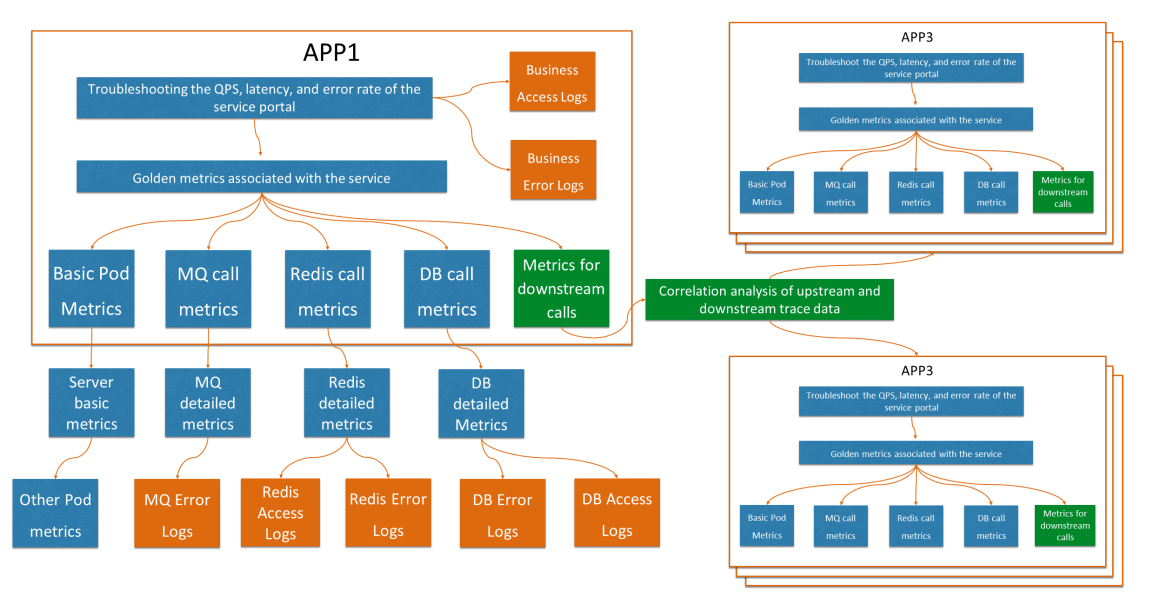
The following figure shows the observation abstraction of a typical IT system architecture. Each application will have its golden metrics, business access log, error log, basic monitoring metrics, call middleware metrics, and associated middleware metrics and logs. Concurrently, tracing can help determine the dependency between upstream and downstream apps and services. With such data and some algorithms and orchestration, we can perform automatic root cause analysis to some extent. The core dependencies are as follows:
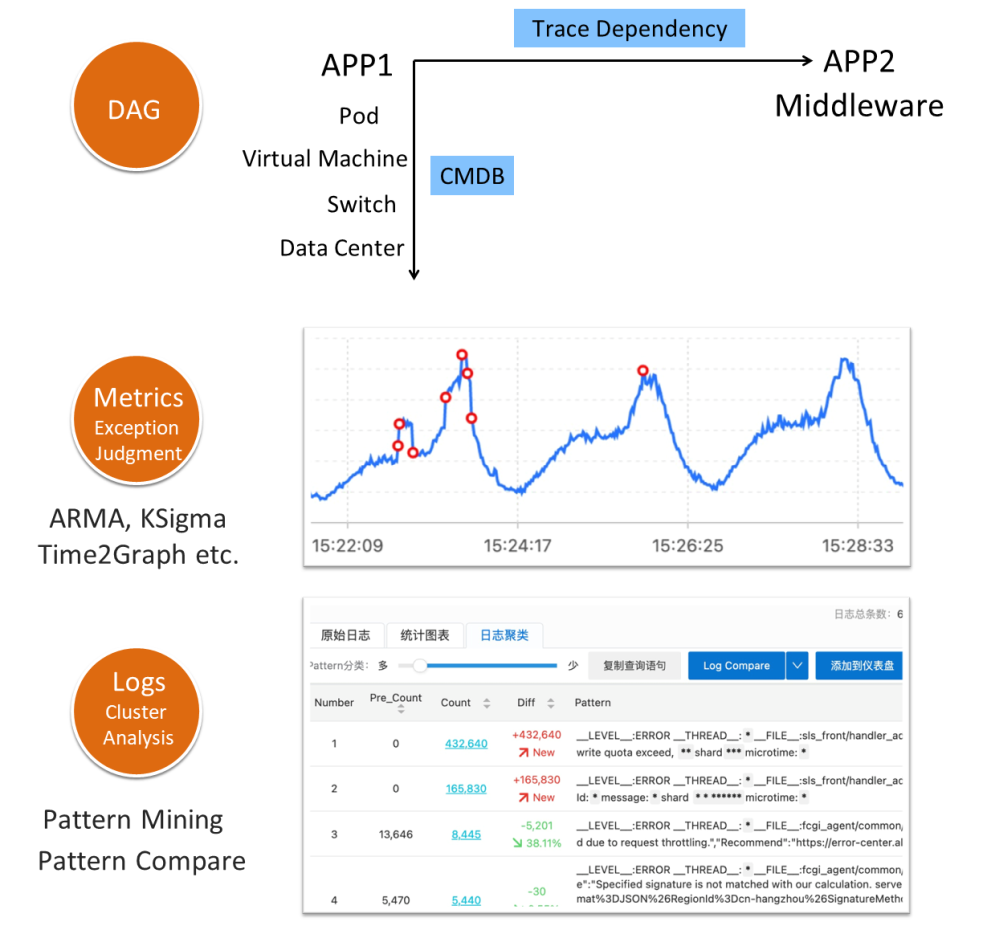
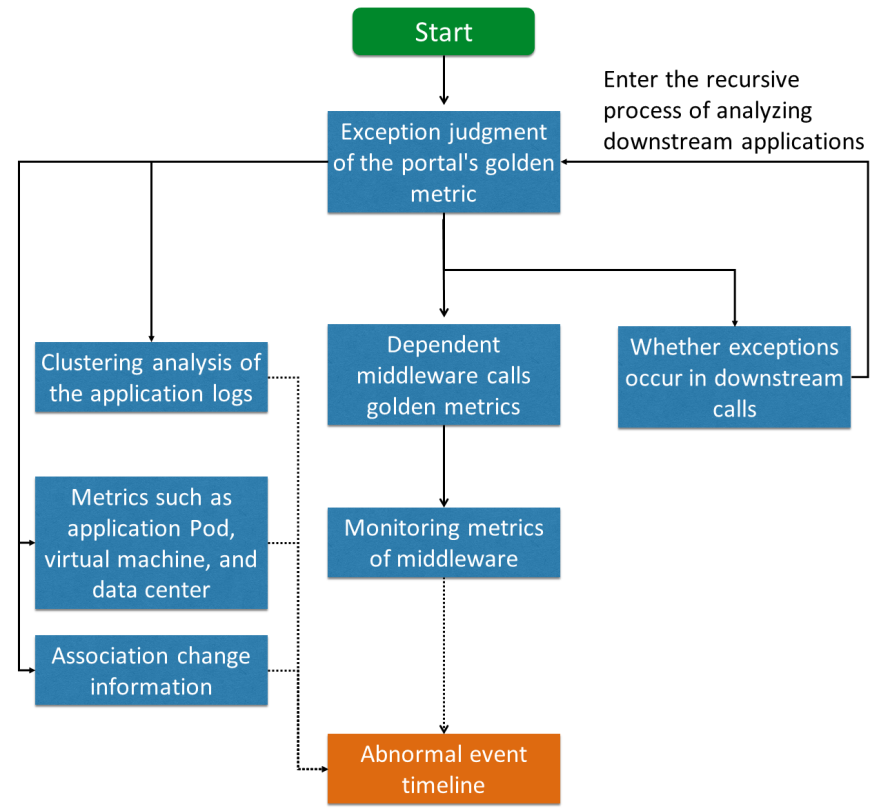
The exception analysis of time series and logs can help us determine whether there is a problem with a component, and the correlation can enable us to find out the cause of the problem. Combining these three core functionalities can help us build a root cause analysis system for exceptions. The following figure is a simple example: First, analyze the golden indicator of the entry from the alarm, and then analyze the data of the service, the dependency middleware indicator, and the application Pod / virtual machine indicator. We can use trace dependency to recursively analyze whether there is a problem with the downstream dependency. Further, some change information can be associated to quickly locate whether the change causes an exception. The abnormal events found are concentrated on the timeline for analysis. Alternatively, we can rely on O&M and development staff to determine the root cause.
The concept of observability is not a "black technology" invented overnight but a word that "evolved" from our daily work, similar to monitoring, problem troubleshooting, and prevention. Likewise, at first, we only worked on the log engine (Log Service of Alibaba Cloud), then we gradually optimized and upgraded it to an observability engine. For "observability," we have to put aside the concept itself to discover its essence, which is often related to business. For example, the goals of observability include:
For the R&D of the observability engine, our main concern is how to serve more departments and companies for the rapid and effective implementation of observability solutions. We have made continuous efforts in sensors, data, computing, and algorithms of the engine. The achievements of our efforts include more convenient eBPF collection, data compression algorithms with higher compression ratios, parallel computing with higher performance, and root cause analysis algorithms with lower recall rates. We will continue updating our work on the observability engine for everyone. Stay tuned.
New Evolution of SLS Prometheus Time Series Storage Technology
12 posts | 1 followers
FollowAlibaba Cloud Native Community - September 4, 2025
Alibaba Cloud Native Community - November 24, 2025
Alibaba Cloud Native - October 27, 2021
Alibaba Container Service - November 15, 2024
Alibaba Cloud Native Community - November 20, 2025
Alibaba Cloud Native Community - March 1, 2023
12 posts | 1 followers
Follow Bastionhost
A unified, efficient, and secure platform that provides cloud-based O&M, access control, and operation audit.
Learn More Managed Service for Grafana
Managed Service for Grafana displays a large amount of data in real time to provide an overview of business and O&M monitoring.
Learn More Alibaba Cloud Linux
Alibaba Cloud Linux is a free-to-use, native operating system that provides a stable, reliable, and high-performance environment for your applications.
Learn More IT Services Solution
Alibaba Cloud helps you create better IT services and add more business value for your customers with our extensive portfolio of cloud computing products and services.
Learn MoreMore Posts by DavidZhang
Dikky Ryan Pratama May 4, 2023 at 5:28 pm
Your post is very inspiring and inspires me to think more creatively., very informative and gives interesting new views on the topic., very clear and easy to understand, makes complex topics easier to understand, very impressed with your writing style which is smart and fun to work with be read. , is highly relevant to the present and provides a different and valuable perspective.