Since the advent of computers, monitoring has been one of the necessary and traditional methods used by a company's IT infrastructure. After decades of development, the current IT technology and architecture landscape has undergone significant changes, including the development model, system architecture, deployment model, and infrastructure. Currently, the mainstream technologies are microservices, containerization, cloud, and DevOps.
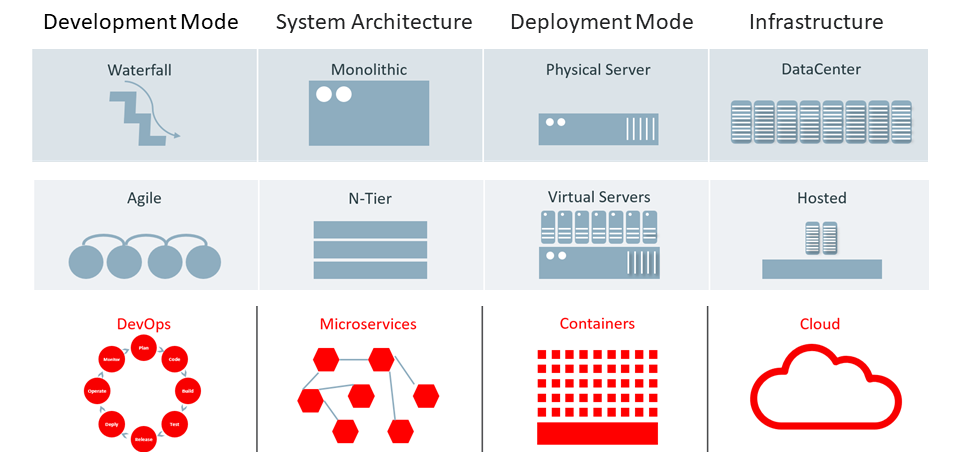
With these changes in the architecture, the entire system has become more complex with new, dynamic, and uncertain deployment models and operating environments. Today, development depends more on people and departments. Due to this complexity, the IT industry has reached the stage that requires more systematic observation with fast monitoring capabilities. Moreover, monitoring systems have also changed and are evolving towards cloud-native, data fusion, and intelligence.
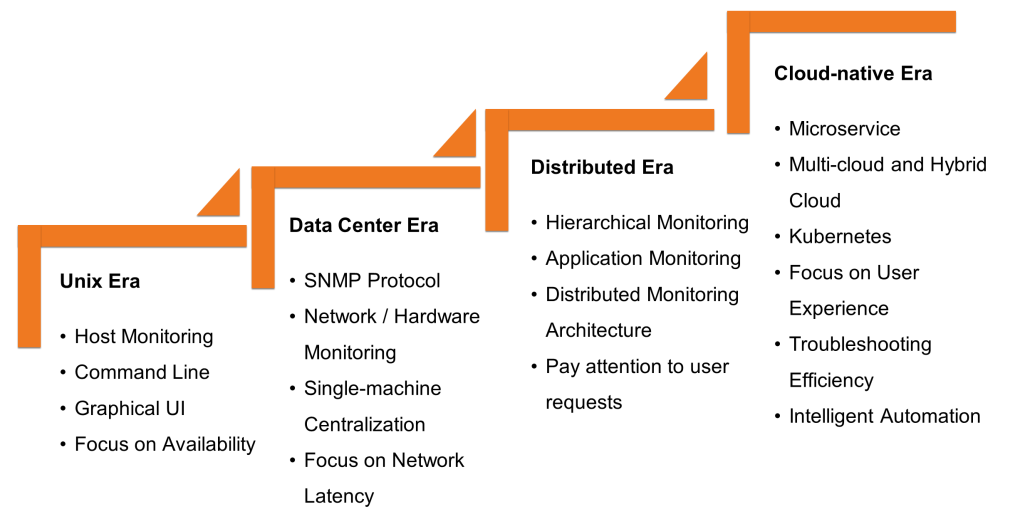
The entire development process of IT monitoring can be divided into the following four stages:
In the cloud-native era, a monitoring solution must be upgraded to a higher level and include extended monitoring capabilities to offer fast operations. It must consist of some of the following features listed below:
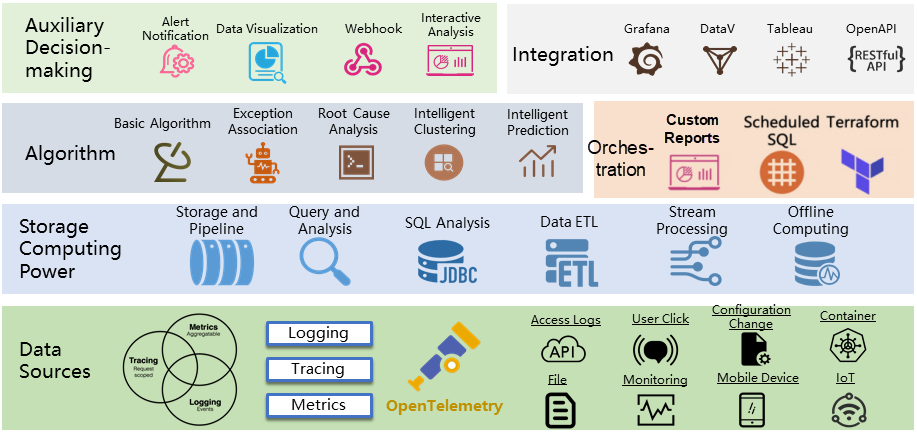
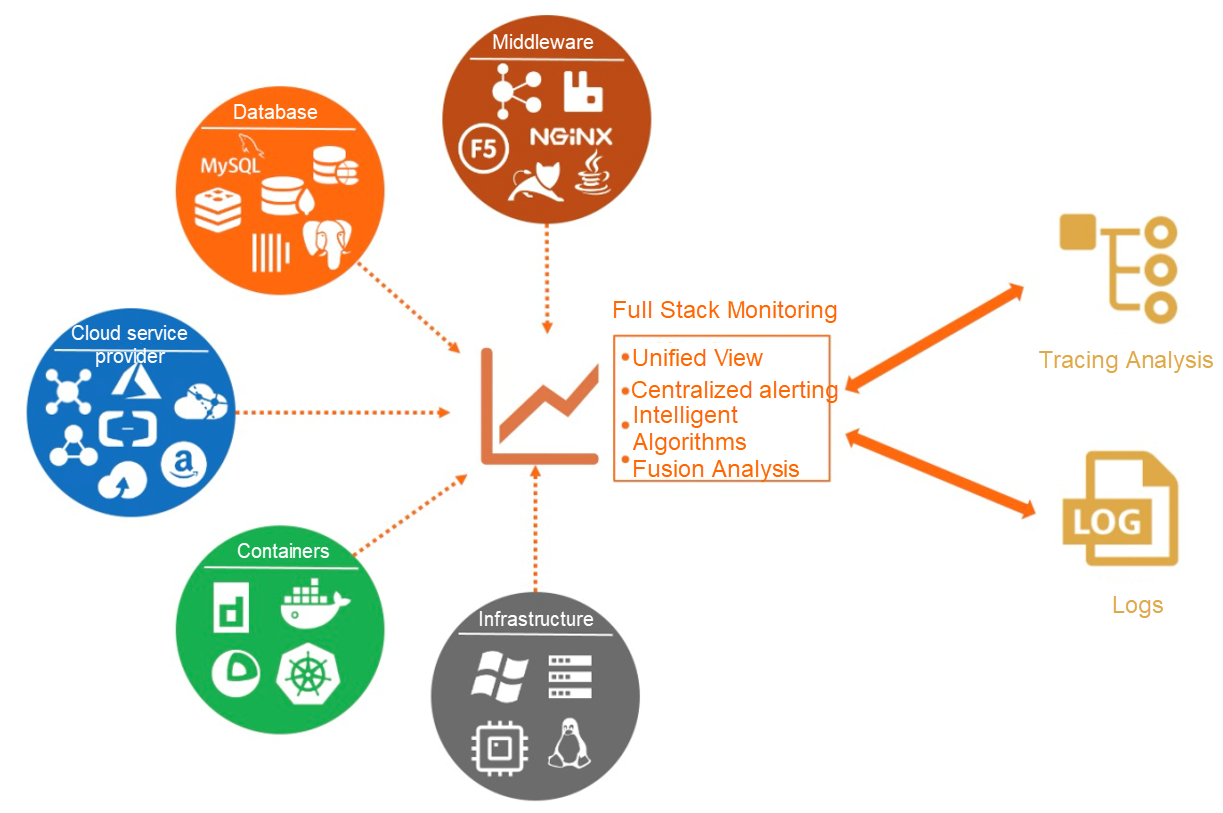
Being an observable data engine, Log Service (SLS) provides comprehensive collection and storage of observable data logs, metrics, distributed tracing analysis, and events. To help users quickly access and monitor business systems, SLS provides the full stack monitoring app, which collects all types of monitoring data into one instance for unified management and monitoring. Full stack monitoring is based on capabilities such as collection, storage, analysis, and visualization of monitoring data, alerting, and AIOps. The detailed features are as follows:
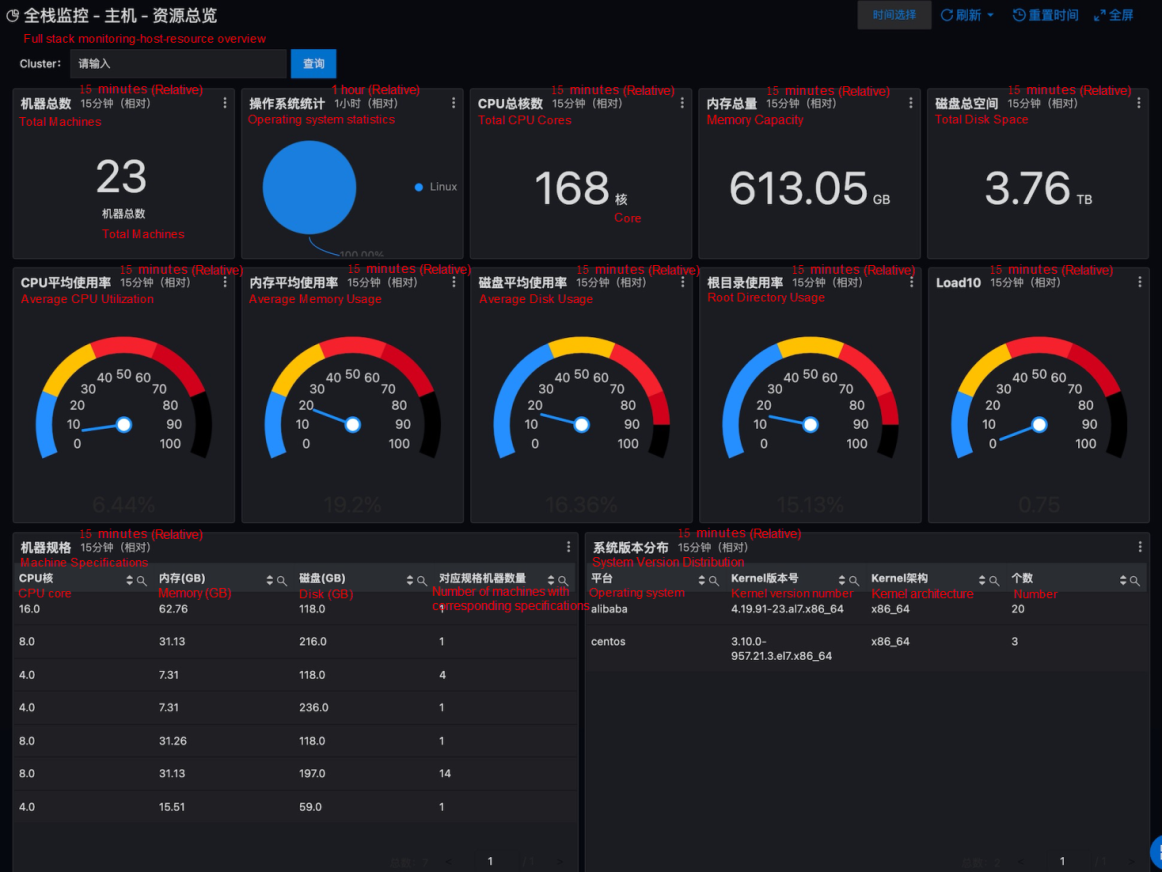
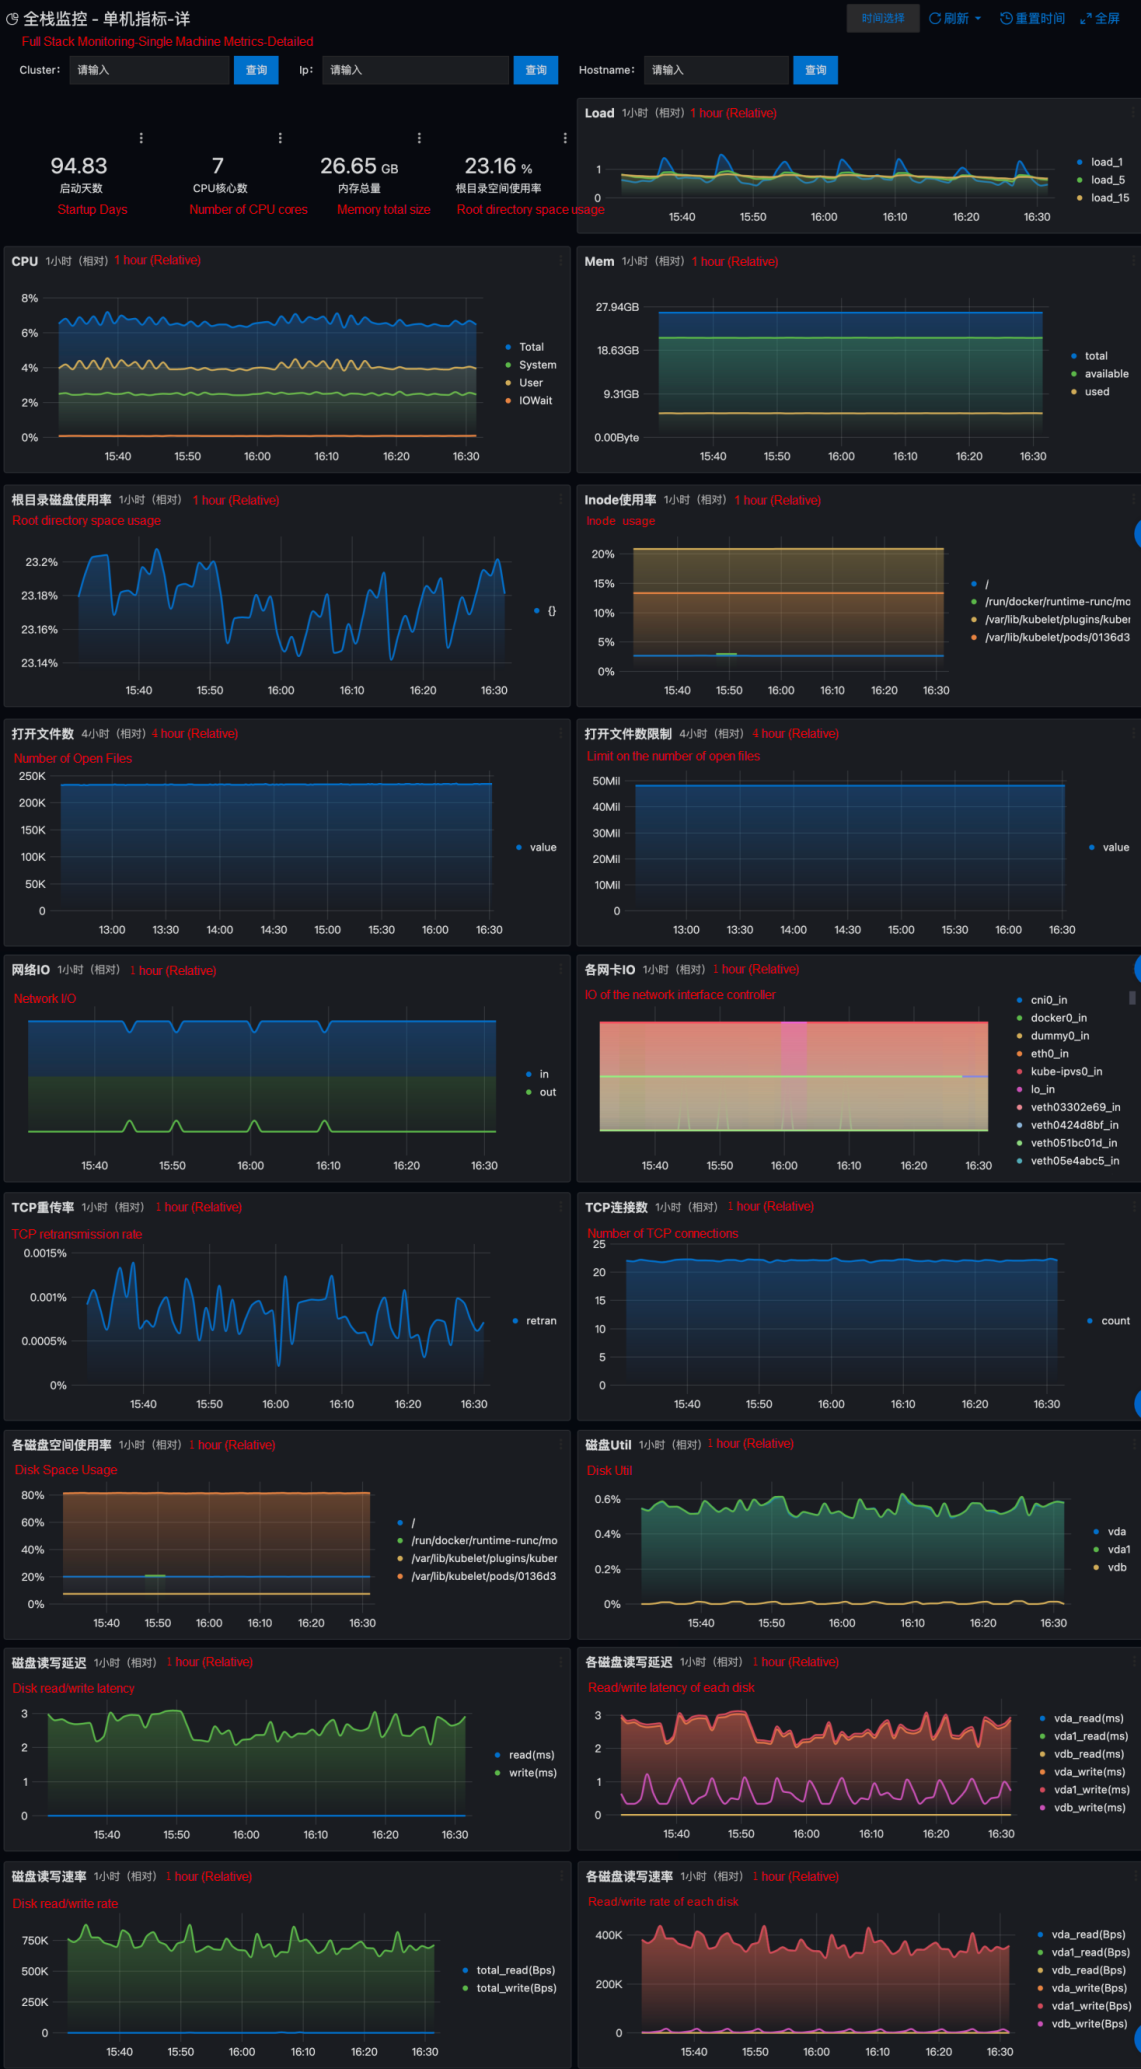
| Dashboard | Description |
| Resource overview | Real-time display of configuration and metric data of hosts in a visualized manner. The data includes the number of CPU cores, total disk space, average CPU utilization, and average memory usage. |
| Host list | Real-time display of each host's configuration data and metric data in a visualized manner. The data includes the number of CPU cores, memory size, CPU utilization, and memory usage. |
| Hotspot analysis | Real-time display of resource usage information of hotspot hosts in a visualized manner. The resources include CPUs and memory. The information includes the distribution of CPU utilization among hotspot hosts, distribution of memory usage among hotspot hosts, top CPU utilization, and top memory usage. |
| Standalone metrics-simplified | Real-time display of resource usage trends of a host in a visualized manner. The resources include CPUs and memory. The usage information includes CPU, disk space, and memory usage. |
| Standalone metrics-detailed | Real-time display of usage trends of host resources in different states in visualized manner. The resources include CPUs and memory. A CPU can have the following usage trends: Total, System, User, and IOWait. Memory can be in: Total, Available, and Used. |
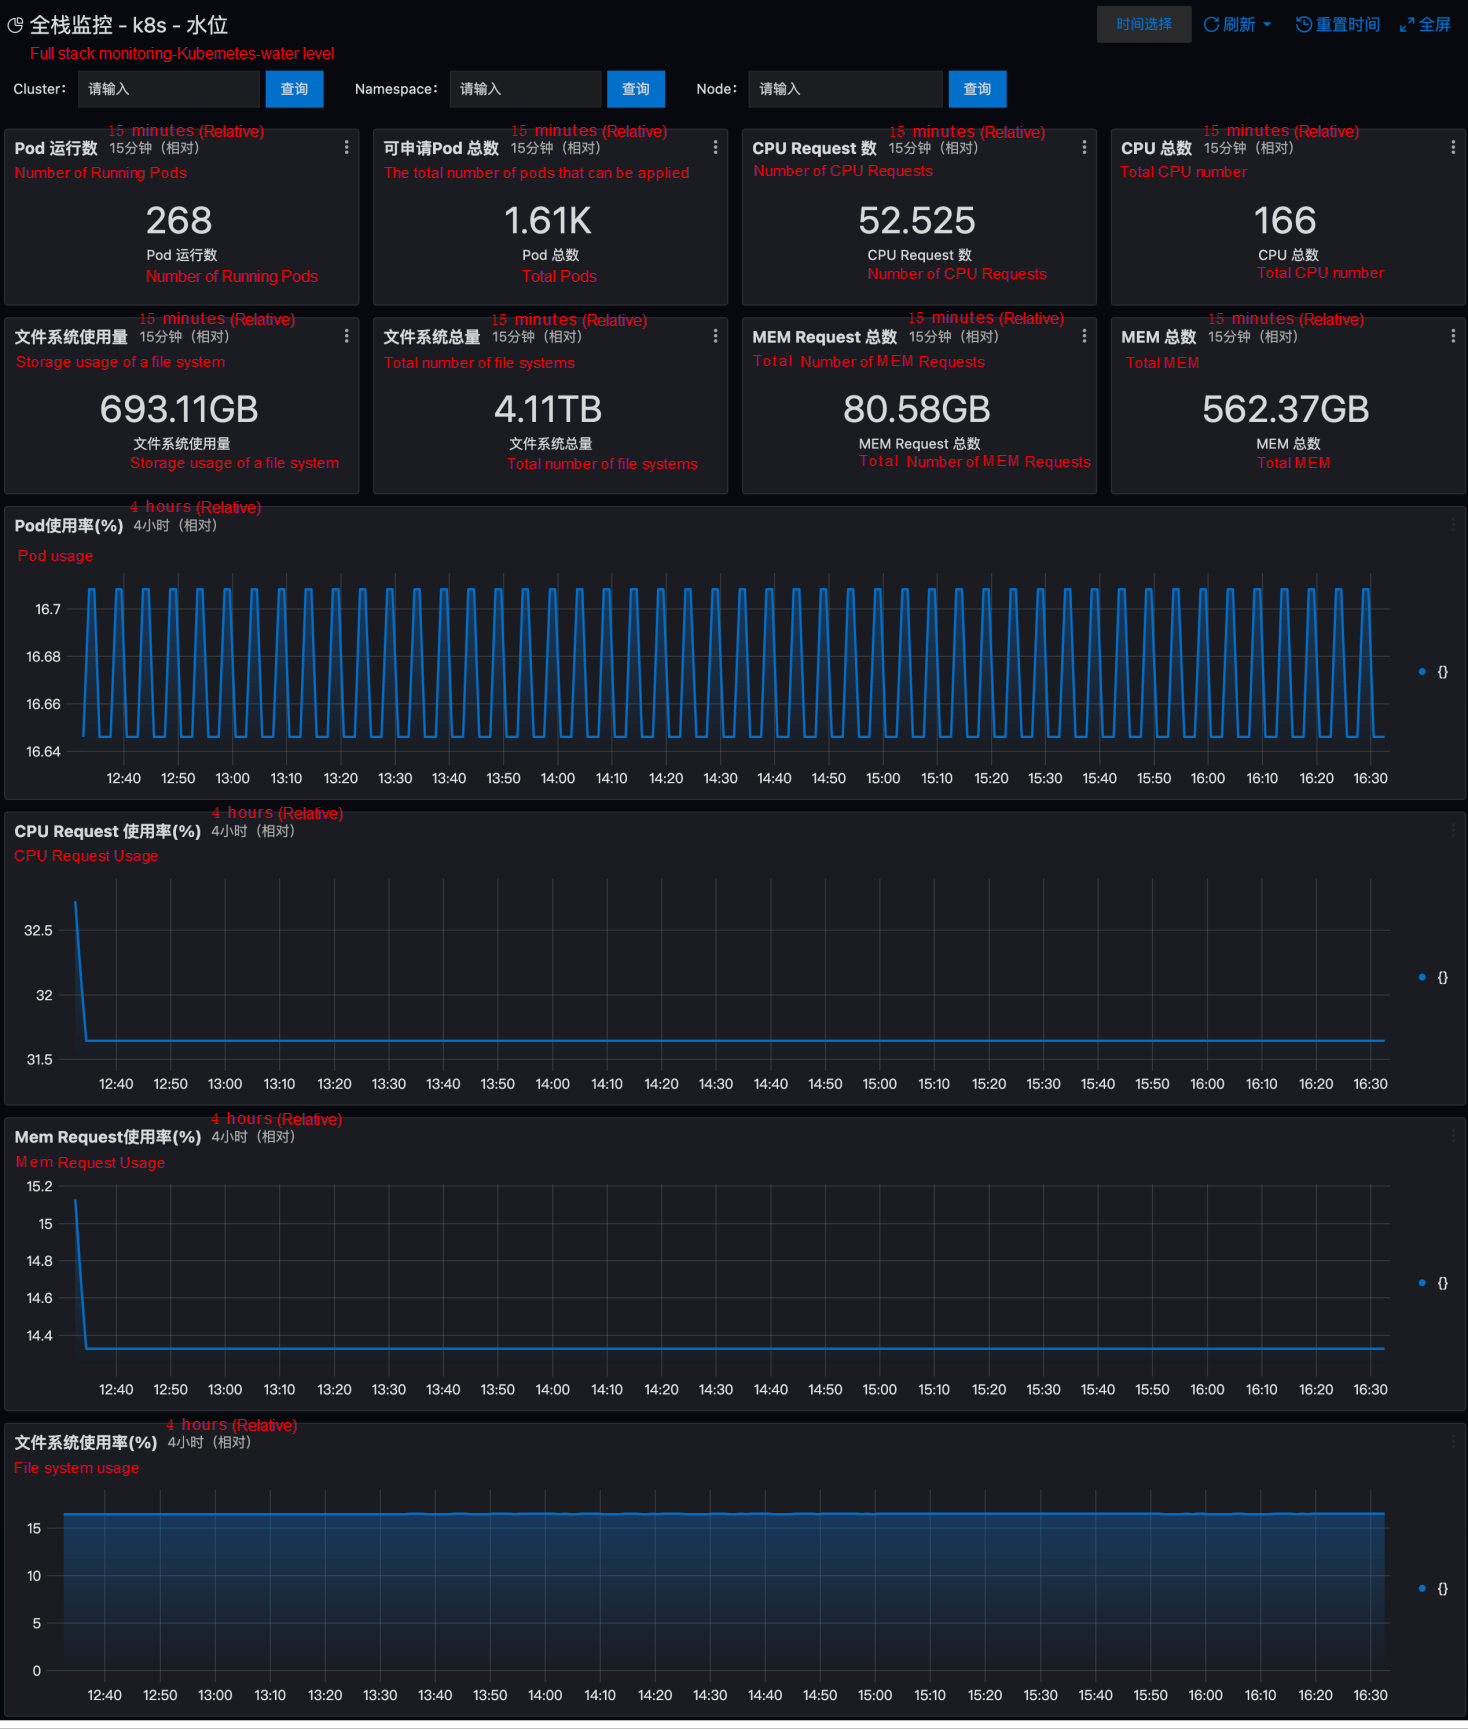
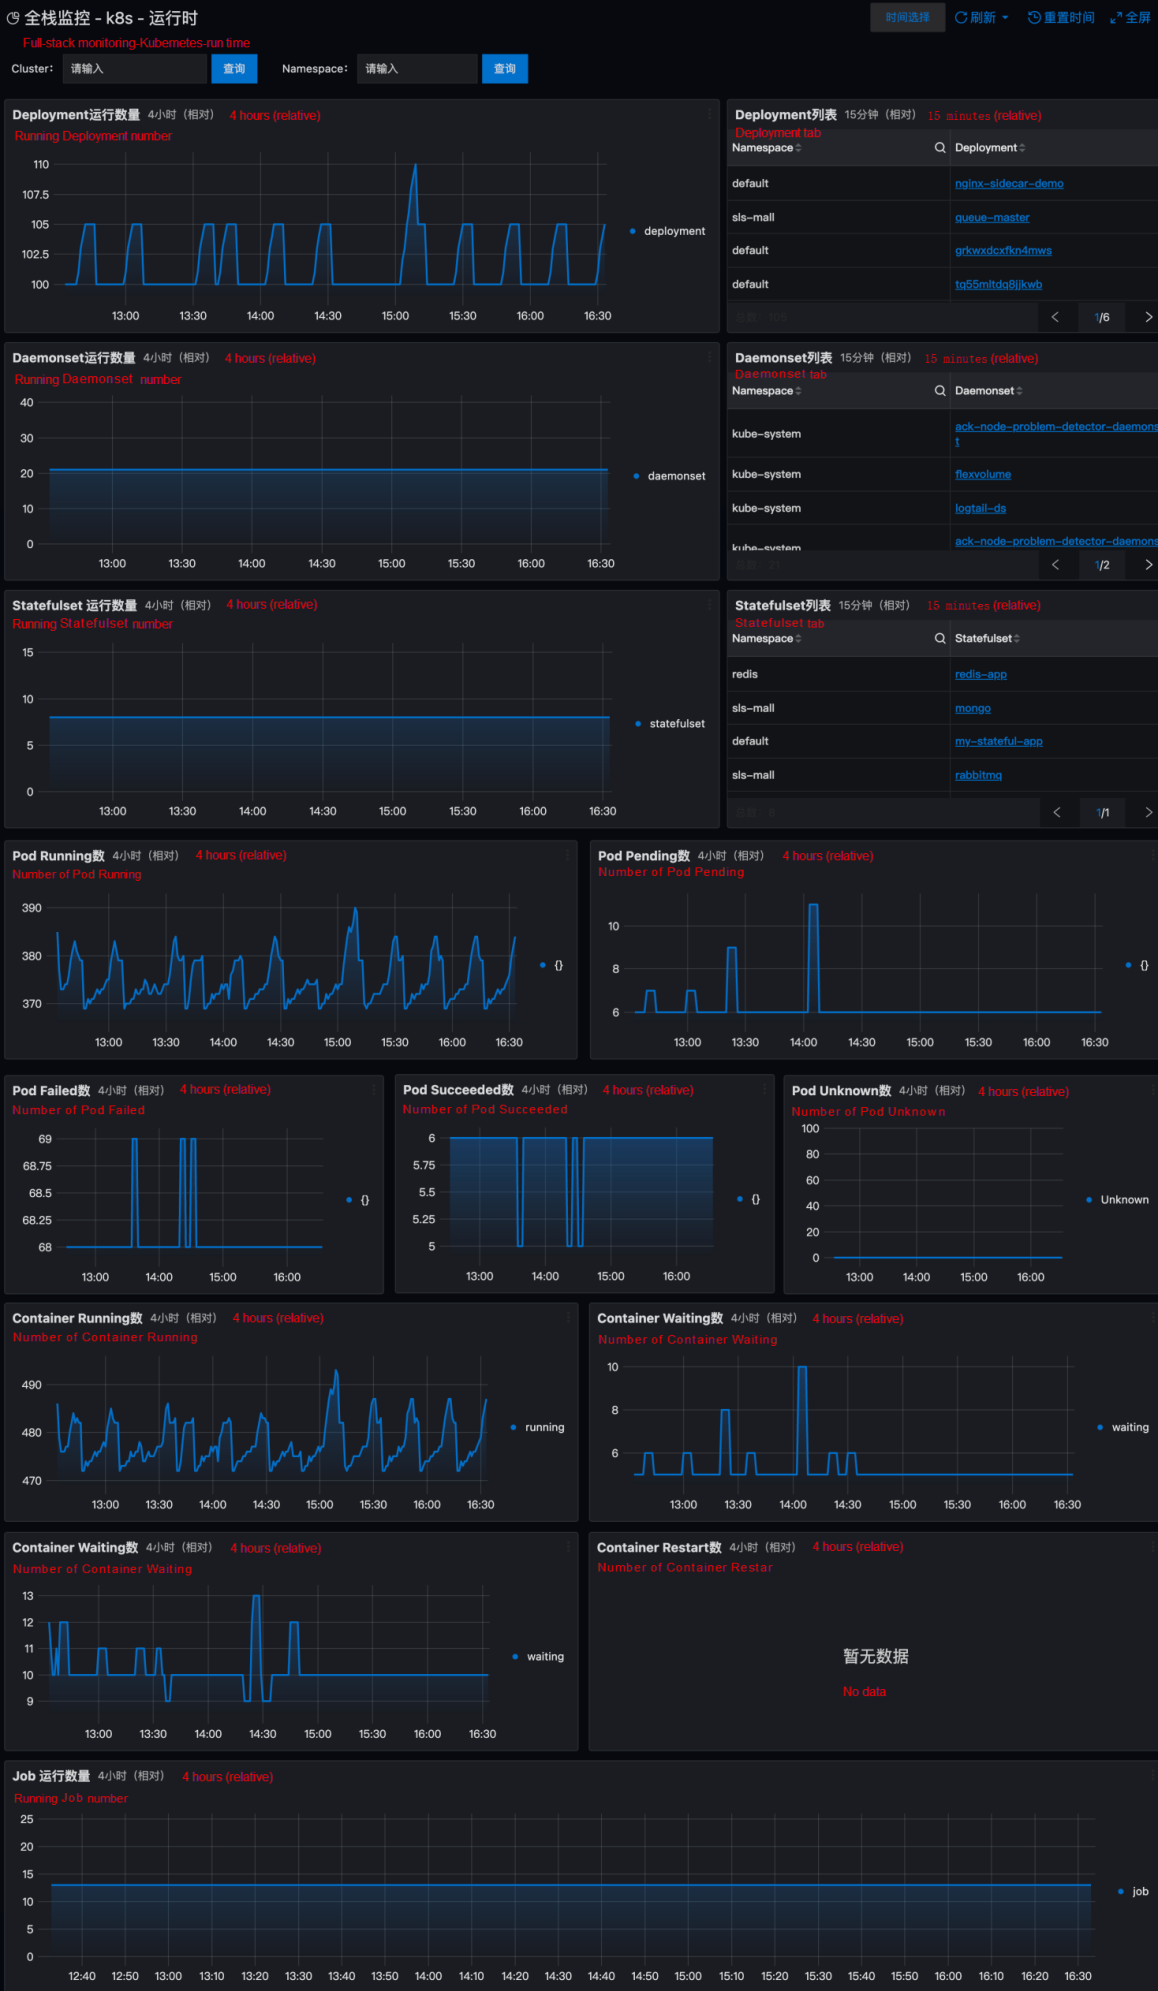
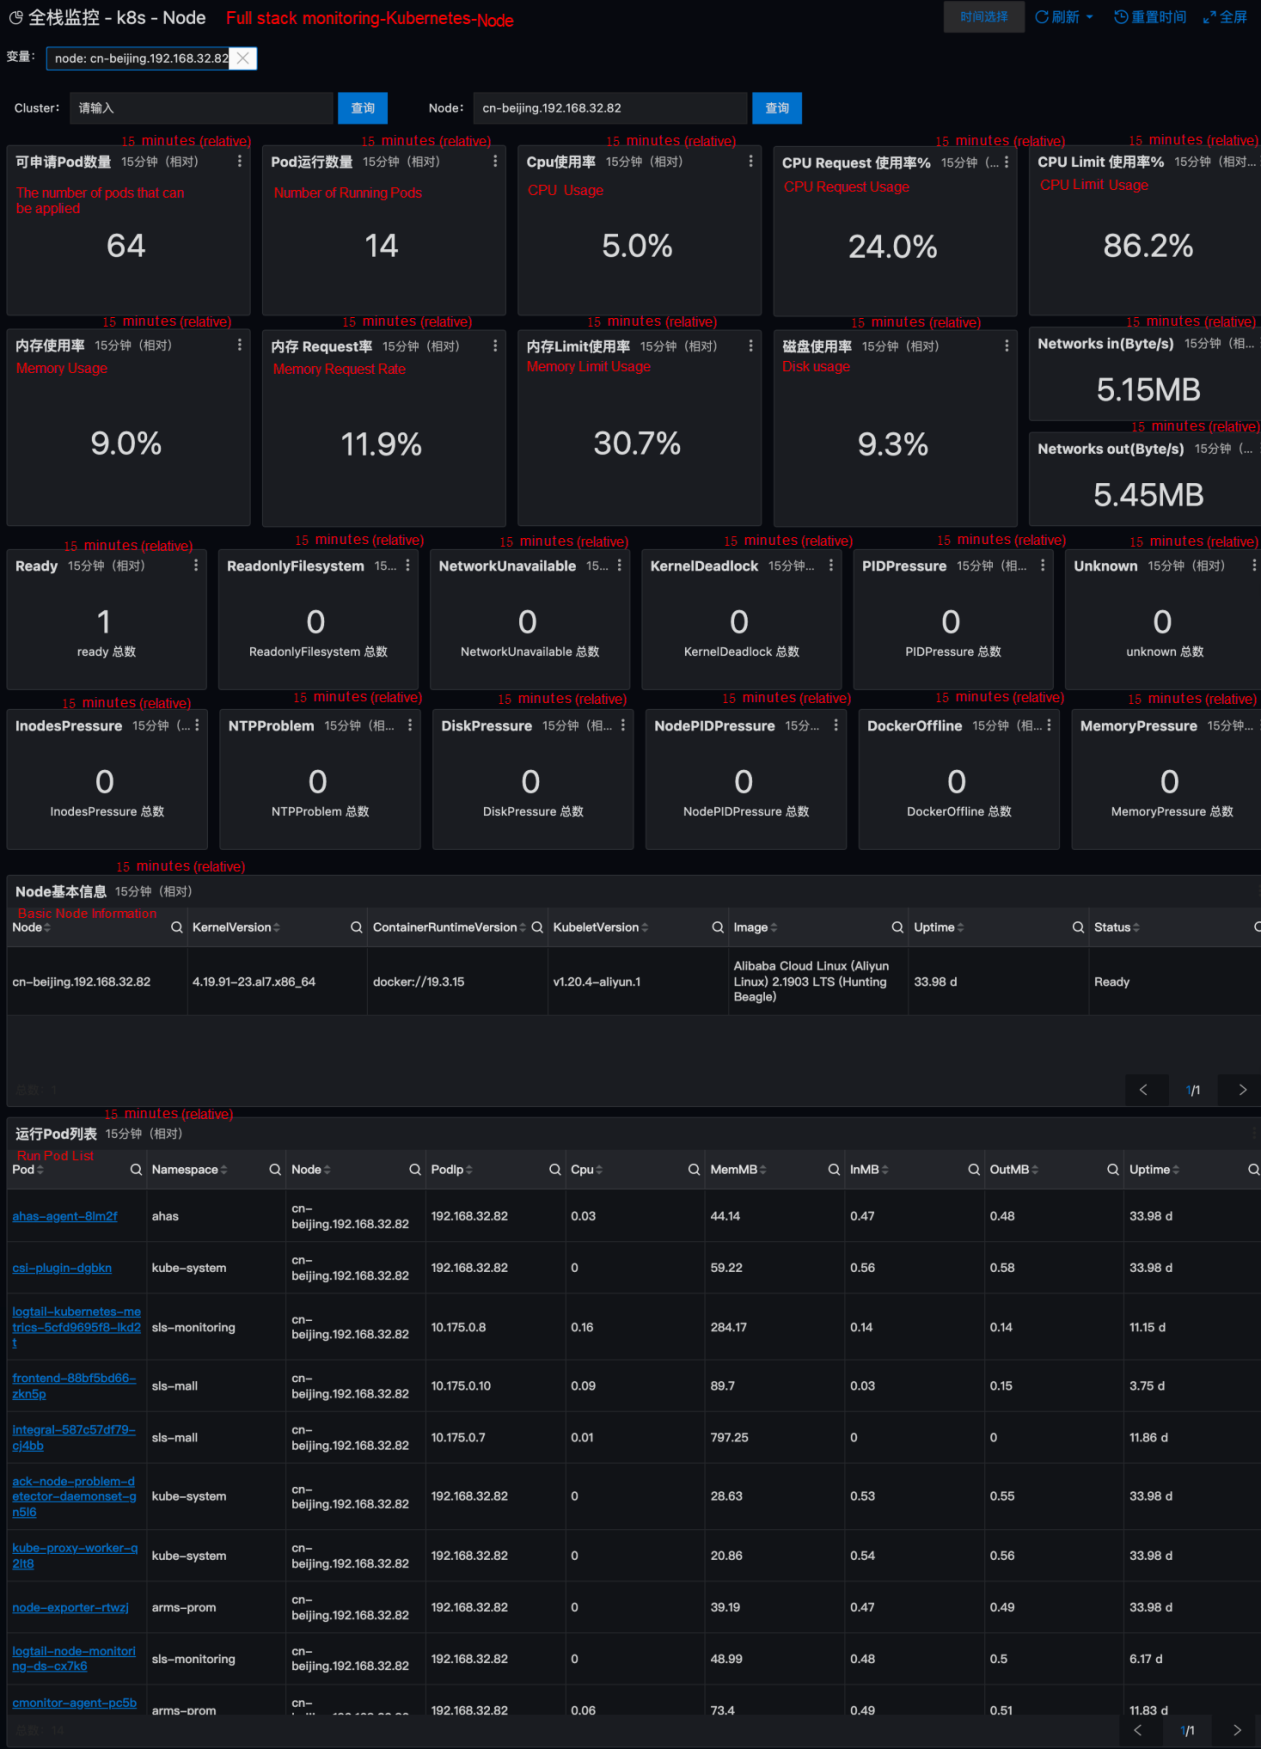
| Dashboard | Description |
| Resource overview | Display the resource usage in Kubernetes in a visualized manner in real-time. The resources include Pod, Host, Service, and Deployment. |
| Water level monitoring | Display the resource usage information in Kubernetes in a visualized manner in real-time. The information includes the number of running Pods, total number of CPUs, and file system usage. |
| Runtime monitoring | Display information about running resources in Kubernetes in a visualized manner in real-time. The information includes the number of running Deployments and the number of running DaemonSets. |
| Core components monitoring | Display information about the core components in Kubernetes in a visualized manner in real-time. The information includes the number of etcd objects and the queries per second (QPS) of etcd. |
| Node list | Display overall information about nodes, and the configuration data and metric data of each node in a visualized manner in real-time. The information includes the total number of nodes and the total number of running Pods. |
| Node metrics | Display the metric data of a node in a visualized manner in real-time. The data includes the number of requested Pods and CPU utilization. |
| Pod tab | Display overall information about Pods, the configuration data, and metric data of each Pod in a visualized manner in real-time. The information includes the total number of Pods that can be requested. |
| Pod metrics | Display the metric data of Pods in real-time. The data includes the basic information about Pods and the containers. |
| Deployment tab | Display the configuration data and metric data of each Deployment in a visualized manner in real time. The data includes the namespace and cluster to which a Deployment belongs. |
| Deployment metrics | Display the metric data of Deployment in a visualized manner in real time. The data includes the CPU Limit usage and Memory Limit usage. |
| StatefulSet tab | Display the configuration data and metric data of each StatefulSet in a visualized manner in real-time. The data includes the namespace and cluster to which a StatefulSet belongs. |
| StatefulSet metrics | Display the metric data of a StatefulSet in a visualized manner in real-time. The data includes the CPU Limit usage and Memory Limit usage. |
| DaemonSet tab | Display the configuration and metric data of each DaemonSet in a visualized manner in real-time. The data includes the namespace and cluster to which a DaemonSet belongs. |
| DaemonSet metrics | Display the metric data of a DaemonSet in a visualized manner in real-time. The data includes the CPU Limit usage and Memory Limit usage. |
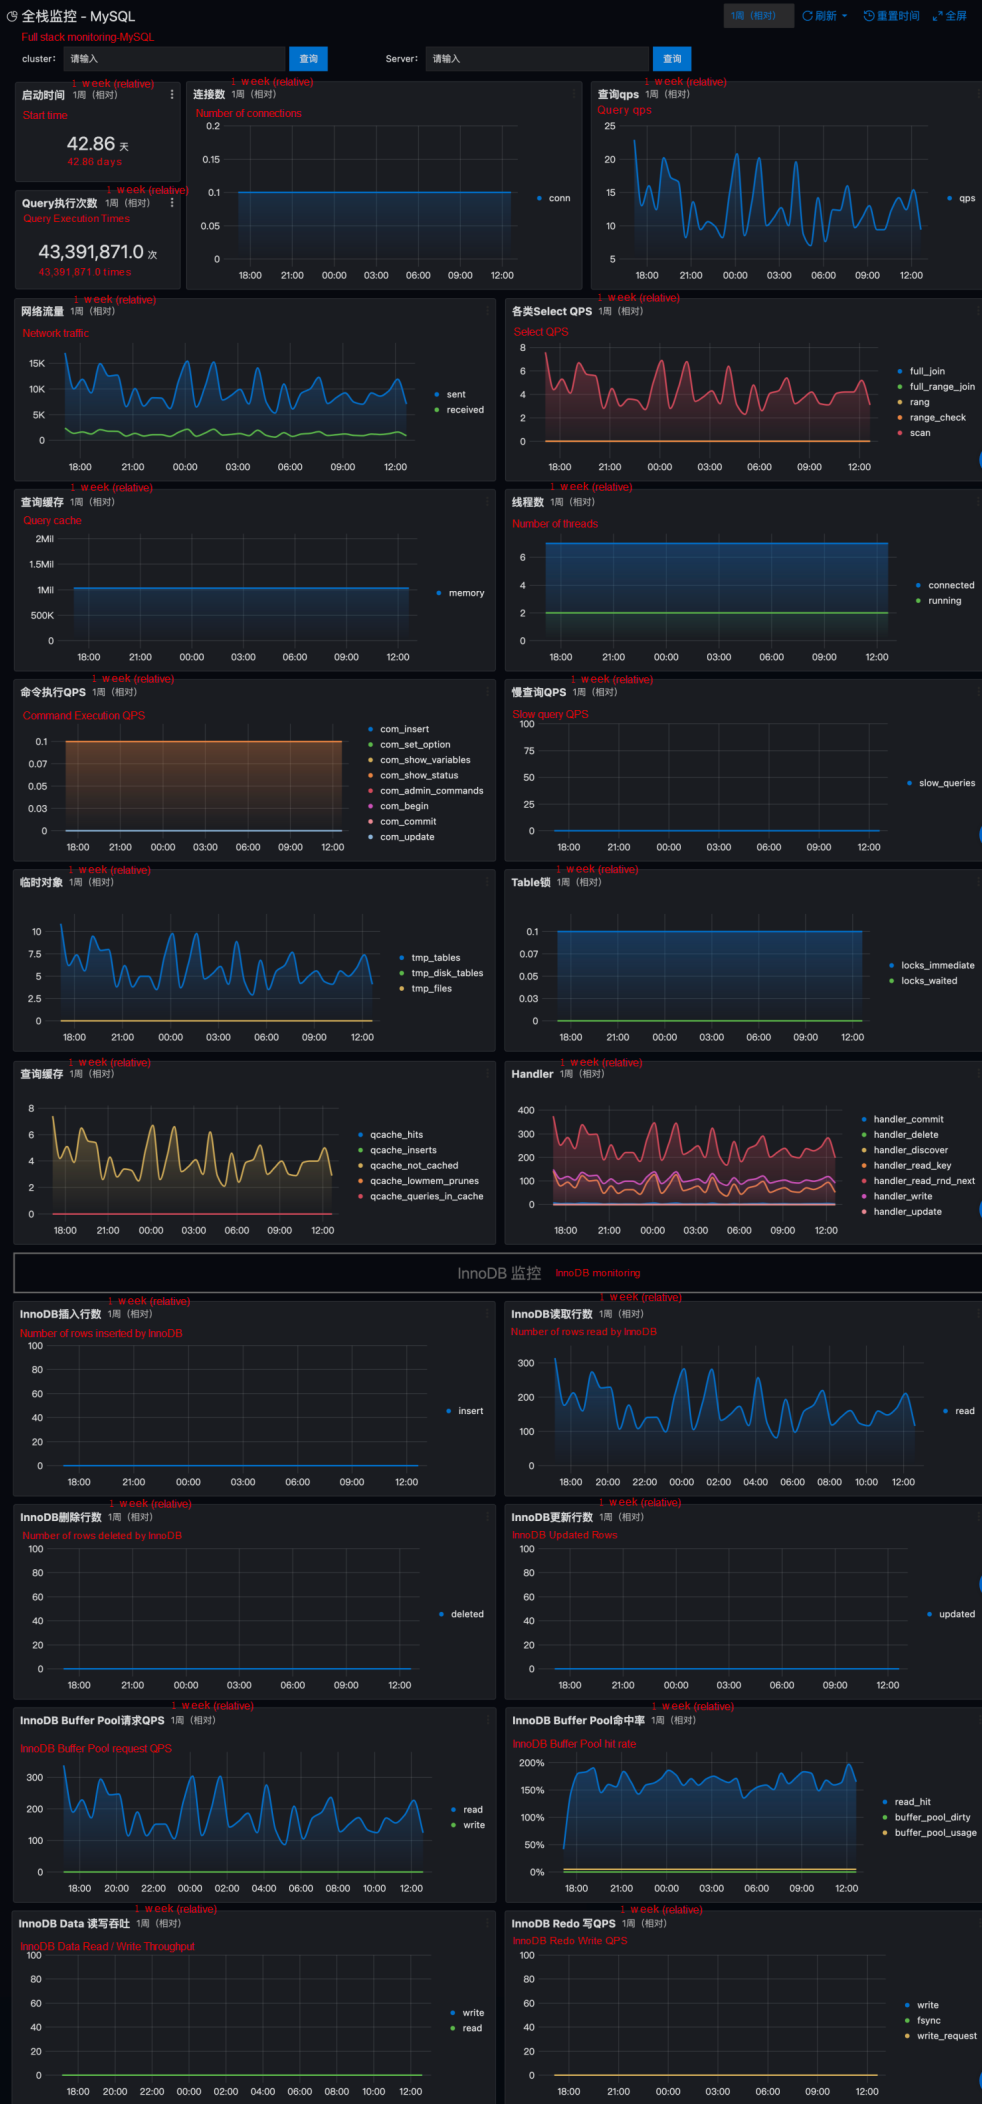
| Dashboard | Description |
| MySQL monitoring | Display the metric data of the MySQL database in a visualized manner in real-time. The data includes the startup time, number of Query operations, and number of connections. |
| Redis monitoring | Display the metric data of the Redis database in a visualized manner in real-time. The data includes the number of cluster instances that are enabled, Redis runtime, and connected clients. |
| Elasticsearch monitoring | Display the metric data of Elasticsearch in a visualized manner in real-time. The data includes the cluster health and Node. |
| ClickHouse Monitoring | Display the metric data of ClickHouse databases in a visualized manner in real-time. The data includes Query and Merge. |
| MongoDB monitoring | Display the metric data of MongoDB databases in a visualized manner in real-time. The data includes Available Connections and Query Operations. |
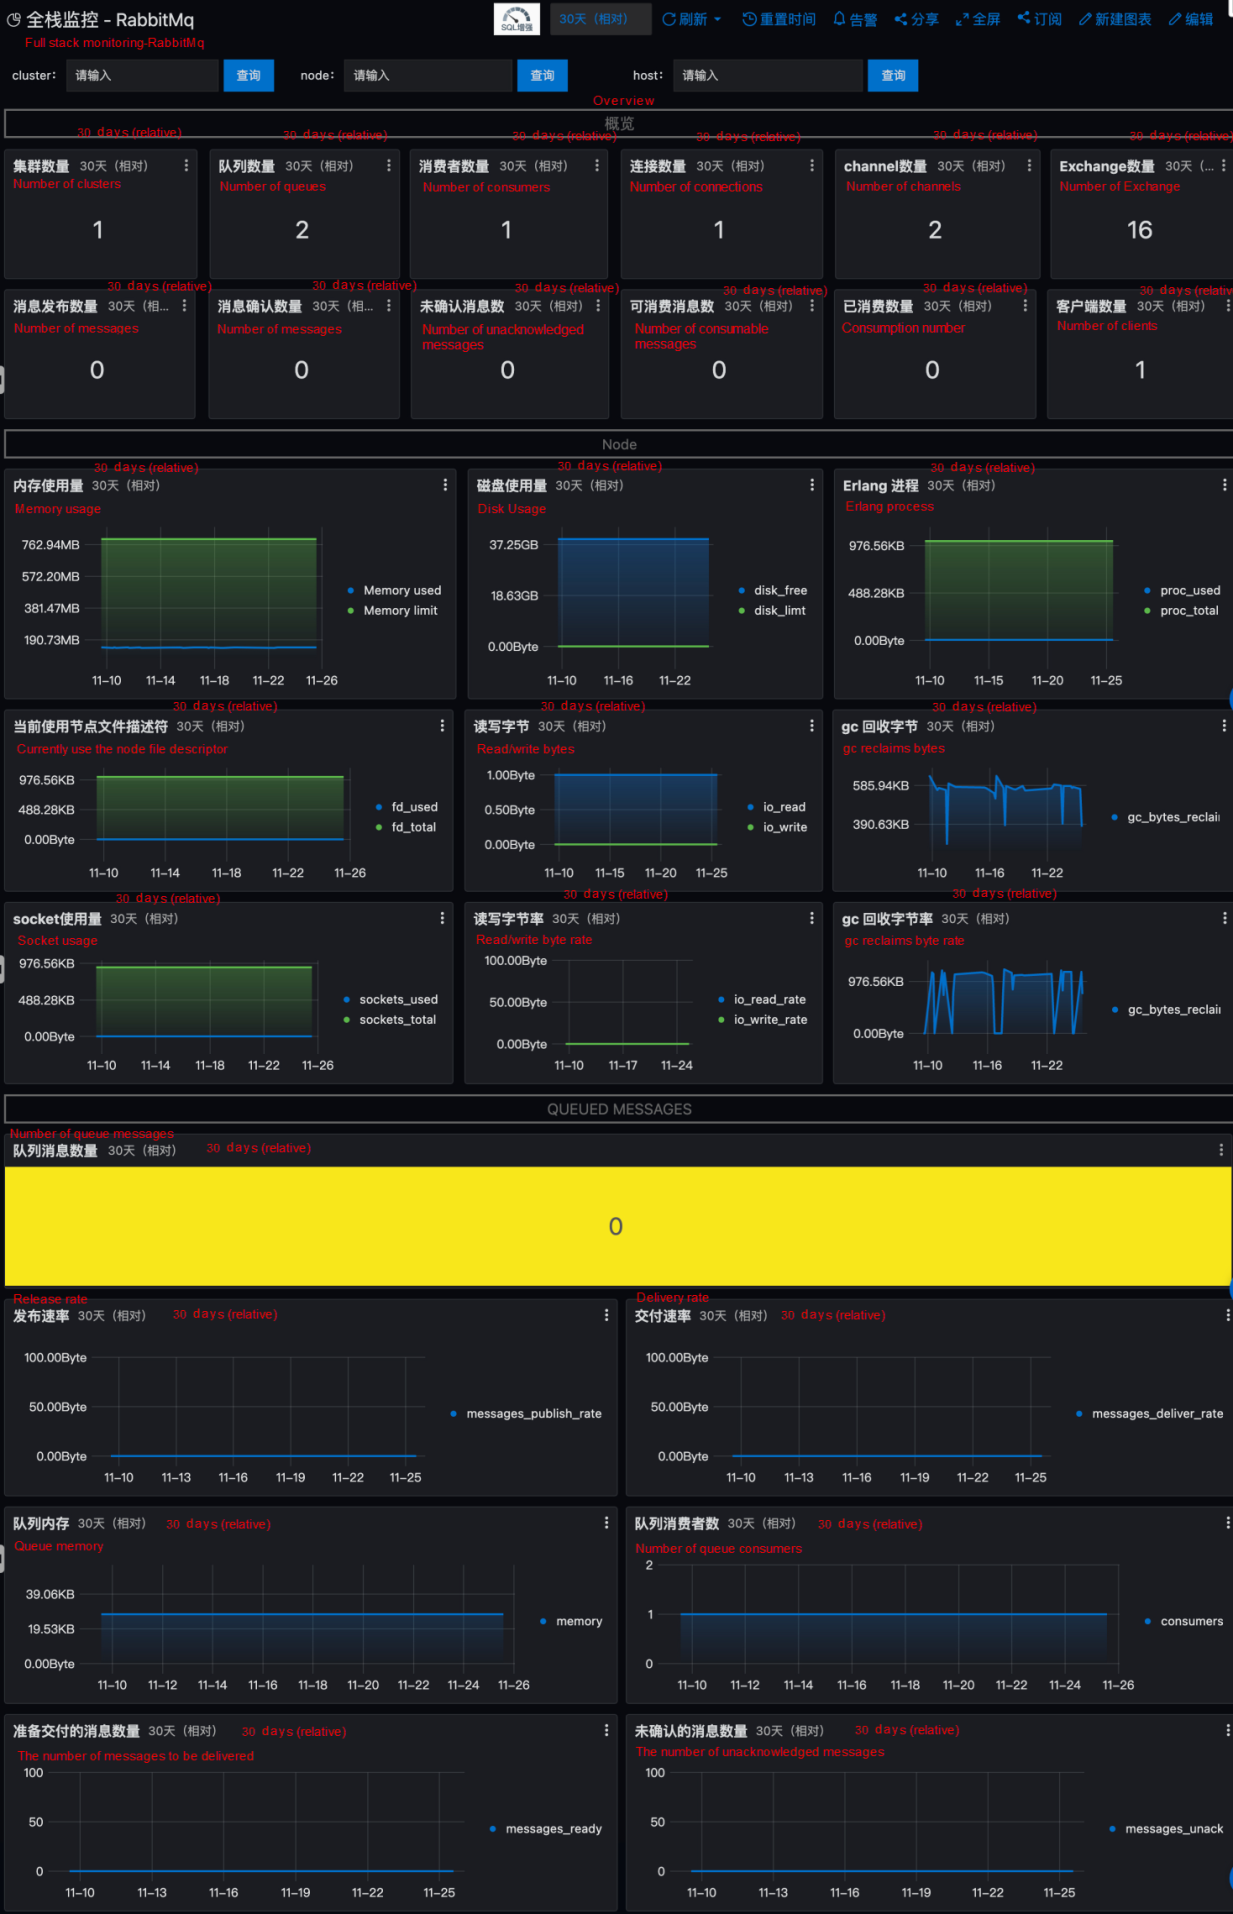
| Dashboard | Description |
| JVM monitoring | Display the metric data of the JVM in a visualized manner in real-time. The data includes the running time, total memory, heap memory, and CPU utilization. |
| Nginx monitoring | Display the metric data of Nginx in a visualized manner in real-time. The data includes the number of processed connections and QPS. |
| Tomcat monitoring | Display the metric data of Tomcat in a visualized manner in real-time. The data includes the running time, QPS, number of errors, and CPU utilization. |
| Kafka monitoring | Display the metric data of Kafka in a visualized manner in real-time. The data includes the status of the controller, the total number of topics, and the number of messages per second. |
| NVIDIA GPU monitoring | Display the metric data of NVIDIA GPU in a visualized manner in real-time. The data includes GPU utilization and memory utilization. |
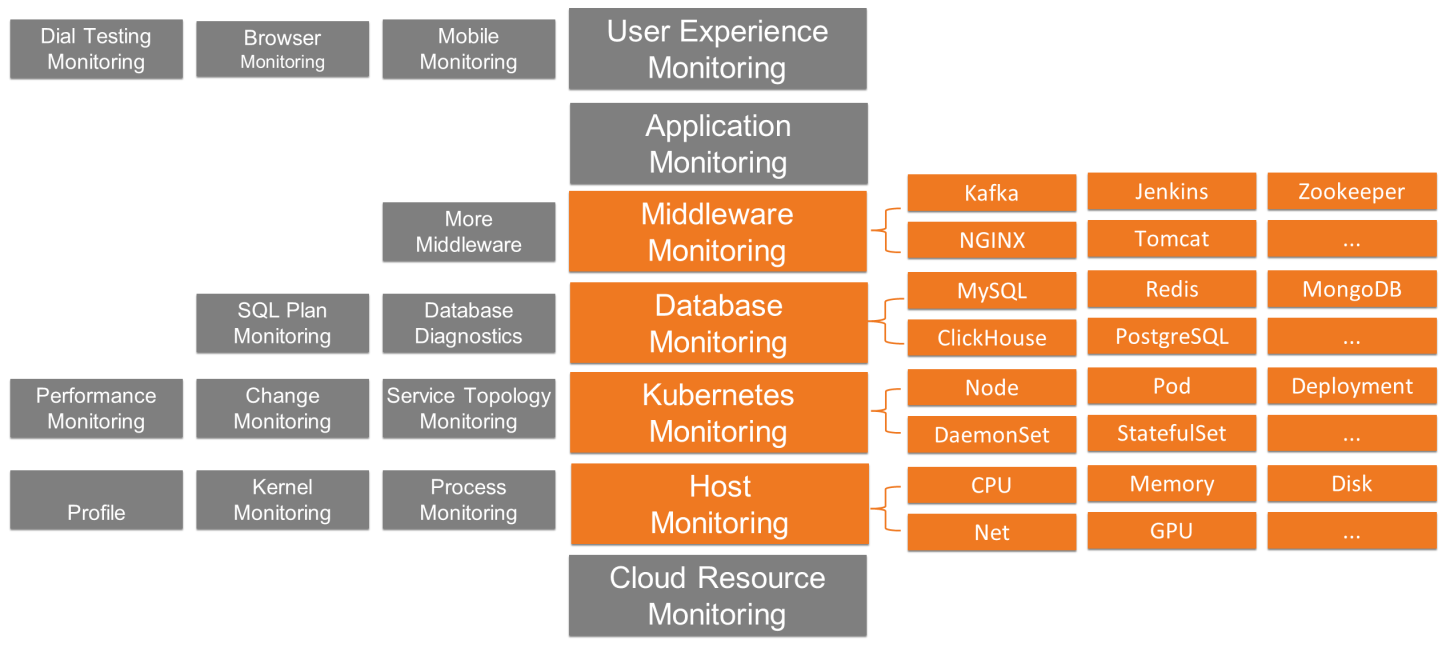
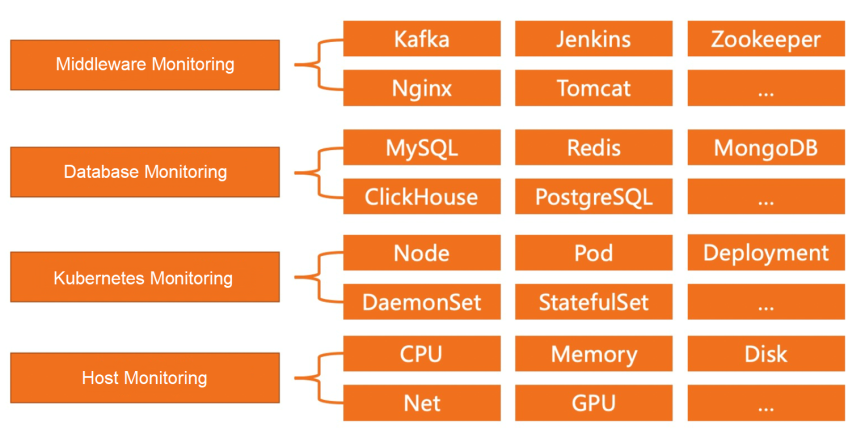
At this stage, full stack monitoring provides host monitoring, Kubernetes monitoring, database monitoring, and middleware monitoring. The subsequent horizontal and vertical function extensions will be available soon. For example:
Technical Practice of Alibaba Cloud Observability Data Engine
12 posts | 1 followers
FollowDavidZhang - July 5, 2022
Alibaba Cloud Community - October 9, 2022
H Ohara - March 13, 2024
Alibaba Cloud Native Community - August 13, 2025
Alibaba Cloud Community - July 8, 2022
DavidZhang - January 15, 2021
12 posts | 1 followers
Follow Bastionhost
A unified, efficient, and secure platform that provides cloud-based O&M, access control, and operation audit.
Learn More Managed Service for Grafana
Managed Service for Grafana displays a large amount of data in real time to provide an overview of business and O&M monitoring.
Learn More IT Services Solution
Alibaba Cloud helps you create better IT services and add more business value for your customers with our extensive portfolio of cloud computing products and services.
Learn More Enterprise IT Governance Solution
Alibaba Cloud‘s Enterprise IT Governance solution helps you govern your cloud IT resources based on a unified framework.
Learn MoreMore Posts by DavidZhang