This topic describes how to view the exception analysis details of an application.
Criteria
The exception analysis feature of Application Real-Time Monitoring Service (ARMS) detects Java exceptions. Due to the try...catch statement, exceptions that occur in an interface call may not be detected. If the statement is executed multiple times, an interface call may encounter various exceptions. If an exception affects the response of an interface call without being detected by the try...catch statement, an error is returned.
Prerequisites
The application is monitored by Application Monitoring. For more information, see Overview.
Procedure
Log on to the ARMS console. In the left-side navigation pane, choose .
On the Applications page, select a region in the top navigation bar and click the name of the application that you want to manage.
Note
If the  icon is displayed in the Language column, the application is connected to Application Monitoring. If a hyphen (-) is displayed, the application is connected to Managed Service for OpenTelemetry .
In the left-side navigation pane, click Application Details.
On the Application Details page, select an application instance, set the time period, and then click the Exception Analysis tab.
Exception analysis
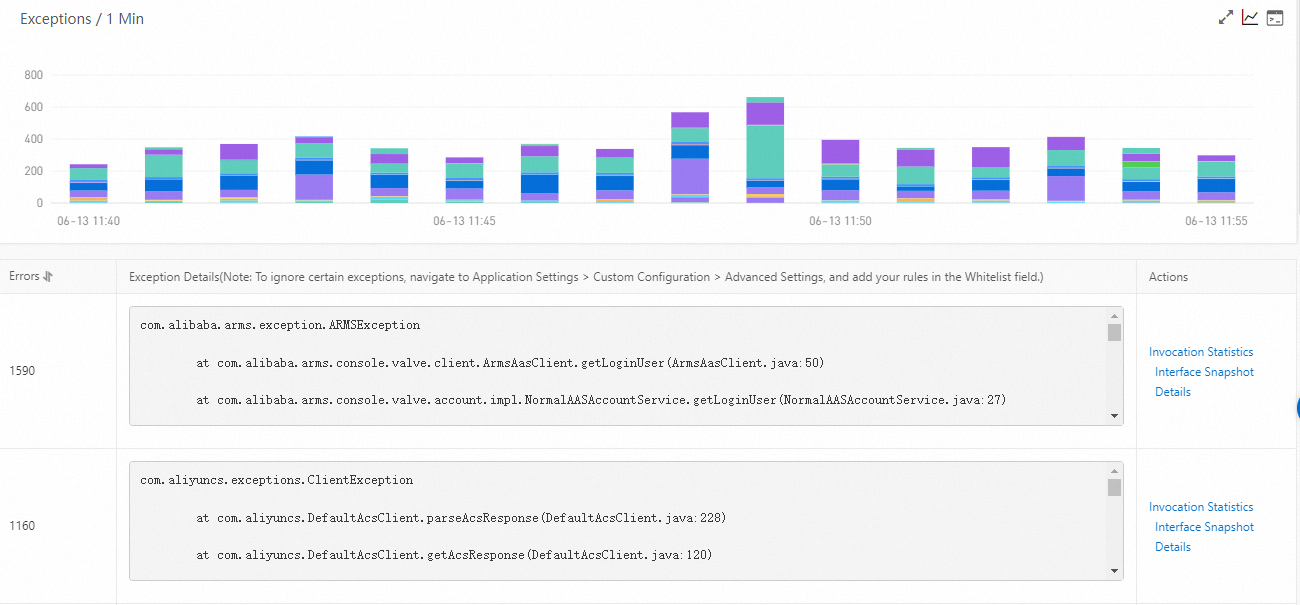
The Exceptions section displays the stacked chart of the exception data of the application in the specified time period and the exception list.
Optional: In the Exceptions section, you can perform the following operations:
- Move the pointer over a chart and view the detailed statistics.
- Use the cursor to select a time period to view the statistics of the specified time period.
- Click the
 icon to view the statistics of the metric in a certain time period or compare the statistics of the metric in the same time period on different dates.
 - Click the
 icon to view the API details of the metric.
Exception list
The exception list displays all exceptions of the application in the specified time period.
Optional: In the exception list, you can perform the following operations:
Note
To query exceptions, specify the Whitelist field in the Advanced Settings section of the Custom Configuration tab on the Application Settings page.
To view the stacked column chart of an exception, click Invocation Statistics in the Actions column.
To view the traces of a command, click Interface Snapshot in the Actions column.
For more information, see Query traces.
To view the details of an exception, click Details in the Actions column.


 Elastic Compute Service (ECS)
 Container Compute Service (ACS)