When JVM instances launch with incorrect flags or mismatched versions, debugging performance issues becomes difficult. The JVM Configuration page in ARMS Application Monitoring lists every JVM instance running under an application, along with startup arguments, process metadata, and version details. Use this page to verify launch flags, compare configurations across instances, and troubleshoot startup problems.
Prerequisites
Before you begin, ensure that you have:
An application connected to Application Monitoring in ARMS. For setup instructions, see Application Monitoring overview
View JVM instance configurations
Log on to the ARMS console.
In the left-side navigation pane, choose Application Monitoring > Applications.
On the Applications page, select a region in the top navigation bar, then click the application name.
A
 icon in the Language column indicates the application is connected to Application Monitoring. A hyphen (-) indicates it is connected to Tracing Analysis.
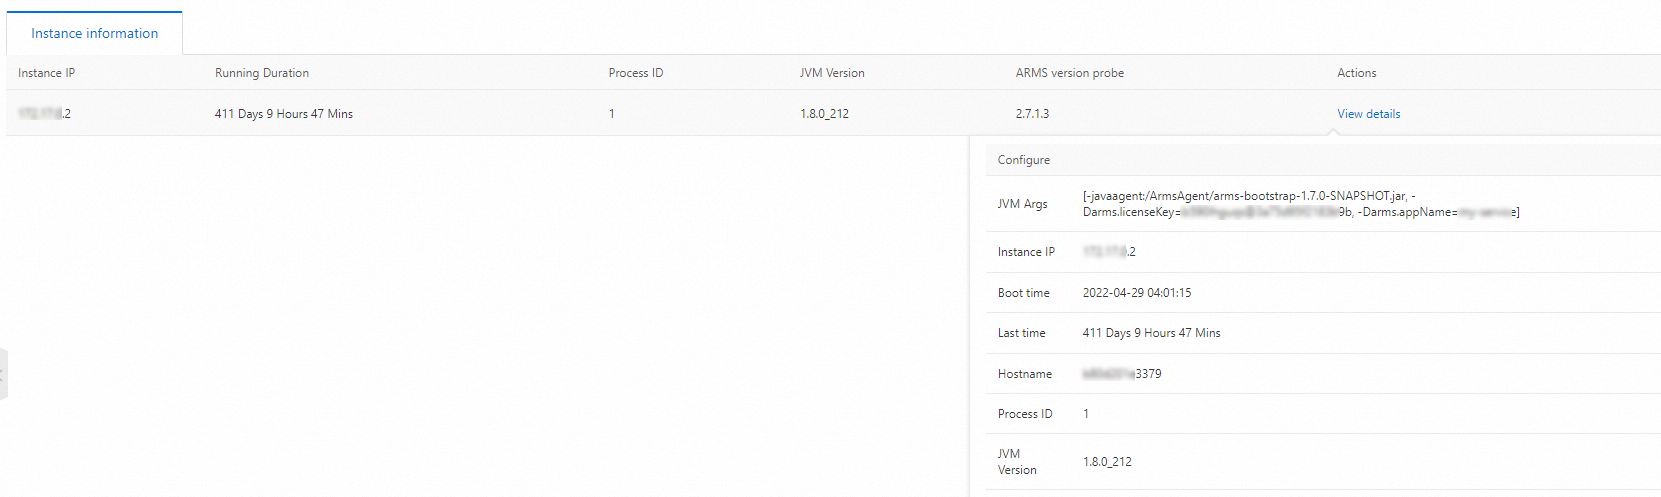
In the left-side navigation pane, click JVM Configuration. The page lists all JVM instances for the selected application.
In the Actions column, click View details for the target instance. The details panel displays the following fields:
Field Description JVM Arguments Startup flags and system properties passed to the JVM. Instance IP address IP address of the host running this JVM instance. Boot time Timestamp when the JVM process started. Last time Timestamp of the most recent data report from this instance. Hostname Name of the host machine. Process ID Operating-system process ID (PID) of the JVM process. JVM version Java runtime version.