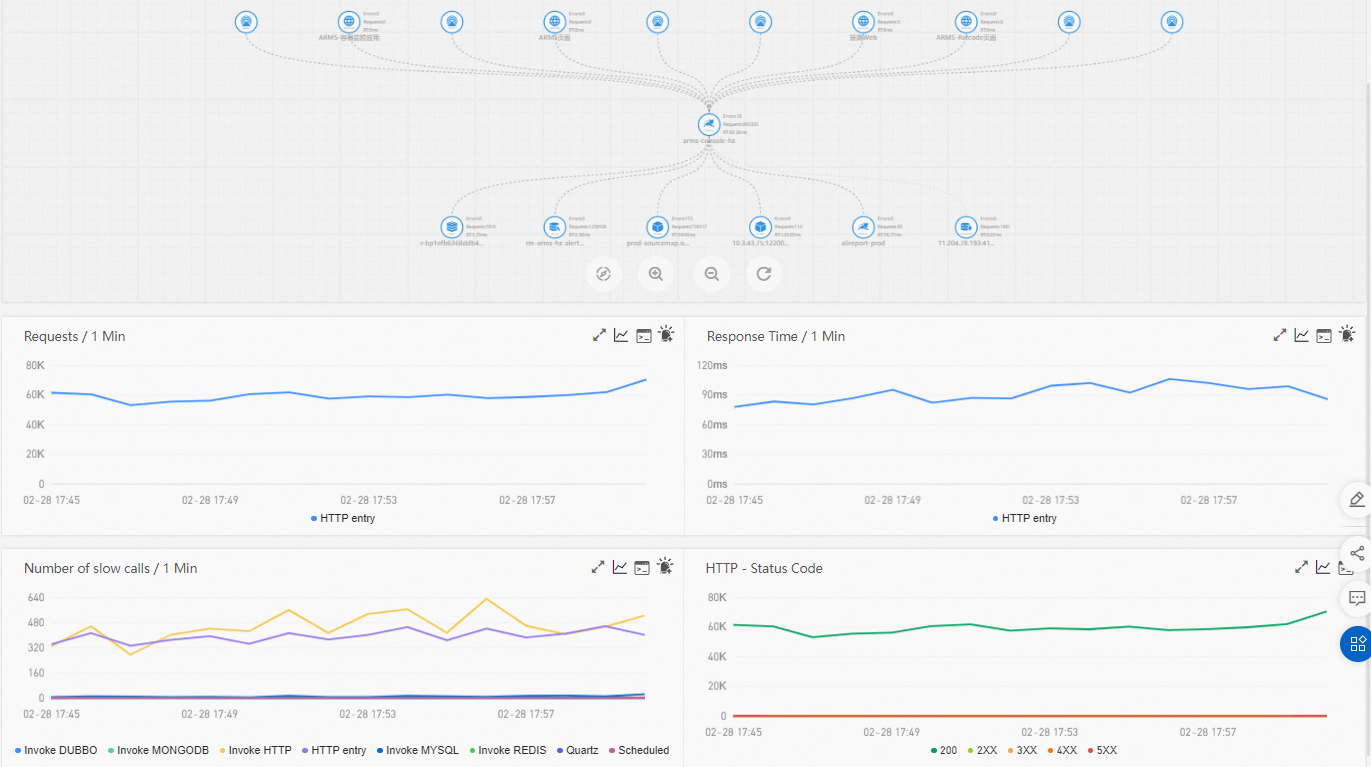
This topic shows you how to obtain an overview of an application. On the Overview tab of the application, you can view the application topology, number of requests, response time, number of slow calls, and HTTP status codes.
Prerequisites
The Application Real-Time Monitoring Service (ARMS) agent is installed for an application. For more information, see Overview.Procedure
- Log on to the ARMS console. In the left-side navigation pane, choose .
- On the Applications page, select a region in the top navigation bar and click the name of the application that you want to manage. Note If the
 icon is displayed in the Language column, the application is connected to Application Monitoring. If a hyphen (-) is displayed, the application is connected to Tracing Analysis.
 - In the left-side navigation pane, click Application Details.
- On the Application Details page, select an instance where the application is deployed and set the time period. The Overview tab appears by default.

Application topology
The application topology section displays the topology of call relationships between internal services of the application in the specified time period.
- Click the plus icon or scroll the mouse wheel up to zoom in the topology.
- Click the minus icon or scroll the mouse wheel down to zoom out the topology.
- Click the Refresh icon to restore the application topology to the default size.
Number of requests
The Requests section displays the time series curve that indicates the number of requests of the application in the specified time period.
- Move the pointer over a chart and view the detailed statistics.
- Use the cursor to select a time period to view the statistics of the specified time period.
- Click the
 icon to view the statistics of the metric in a certain time period or compare the statistics of the metric in the same time period on different dates.
 - Click the
 icon to view the API details of the metric.
 - Click the
 icon to create an alarm for this metric. For more information, see Create and manage an alert rule in Application Monitoring (new).
Response time
The Response Time section displays the time series curve that indicates the response time of the application in the specified time period.
- Move the pointer over a chart and view the detailed statistics.
- Use the cursor to select a time period to view the statistics of the specified time period.
- Click a spike in the curve to perform in-depth analysis. Note Only the Expert Edition supports this feature.
- Click the
 icon to view the statistics of the metric in a certain time period or compare the statistics of the metric in the same time period on different dates.
 - Click the
 icon to view the API details of the metric.
 - Click the
 icon to create an alarm for this metric. For more information, see Create and manage an alert rule in Application Monitoring (new).
Number of slow calls
The Number of slow calls section displays the time series curve that indicates the number of slow calls of the application in the specified time period.
- Move the pointer over a chart and view the detailed statistics.
- Use the cursor to select a time period to view the statistics of the specified time period.
- Click the legend to hide or show the data.
- Click the
 icon to view the statistics of the metric in a certain time period or compare the statistics of the metric in the same time period on different dates.
 - Click the
 icon to view the API details of the metric.
 - Click the
 icon to create an alarm for this metric. For more information, see Create and manage an alert rule in Application Monitoring (new).
HTTP status code
The HTTP - Status Code section displays the time series curve that indicates the HTTP status code statistics of the application in the specified time period.
- Move the pointer over a chart and view the detailed statistics.
- Use the cursor to select a time period to view the statistics of the specified time period.
- Click the legend to hide or show the data.
- Click the
 icon to view the statistics of the metric in a certain time period or compare the statistics of the metric in the same time period on different dates.
 - Click the
 icon to view the API details of the metric.