Application Monitoring of Application Real-Time Monitoring Service (ARMS) provides an exception analysis feature. This feature records uncaught Java exceptions—those escaping try-catch blocks, regardless of how often they occur, or whether they are thrown by code or returned by runtime failures, enabling targeted code fixes.
Scenarios
ARMS records exceptions only if they propagate outside try-catch blocks. Assume the ARMS agent has instrumented public void methodA and public void methodB, which call each other:
Scenario 1: Both methods catch exceptions.
public int methodA() { try { return methodB(); } catch (Throwable e) { e.printStackTrace(); return 0; } } public int methodB() { try { return 1 / 0; } catch (Throwable e) { e.printStackTrace(); return 0; } }Result: ARMS records no exceptions because they are caught and handled within the
try-catchblocks.Scenario 2: methodA catches an exception, whereas methodB returns one.
public int methodA() { try { return methodB(); } catch (Throwable e) { e.printStackTrace(); return 0; } } public int methodB() { return 1 / 0; }Result: ARMS records one
java.lang.ArithmeticExceptionexception (uncaught inmethodB).Scenario 3: Both methods return exceptions.
    public int methodA() {
        return methodB();
    }

    public int methodB() {
        return 1 / 0;
    }
Result: ARMS records two
java.lang.ArithmeticExceptionexceptions.Scenario 4: methodA catches methodB’s exception and rethrows it as RuntimeException.
    public static int methodA() {
        try {
            return methodB();
        } catch (Throwable e) {
            throw new RuntimeException(e);
        }
    }

    public static int methodB() {
        return 1 / 0;
    }
Result: ARMS records one
java.lang.ArithmeticExceptionexception (uncaught inmethodB) and onejava.lang.RuntimeExceptionexception (thrown bymethodA).
Prerequisite
Your application is monitored by Application Monitoring.
Procedure
Log on to the ARMS console. In the left-side navigation pane, choose .
Select a region in the top navigation bar and click an application.
NoteIcons in the Language column indicate the application's programming language:
 : Java
 : Go
: Go : Python
- (Hyphen): an application monitored in Managed Service for OpenTelemetry
In the left-side navigation pane, click Application Details.
Select an instance, set the time period in the upper-right corner, and click the Exception Analysis tab.
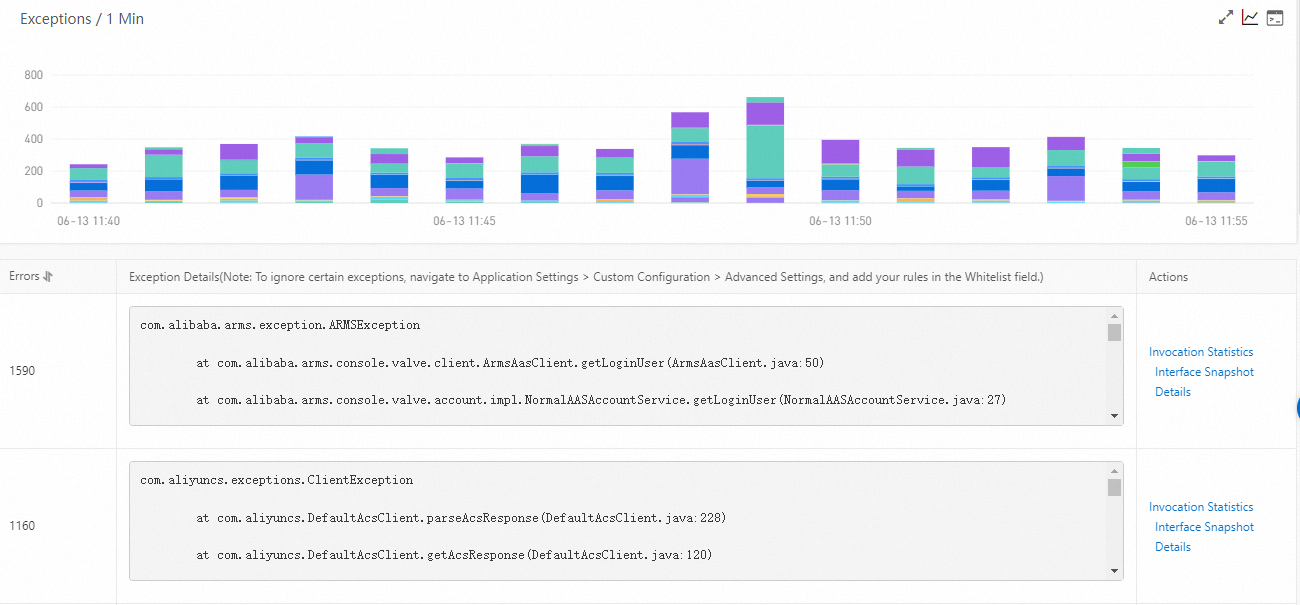
Stacked chart
The Exceptions section displays a stacked chart of exceptions that occurred in the application in the specified time period.
Here, you can:
Move the pointer over a chart and view the statistics.
Drag the bars horizontally to view the statistics of specified time periods.
Click the
 icon to view metric statistics during a selected time period or compare performance within the same period across different days.
Click the
 icon to view the API details of the metric.
Exception list
Displays all exceptions that occurred in the application in the specified time period.
In the Actions column, you can:
Click Invocation Statistics to view the stacked chart of an exception.
Click Interface Snapshot to view the traces of an abnormal operation.
Click Details to view exception details.
To filter exceptions, specify the Whitelist field in the Advanced Settings section on the Custom Configuration tab of the Application Settings page.