By Peng Li and Hang Yin
Combining Knative with AI brings significant advantages, including rapid deployment, high flexibility, and cost-effectiveness, particularly for AI applications that require frequent adjustments in computing resources, such as model inference. Therefore, when deploying AI model inference in Knative, you can follow these best practices to enhance service capabilities and optimize GPU resource utilization.

To ensure rapid scaling of AI model inference services deployed with Knative Serving, it's recommended to avoid packaging AI models in container images. This is because AI models significantly increase the size of containers, slowing down deployments. Additionally, if the model is packaged in the container, updating the model requires building a new container image, making versioning more complicated.
To prevent these issues, you should load the AI model data onto external storage media such as Object Storage Service (OSS) or Network Attached Storage (NAS), and mount it to a Knative pod using Persistent Volume Claims (PVC). Furthermore, you can accelerate the AI model loading process using Fluid, a distributed dataset orchestration and acceleration engine (see Use JindoFS to accelerate access to OSS and Use EFC to accelerate access to NAS file systems). This enables the rapid loading of large models in seconds.
For example, when storing AI models in OSS, you can declare the dataset in OSS using Dataset and execute caching tasks with JindoRuntime (which requires installing the ack-fluid component in the cluster).
apiVersion: v1
kind: Secret
metadata:
  name: access-key
stringData:
  fs.oss.accessKeyId: your_ak_id # Use the AccessKey ID for accessing OSS.
  fs.oss.accessKeySecret: your_ak_skrt # Use the AccessKey secret for accessing OSS.
---
apiVersion: data.fluid.io/v1alpha1
kind: Dataset
metadata:
  name: oss-data
spec:
  mounts:
  - mountPoint: "oss://{Bucket}/{path-to-model}" # Use the name of the OSS bucket in which the model resides and the storage path of the model.
    name: xxx
    path: "{path-to-model}" # Use the storage path of the model as used by the program.
    options:
      fs.oss.endpoint: "oss-cn-beijing.aliyuncs.com"  # Use the actual OSS endpoint.
    encryptOptions:
      - name: fs.oss.accessKeyId
        valueFrom:
          secretKeyRef:
            name: access-key
            key: fs.oss.accessKeyId
      - name: fs.oss.accessKeySecret
        valueFrom:
          secretKeyRef:
            name: access-key
            key: fs.oss.accessKeySecret
  accessModes:
    - ReadOnlyMany
---
apiVersion: data.fluid.io/v1alpha1
kind: JindoRuntime
metadata:
  name: oss-data
spec:
  replicas: 2
  tieredstore:
    levels:
      - mediumtype: SSD
        volumeType: emptyDir
        path: /mnt/ssd0/cache
        quota: 100Gi
        high: "0.95"
        low: "0.7"
  fuse:
    properties:
      fs.jindofsx.data.cache.enable: "true"
    args:
      - -okernel_cache
      - -oro
      - -oattr_timeout=7200
      - -oentry_timeout=7200
      - -ometrics_port=9089
    cleanPolicy: OnDemand
After you declare Dataset and JindoRuntime, a PVC with the same name is automatically created. You can add the PVC to the Knative service for acceleration.
apiVersion: serving.knative.dev/v1
kind: Service
metadata:
  name: sd-backend
spec:
  template:
    spec:
      containers:
        - image: <your-image>
          name: image-name
          ports:
            - containerPort: xxx
              protocol: TCP
          volumeMounts:
            - mountPath: /data/models # Replace mountPath with the path where the program loads the model.
              name: data-volume
      volumes:
        - name: data-volume
          persistentVolumeClaim:
            claimName: oss-data # Mount the PVC with the same name as the Dataset.
In addition to the AI model, you must also consider the impact of the container size on the Knative service. Service containers that run AI models often need to package a series of dependencies such as CUDA and PyTorch-GPU, which significantly increases the container size. When you deploy the Knative AI model inference service in an ECI pod, we recommend that you use image caches to accelerate the image pulling process. Image caches can cache images for ECI pods in advance. This allows you to pull images within seconds. For more information, see Use image caches to accelerate the creation of pods.
apiVersion: eci.alibabacloud.com/v1
kind: ImageCache
metadata:
  name: imagecache-ai-model
  annotations:
    k8s.aliyun.com/eci-image-cache: "true" # Enable the reuse of image caches.
spec:
  images:
  - <your-image>
  imageCacheSize:
    25 # The size of the image cache. Unit: GiB.
  retentionDays:
7 # The cache retention period.The container should initiate a graceful shutdown upon receiving a SIGTERM signal to ensure that ongoing requests do not terminate abruptly.
• The application is set to a non-ready state if it uses HTTP probes after receiving a SIGTERM signal. This prevents new requests from being routed to the container that is being shut down.
• During shutdown, the queue-proxy of Knative may still be routing requests to the container. To ensure that all requests are completed before the container terminates, the value of the timeoutSeconds parameter should be 1.2 times the expected maximum response time for processing requests.
For example, if the maximum response time takes 5 seconds, we recommend that you set the timeoutSeconds parameter to 6:
apiVersion: serving.knative.dev/v1
kind: Service
metadata:
  name: helloworld-go
  namespace: default
spec:
  template:
    spec:
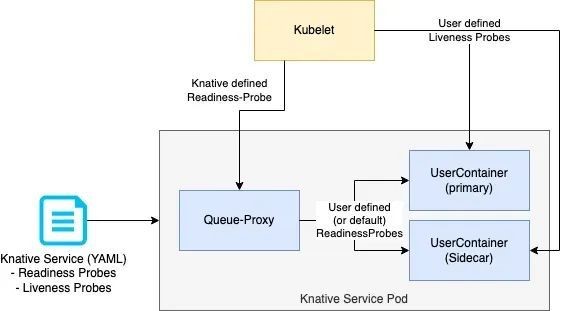
timeoutSeconds: 6Liveness and readiness probes play a vital role in maintaining the health and availability of Knative services. Note that Knative probing is different from Kubernetes probing. One reason is that Knative tries to minimize the cold start time, and thus is probing in a vastly higher interval compared to Kubernetes.

• Users can optionally define readiness and/or liveness probes in Knative Service CR.
• Liveness probes are directly executed by Kubelet against the according container.
• Readiness probes are rewritten by Knative to be executed by the Queue-Proxy container.
• Knative performs probing from specific places (such as Activator Queue-Proxy), to make sure the whole network stack is configured and ready. Compared with Kubernetes, Knative uses a shorter (called aggressive probing) probing interval to shorten the cold start time when a pod is already up and running.
• Knative will define a default readiness probe for the primary container when no probe is defined by the user. It will check for a TCP socket on the traffic port of the Knative service.
• Knative also defines a readiness probe for the Queue-Proxy container itself. Once the Queue-Proxy probe returns a successful response, Knative considers the pod healthy and ready to serve traffic.
A liveness probe is used to inspect the health of a container. If the container fails or gets stuck, the liveness probe will restart it.
Readiness probes are important for auto scaling.
• The TCP probe should not start the listening port until all components are loaded and the container is fully ready.
• The HTTP probe should not mark the service as ready until the endpoint is able to process the request.
• When adjusting the probe interval by using the periodSeconds parameter, keep the interval short. Ideally, the interval is less than the default value of 10 seconds.
apiVersion: serving.knative.dev/v1
kind: Service
metadata:
  name: runtime
  namespace: default
spec:
  template:
    spec:
      containers:
      - name: first-container
        image: <your-image>
        ports:
          - containerPort: 8080
        readinessProbe:
          httpGet:
            port: 8080 # you can also check on a different port than the containerPort (traffic-port)
            path: "/health"
        livenessProbe:
          tcpSocket:
            port: 8080
Auto scaling based on requests is a key capability in Knative. The default auto scaling metric is concurrency. We recommend that you use this metric for GPU-based services.
apiVersion: serving.knative.dev/v1
kind: Service
metadata:
  name: helloworld
spec:
  template:
    metadata:
      annotations:
        autoscaling.knative.dev/metric: "concurrency"
Before making any adjustments to the autoscaler, first define the optimization goal, such as reducing latency, minimizing costs, or accommodating spiky traffic patterns. Then, measure the time it takes for pods to start in the expected scenarios. For example, deploying a single pod may have different variance and mean startup times than deploying multiple pods simultaneously. These metrics provide the baseline for auto scaling configuration.
The autoscaler has two modes, stable and panic, with separate windows for each mode. The stable mode is used for general operations, while the panic mode has a much shorter window by default, which ensures that pods can be quickly scaled up if a burst of traffic arrives.
In general, to maintain a steady scaling behavior, the stable window should be longer than the average pod startup time and twice the average time is a good starting point.
apiVersion: serving.knative.dev/v1
kind: Service
metadata:
  name: helloworld
spec:
  template:
    metadata:
      annotations:
autoscaling.knative.dev/window: "50s"The panic window is a percentage of the stable window. Its primary function is to manage sudden, unexpected spikes in traffic. However, setting this parameter requires caution, as it can easily lead to over-scaling, particularly when pod startup times are long.
• For example, if the stable window is set to 30 seconds and the panic window is configured at 10%, the system will use 3 seconds of data to determine whether to enter the panic scaling mode. If pods typically take 30 seconds to start, the system may continue to scale up while new pods are still coming online, potentially leading to over-scaling.
• Do not fine-tune the panic window until other parameters have been adjusted and the scaling behavior is stable. This is especially important when considering a panic window value shorter than or equal to the pod startup time. If the stable window is twice the average pod startup time, start with a panic window value of 50% to balance both regular and spiky traffic patterns.
apiVersion: serving.knative.dev/v1
kind: Service
metadata:
  name: helloworld
  namespace: default
spec:
  template:
    metadata:
      annotations:
        autoscaling.knative.dev/panic-window-percentage: "10.0"
The panic mode threshold is the ratio of incoming traffic to the target capacity. This value is adjusted based on the peak traffic and the acceptable latency level. The initial value is 200% or higher until the scaling behavior is stable. After the service runs for a period of time, you can consider further adjustments.
apiVersion: serving.knative.dev/v1
kind: Service
metadata:
  name: helloworld
  namespace: default
spec:
  template:
    metadata:
      annotations:
autoscaling.knative.dev/panic-threshold-percentage: "200.0"Scale-up and scale-down rates determine how quickly a service scales in response to traffic patterns. Although these rates are usually well-configured by default, they may need to be adjusted in specific scenarios. You need to monitor the current behavior before adjusting either rate. Any changes to these rates should first be tested in a staging environment. If you encounter scaling issues, check other scaling parameters, such as the stable window and panic window, because they often interact with scale-up and scale-down rates.
The scale-up rate usually does not need to be modified unless a specific problem is encountered. For example, if you want to scale up multiple pods at the same time, the startup time may increase (due to resource preparation or other issues). In this case, you may need to adjust the scale-up rate. If over-scaling is detected, other parameters, such as the stable window or the panic window, may also need to be adjusted.
apiVersion: v1
kind: ConfigMap
metadata:
 name: config-autoscaler
 namespace: knative-serving
data:
max-scale-up-rate: "500.0"The scale-down rate should initially be set to the average pod startup time or longer. The default value is usually sufficient for most use cases. But if cost optimization is a priority, consider increasing the rate to scale down faster after a traffic spike. If a service is experiencing traffic spikes and the goal is to reduce costs, consider a faster scale-down setting.
The scale-down rate is a multiplier. For example, a value of N/2 will allow the system to scale down the number of pods to half the current number at the end of a scaling cycle. For services with a small number of pods, a lower scale-down rate helps maintain a smoother pod count and reduces frequent scaling. This improves system stability.
apiVersion: v1
kind: ConfigMap
metadata:
 name: config-autoscaler
 namespace: knative-serving
data:
max-scale-down-rate: "4.0"These parameters are highly correlated with the service size and available resources.
autoscaling.knative.dev/min-scale specifies the minimum number of replicas that each revision must have. Knative will attempt to maintain no less than this number of replicas. For services that are rarely used and cannot scale to zero, a value of 1 guarantees that the capacity is always available. For services that expect a lot of burst traffic, this parameter must be set to a value higher than 1.
apiVersion: serving.knative.dev/v1
kind: Service
metadata:
  name: helloworld
  namespace: default
spec:
  template:
    metadata:
      annotations:
autoscaling.knative.dev/min-scale: "1"The setting of autoscaling.knative.dev/max-scale cannot exceed available resources. This parameter is used to limit the maximum resource cost.
apiVersion: serving.knative.dev/v1
kind: Service
metadata:
  name: helloworld
  namespace: default
spec:
  template:
    metadata:
      annotations:
autoscaling.knative.dev/max-scale: "3"Configure the initial number of pods so that the new revision can fully handle the existing traffic. A good starting point is 1.2 times the number of existing pods.
apiVersion: serving.knative.dev/v1
kind: Service
metadata:
  name: helloworld-go
  namespace: default
spec:
  template:
    metadata:
      annotations:
autoscaling.knative.dev/initial-scale: "5"One of the standout features of Knative is its ability to scale services down to zero when they are not in use.
This is especially useful for users who manage multiple models. Instead of implementing complex logic in a single service, we recommend deploying individual Knative services for each model.
• With Knative's scale-to-zero feature, maintaining a model that has not been accessed for a while incurs no additional costs.
• When a client accesses a model for the first time, Knative can scale from zero.
Proper concurrency configuration is essential for optimizing Knative Serving. These parameters have a significant impact on application performance.
containerConcurrency specifies the hard concurrency limit, such as the maximum number of concurrent requests that a single container instance can handle.
You need to accurately evaluate the maximum number of requests that a container can handle simultaneously without degrading performance. For GPU-intensive tasks, set containerConcurrency to 1 if you are uncertain about their concurrency capabilities.
apiVersion: serving.knative.dev/v1
kind: Service
metadata:
  name: helloworld
spec:
  template:
    spec:
containerConcurrency: 1autoscaling.knative.dev/target specifies the soft concurrency target, such as the number of concurrent requests required for each container.
In most cases, the target value must match the containerConcurrency value. This makes the configuration easier to understand and manage. For GPU-intensive tasks with containerConcurrency set to 1, target must also be set to 1.
apiVersion: serving.knative.dev/v1
kind: Service
metadata:
  name: helloworld
spec:
  template:
    metadata:
      annotations:
        autoscaling.knative.dev/target: 1
A soft limit is a targeted limit, rather than a strictly enforced bound. In some scenarios, particularly if a burst of requests occurs, the value may be exceeded.
A hard limit is a strictly enforced upper bound. If the concurrency reaches the hard limit, surplus requests are buffered and must wait until enough free capacity is available to execute the requests.
Using a hard limit configuration is recommended only if there is a clear use case for it with your application. Having a low, hard limit specified may have a negative impact on the throughput and latency of an application, and might cause cold starts.
As a best practice, adjust the target utilization rather than modifying the target. This provides a more intuitive way to manage concurrency levels.
Adjust autoscaling.knative.dev/target-utilization-percentage as close to 100% as possible to achieve optimal concurrency performance.
• A good starting point is between 90% and 95%. However, experimental testing may be required to optimize this value.
• A lower percentage (< 100%) increases the amount of time that pods have to wait to reach their concurrency limit. But this provides extra capacity to handle traffic spikes.
• If the pod startup time is short, use a higher percentage. Otherwise, adjust the target to find a balance between elastic latency and concurrent processing.
apiVersion: serving.knative.dev/v1
kind: Service
metadata:
  name: helloworld
spec:
  template:
    metadata:
      annotations:
autoscaling.knative.dev/target-utilization-percentage: "90"Knative can ensure service continuity during new version releases. When new code is deployed or changes are made to the service, Knative keeps the earlier version running until the new version is ready.
• This readiness is determined by a configurable traffic percentage threshold. The traffic percentage is a key parameter. It determines the time when Knative switches traffic from the earlier version to the new version. The percentage may be as low as 10% or as high as 100%.
• It is especially important to control the scale-down speed of earlier versions when operating at a large scale with limited pod availability. If a service is running on 500 pods and only 300 extra pods are available, an aggressive traffic percentage may cause the service to be partially unavailable.
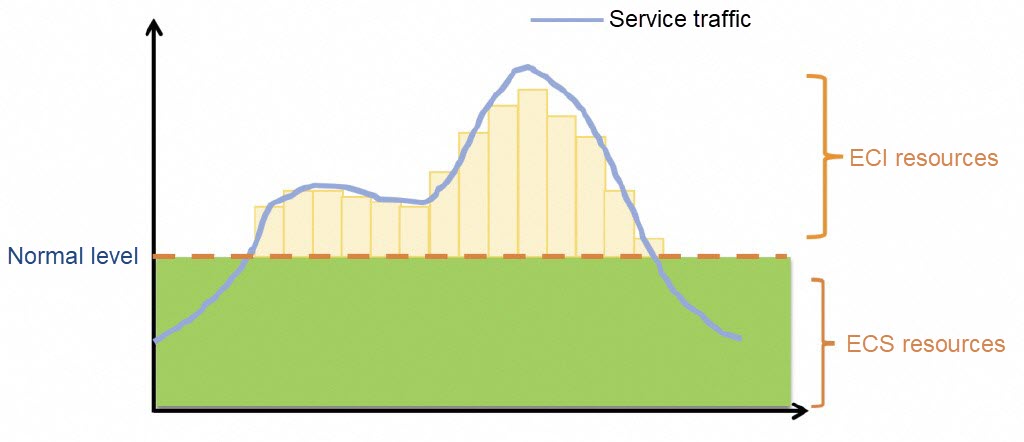
You can configure ResourcePolicy so that ECS resources are used in normal conditions and ECIs are used in the event of burst traffic.

apiVersion: scheduling.alibabacloud.com/v1alpha1
kind: ResourcePolicy
metadata:
  name: xxx
  namespace: xxx
spec:
  selector:
    serving.knative.dev/service: helloworld-go ## Specify the Knative Service name.
  strategy: prefer
  units:
  - resource: ecs
    max: 10
    nodeSelector:
      key2: value2
  - resource: ecs
    nodeSelector:
      key3: value3
  - resource: eci
Knative prioritizes ECS instances for scale-up. When the maximum number of pods is exceeded or ECS resources are insufficient, ECIs are used to create pods.
During the scale-down process, pods on ECIs are preferably deleted.
Empowered by the GPU sharing feature of Container Service for Kubernetes (ACK), Knative Services can make full use of the GPU memory isolation capability of cGPU to improve GPU resource utilization.
To share GPUs in Knative, you need only to set limits by specifying the aliyun.com/gpu-mem parameter for the Knative Service.
Example:
apiVersion: serving.knative.dev/v1
kind: Service
metadata:
  name: helloworld-go
  namespace: default
spec:
  template:
    spec:
      containerConcurrency: 1
      containers:
      - image: registry-vpc.cn-hangzhou.aliyuncs.com/demo-test/test:helloworld-go
        name: user-container
        ports:
        - containerPort: 6666
          name: http1
          protocol: TCP
        resources:
          limits:
aliyun.com/gpu-mem: "3"In queue-proxy container logs, you can check whether the request is successful. In case of failure, you can locate the cause. To enable queue-proxy container logs, use the following method:
apiVersion: v1
kind: ConfigMap
metadata:
  name: config-observability
  namespace: knative-serving
data:
  logging.enable-request-log: "true"
  logging.request-log-template: '{"httpRequest": {"requestMethod": "{{.Request.Method}}", "requestUrl": "{{js .Request.RequestURI}}", "requestSize": "{{.Request.ContentLength}}", "status": {{.Response.Code}}, "responseSize": "{{.Response.Size}}", "userAgent": "{{js .Request.UserAgent}}", "remoteIp": "{{js .Request.RemoteAddr}}", "serverIp": "{{.Revision.PodIP}}", "referer": "{{js .Request.Referer}}", "latency": "{{.Response.Latency}}s", "revisionName": "{{.Revision.Name}}", "protocol": "{{.Request.Proto}}"}, "traceId": "{{index .Request.Header "X-B3-Traceid"}}"}'
Log example:
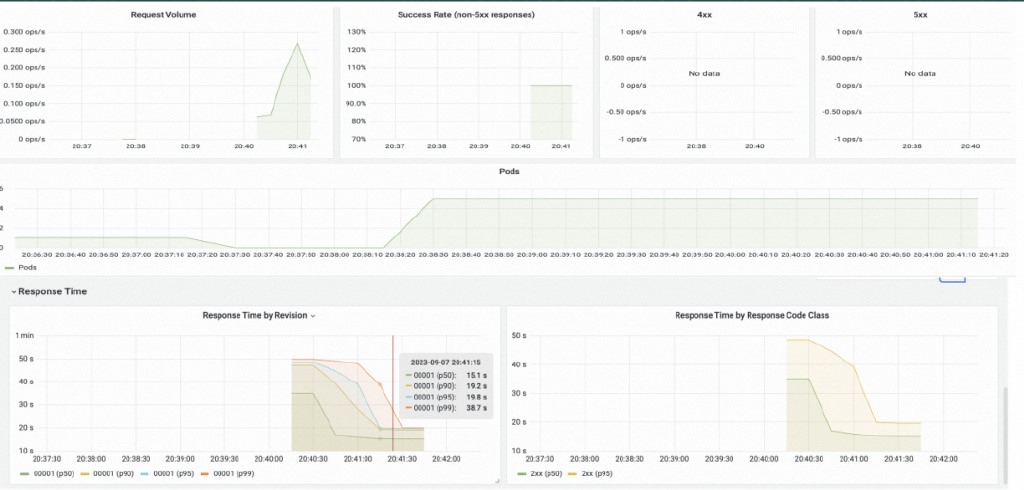
{"httpRequest": {"requestMethod": "GET", "requestUrl": "/fr", "requestSize": "0", "status": 502, "responseSize": "17", "userAgent": "Mozilla/5.0 (Macintosh; Intel Mac OS X 10_15_7) AppleWebKit/537.36 (KHTML, like Gecko) Chrome/124.0.0.0 Safari/537.36", "remoteIp": "10.111.162.1:40502", "serverIp": "10.111.172.168", "referer": "", "latency": "9.998150996s", "revisionName": "demo-00003", "protocol": "HTTP/1.1"}, "traceId": "[]"}Knative provides out-of-the-box Prometheus dashboards. You can view the number of requests, request success rate, pod scaling trend, RT response latency, number of concurrent tasks, and resource utilization.

Based on this information, you can determine the optimal scaling metric configuration during the testing phase. For example, based on the acceptable RT response latency, you can determine the maximum number of concurrent tasks handled by a pod, and adjust the concurrency and scaling configuration for optimal performance.
The combination of serverless computing and AI brings many benefits, especially in scenarios in which high elasticity, fast iteration, and low cost are required. Knative, the most popular open source serverless application framework in the CNCF community, offers these capabilities.
Best Practices for Large Model Inference in ACK: TensorRT-LLM
Container Memory Observability: Exploring WorkingSet and PageCache Monitoring

228 posts | 33 followers
FollowAlibaba Container Service - May 14, 2025
Alibaba Container Service - August 30, 2024
Alibaba Container Service - July 22, 2024
Alibaba Cloud Native - September 11, 2023
Alibaba Cloud Native Community - September 19, 2023
Alibaba Container Service - May 27, 2025

228 posts | 33 followers
Follow Best Practices
Follow our step-by-step best practices guides to build your own business case.
Learn More ACK One
Provides a control plane to allow users to manage Kubernetes clusters that run based on different infrastructure resources
Learn More Container Service for Kubernetes
Alibaba Cloud Container Service for Kubernetes is a fully managed cloud container management service that supports native Kubernetes and integrates with other Alibaba Cloud products.
Learn More EasyDispatch for Field Service Management
Apply the latest Reinforcement Learning AI technology to your Field Service Management (FSM) to obtain real-time AI-informed decision support.
Learn MoreMore Posts by Alibaba Container Service