This topic describes how to generate candlestick charts for stocks by using TairSearch.
Background information
Candlestick charts are often used by traders and investors to perform technical analysis of stock price patterns and determine possible price movement. Additionally, candlesticks are a fundamental and core technical indicator of stocks. Multiple other indicators are derived from candlesticks. Each candlestick indicates the open, high, low, and close prices of a stock within a given time frame. Candlesticks are often generated by half an hour, day, week, month, or quarter.
Organizations in the securities sector typically receive near-real-time raw data about stock prices from stock exchanges. This data is then used to generate candlesticks, such as daily candlesticks and 5-minute candlesticks. Investors and traders have high requirements on the timeliness of data. This poses a big challenge for stock information suppliers to handle a large number of real-time computing and access requests.
TairSearch is an in-memory, full-text search data structure that integrates caching and computing for real-time data retrieval. This makes it an ideal choice for hot data caching and real-time computing to generate candlesticks. This topic provides an example on how to generate a 3-minute candlestick for a stock by using TairSearch.
For more information about TairSearch, see Search.
Example
Create a schema for a stock
In this example, a data record is produced every 3 seconds. You can run the TFT.CREATEINDEX command to create a schema with the stock code as its key. The schema contains the following fields: high, low, open, close, amount, volume, and date. The date field is specified as the index.
TFT.UPDATEINDEX command. Sample code:
TFT.CREATEINDEX 58Z074 '{
    "mappings": {
        "properties": {
            "high": {"index": false,"type": "double"},
            "low": {"index": false,"type": "double"},
            "open": {"index": false,"type": "double"},
            "close": {"index": false,"type": "double"},
            "volume": {"index": false,"type": "long"},
            "amount": {"index": false,"type": "long"},
            "date": {"index": true,"type": "long"}
        }
    }
}'
Expected output:
OKImport data about the stock
Write the data to a TairSearch document. Sample code:
TFT.ADDDOC 58Z074 '{
    "high": 1237.53,
    "low": 887.54,
    "open": 987.36,
    "close": 997.53,
    "volume": 110,
    "amount": 2809,
    "date": 1659922202
}'
Generate candlesticks in real time
Calculate the open, high, low, and close prices of the stock within the last 3 minutes to generate a 3-minute candlestick. Sample code:
Calculate the open price:
TFT.SEARCH 58Z074 '{
    "size": 1,
    "_source": {"includes": "open"},
    "sort": [{"date": {"order": "asc"}}],
    "query": {"range": {"date": {"gte": 1659922200,"lte": 1659922380}}}
}'
Calculate the close price:
TFT.SEARCH 58Z074 '{
    "size": 1,
    "_source": {"includes": "close"},
    "sort": [{"date": {"order": "desc"}}],
    "query": {"range": {"date": {"gte": 1659922200,"lte": 1659922380}}}
}'
Calculate the high and low prices:
TFT.SEARCH 58Z074 '{
    "size": 0,
    "query": {"range": {"date": {"gte": 1659922200,"lte": 1659922380}}},
    "aggs": {"high": {"max": {"field": "high"}},"low": {"min": {"field": "low"}}}
}'
Generate a candlestick chart for the stock
The following figure shows the candlestick chart generated by using the Pyecharts library.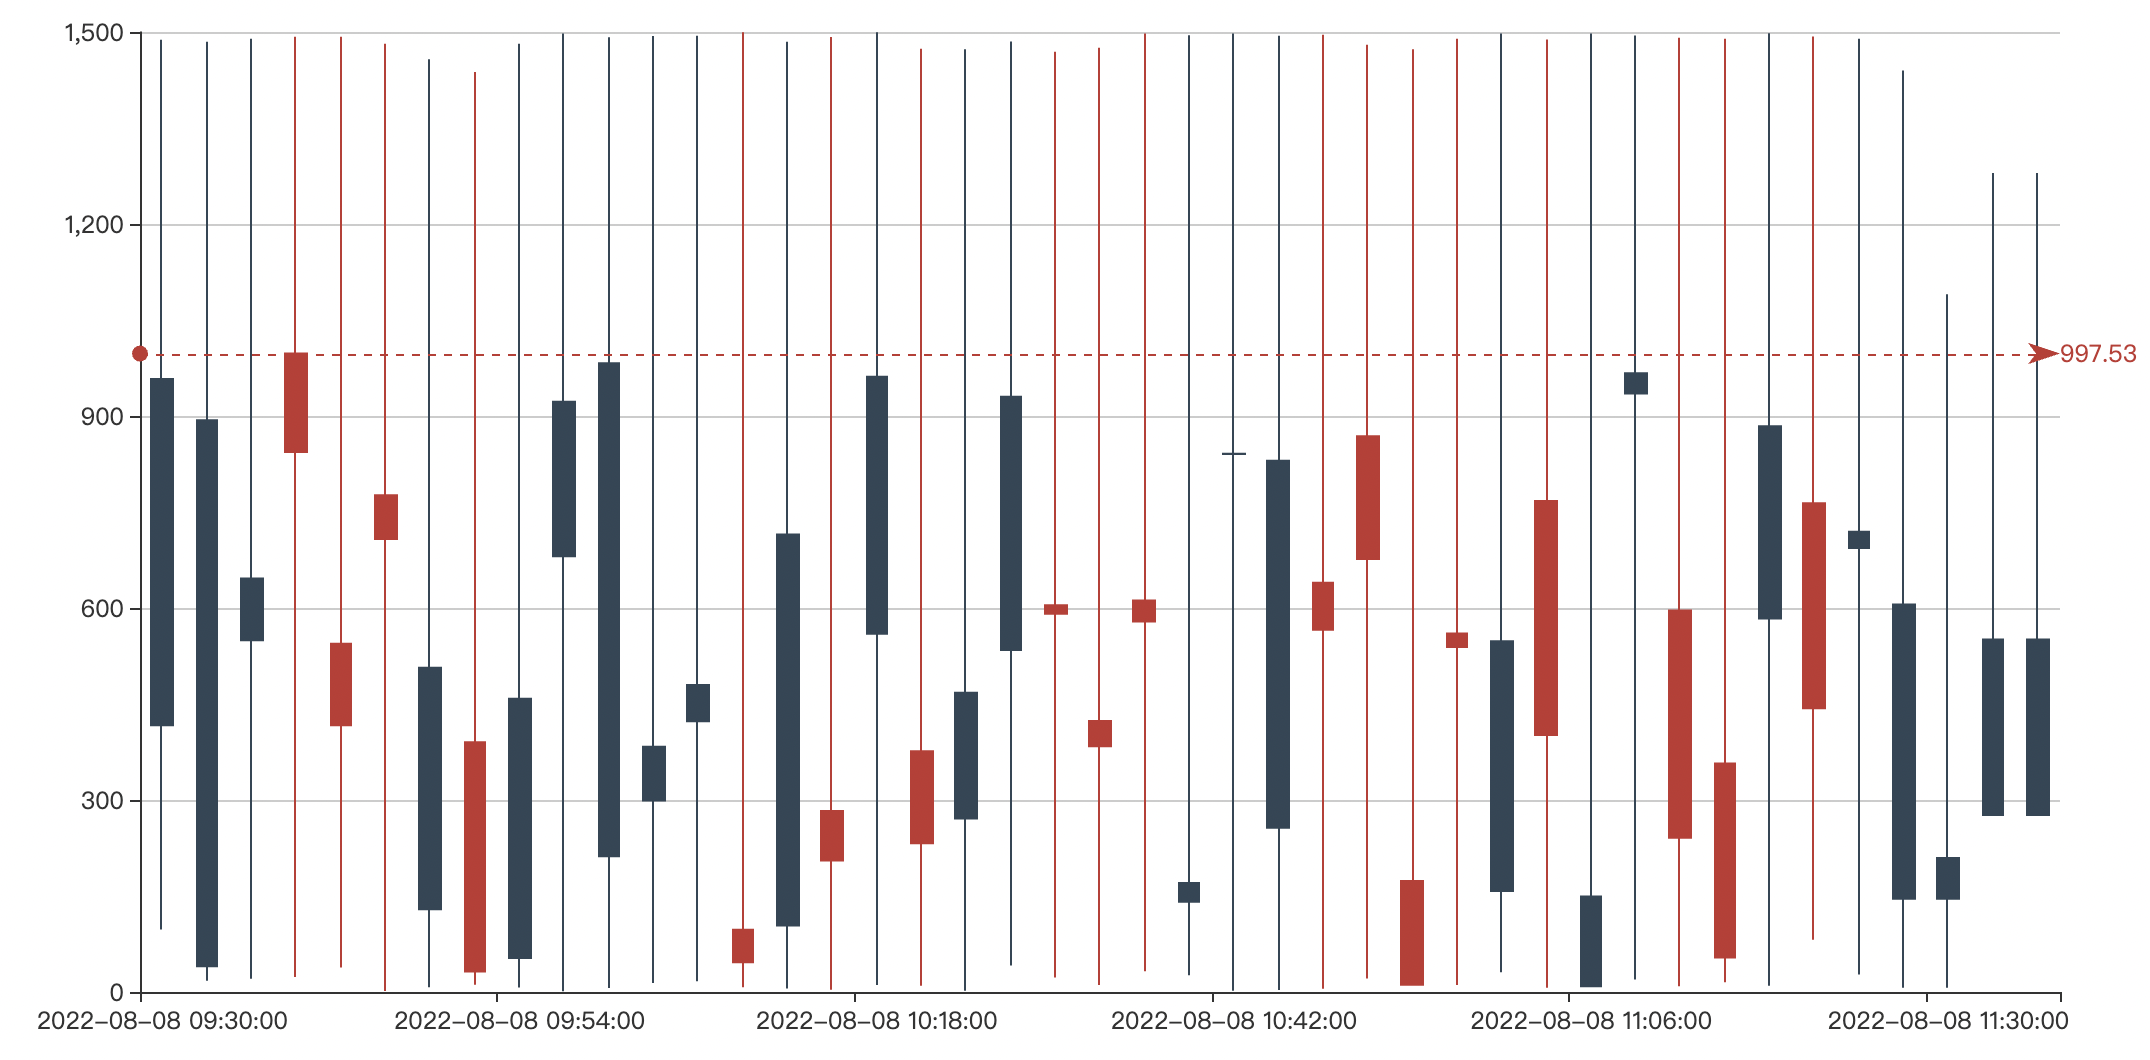
Performance data
The following section provides the performance data for calculating the preceding prices:
Open and close prices:
Command:
redis-benchmark -r 1 -n 100000 TFT.SEARCH 58Z074 '{"size": 1, "_source": {"includes": "open"}, "sort": [{"date": {"order": "asc"}}], "query": {"range": {"date": {"gte": 1659922200,"lte": 1659922380}}}}'Output:
100.00% <= 5 milliseconds
12078.75 requests per second
High and low prices:
Command:
redis-benchmark -r 1 -n 100000 TFT.SEARCH 58Z074 '{"size": 0,"query": {"range": {"date": {"gte": 1659922200,"lte": 1659922380}}},"aggs": {"high": {"max": {"field": "high"}},"low": {"min": {"field": "low"}}}}'Output:
100.00% <= 2 milliseconds
65019.51 requests per second