By Jinglei
You can use Kibana to query and visualize SLS data based on the SLS compatibility with Elasticsearch. If you migrate data from Elasticsearch to SLS, you can retain your Kibana usage habits. The following shows how to use Kibana to access SLS.

Here, the blue parts are the components that need to be deployed by the client.
• Kibana is used for visualization.
• Proxy is used to distinguish requests from Kibana and forward SLS-related requests to the ES-compatible API of SLS.
• Elasticsearch is used to store meta for Kibana.
Why is Elasticsearch needed here?
The reason is that the SLS Logstore does not support updates, and many types of metadata are not suitable for storage in SLS.
Kibana, on the other hand, requires a lot of metadata storage, such as chart configurations and Index Pattern configurations.
Therefore, you need to deploy a separate Elasticsearch instance that only stores Kibana metadata, which has very low resource usage.
Install docker and docker compose. The following steps also apply to podman compose.
mkdir sls-kibaba # Create a new directory
cd sls-kibaba # Enter
mkdir es_data # Create a directory to store Elasticsearch dataCreate a docker-compose.yml file in the sls-kibana directory.
The content is as follows: (The following mark indicates that you need to modify it according to your case.)
version: '3'
services:
  es:
    image: elasticsearch:7.17.3
    environment:
      - "discovery.type=single-node"
      - "ES_JAVA_OPTS=-Xms2G -Xmx2G"
      - ELASTIC_USERNAME=elastic
      - ELASTIC_PASSWORD=ES Password # You need to modify it
      - xpack.security.enabled=true
    volumes:
      - ./data:/usr/share/elasticsearch/data
    networks:
      - es717net

  kproxy:
    image: sls-registry.cn-hangzhou.cr.aliyuncs.com/kproxy/kproxy:1.9d
    depends_on:
      - es
    environment:
      - ES_ENDPOINT=es:9200
      - SLS_ENDPOINT=https://etl-dev.cn-huhehaote.log.aliyuncs.com/es/ # You need to modify it and the rule is https://${project}.${sls-endpoint}/es/
      - SLS_PROJECT=etl-dev # You need to modify it
      - SLS_ACCESS_KEY_ID=ALIYUN_ACCESS_KEY_ID # You need to modify it to ensure that you have permission to read the Logstore
      - SLS_ACCESS_KEY_SECRET=ALIYUN_ACCESS_KEY_SECRET # You need to modify it to a real accessKeySecret
    networks:
      - es717net

  kibana:
    image: kibana:7.17.3
    depends_on:
      - kproxy
    environment:
      - ELASTICSEARCH_HOSTS=http://kproxy:9201
      - ELASTICSEARCH_USERNAME=elastic
      - ELASTICSEARCH_PASSWORD=ES Password # You need to modify it (same as the Elasticsearch password set before)
      - XPACK_MONITORING_UI_CONTAINER_ELASTICSEARCH_ENABLED=true
    ports:
      - "5601:5601"
    networks:
      - es717net

networks:
  es717net:
    ipam:
      driver: default
Start the local Kibana service:
docker compose up -dCheck the docker compose startup status:
docker compose psAccess http://$(IP address where Kibaba is deployed}:5601 by browser, and enter the account and password to log on to Kibana.
Select Stack Management:
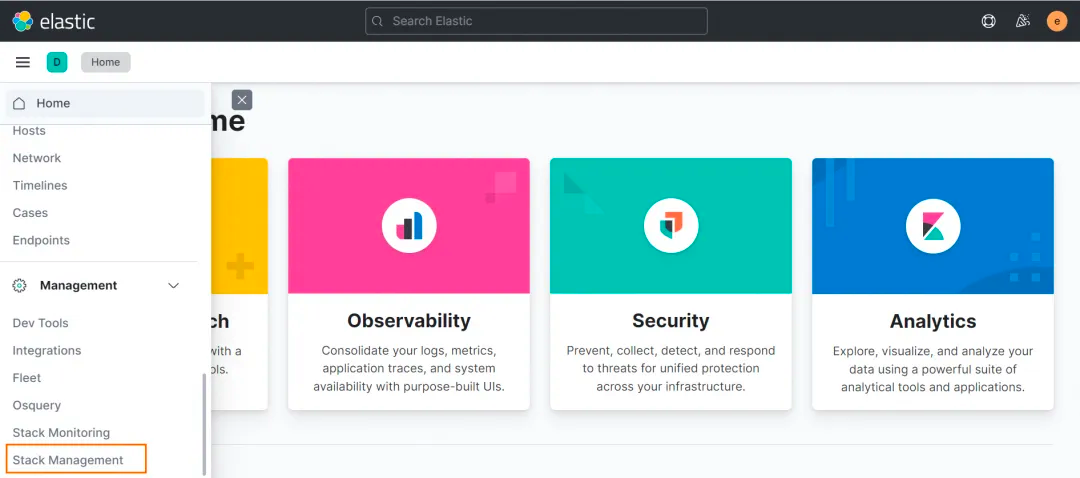
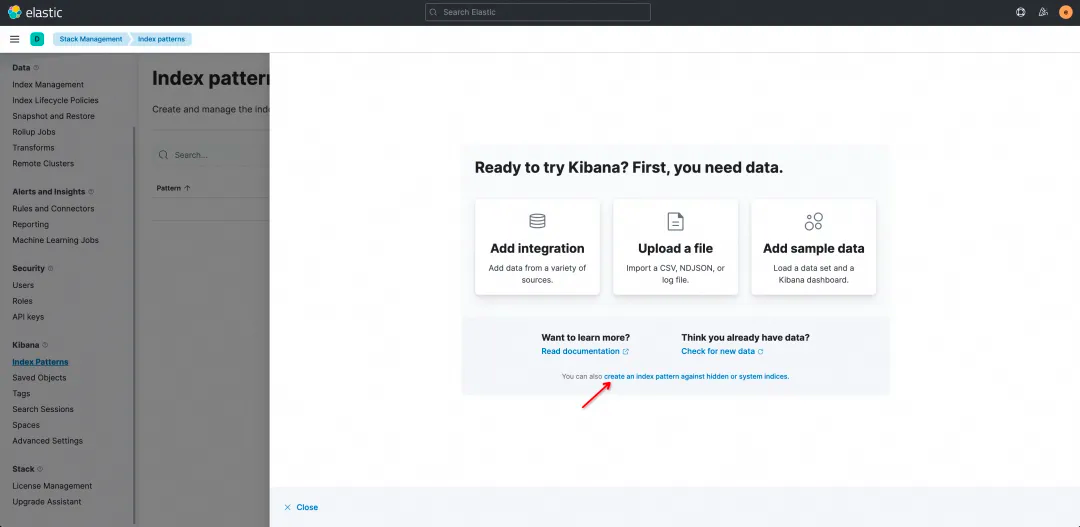
Click the Index Pattern Tab. Since it is normal if no data is displayed in the Index Pattern list, you must manually create a map from the SLS Logstore to the Index Patterns in Kibana. Click create an index pattern against hidden or system indices in the dialog box.
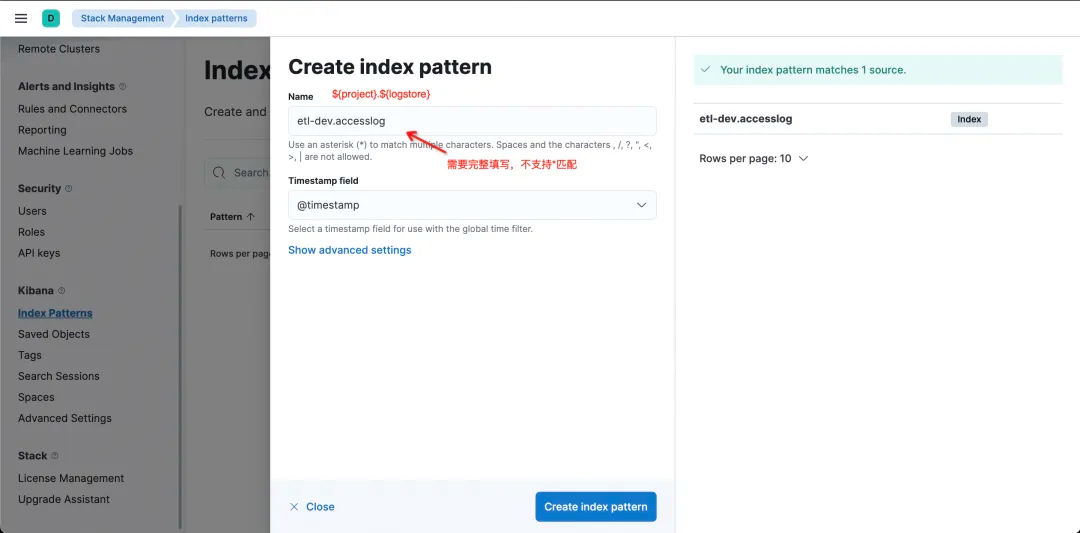
On the Create Index Pattern page, enter the Name in the format of ${project}.${logstore}. Note that the value must be specified in full and * matching is not supported.
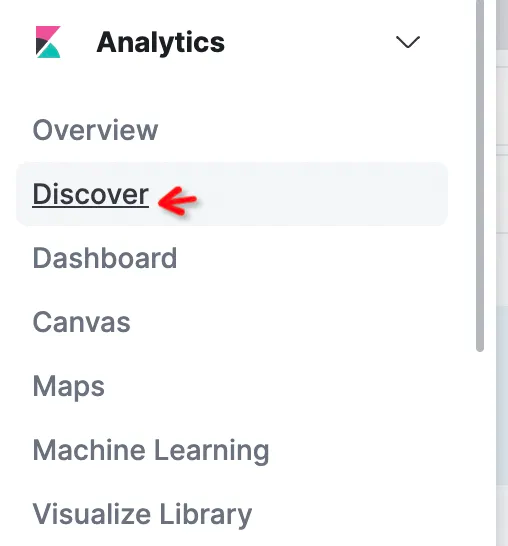
Click Create Index Pattern to complete Pattern creation, and then enter Discover to query data.
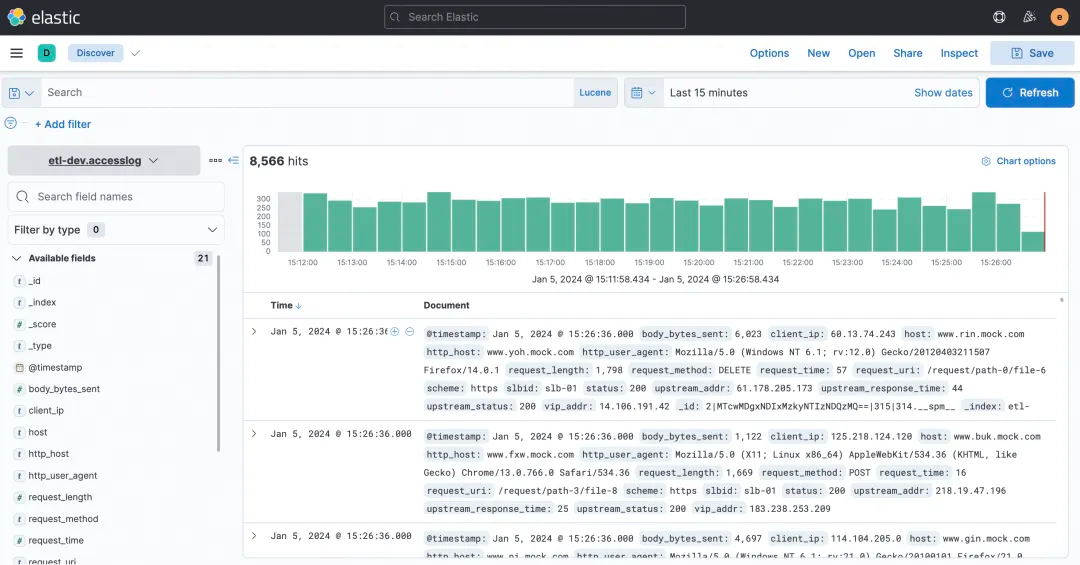
You can select KQL or Lucene in the query box of Kibana. All the ES-compatible APIs of SLS are supported.
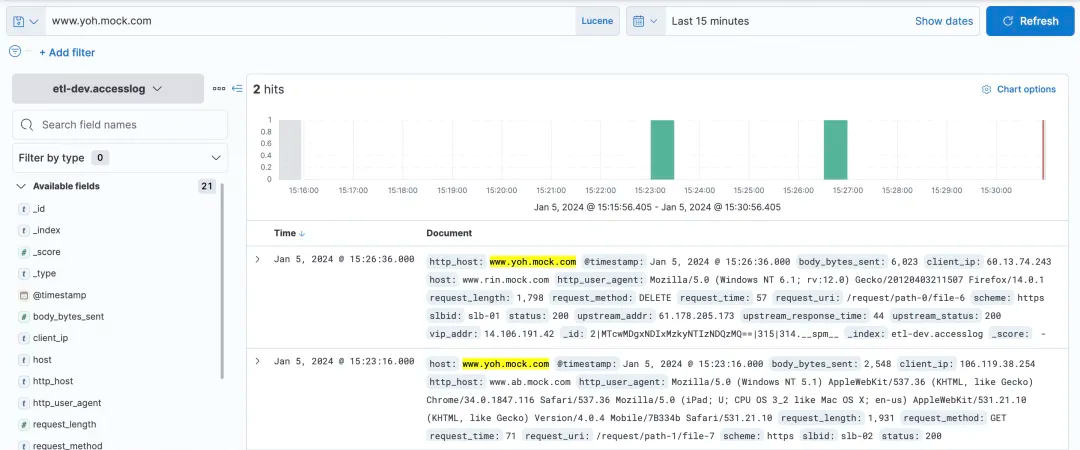
Simple host queries:
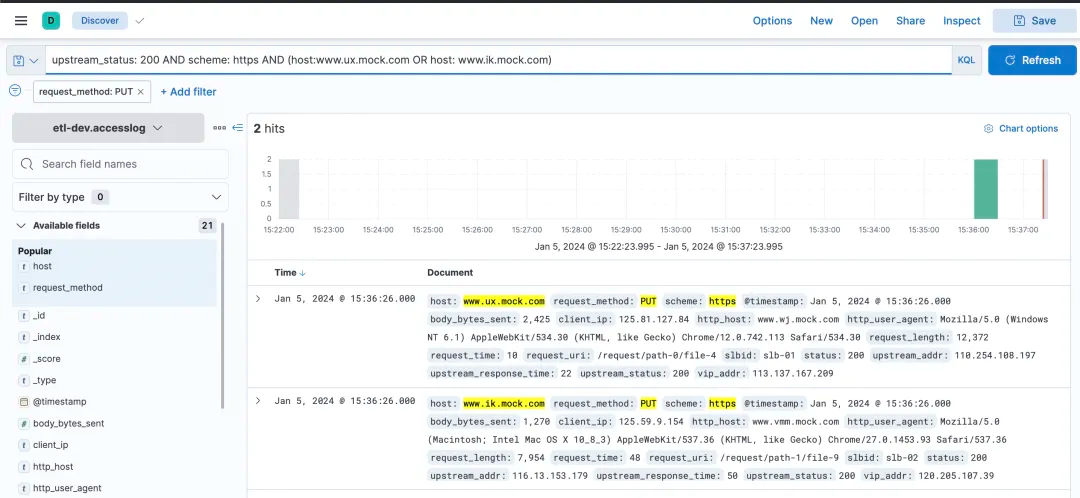
Relatively complex query and filter can be queried.
In addition to queries, can Kibana be used for visualization? Of course, it can!
Choose Dashboard.
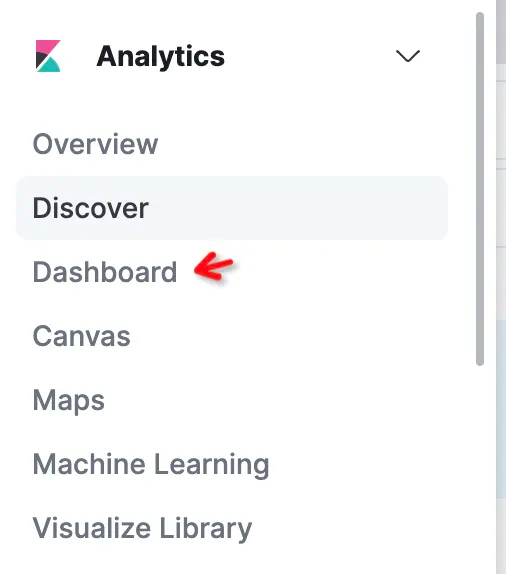
After entering, click Create Dashboard to create a chart.
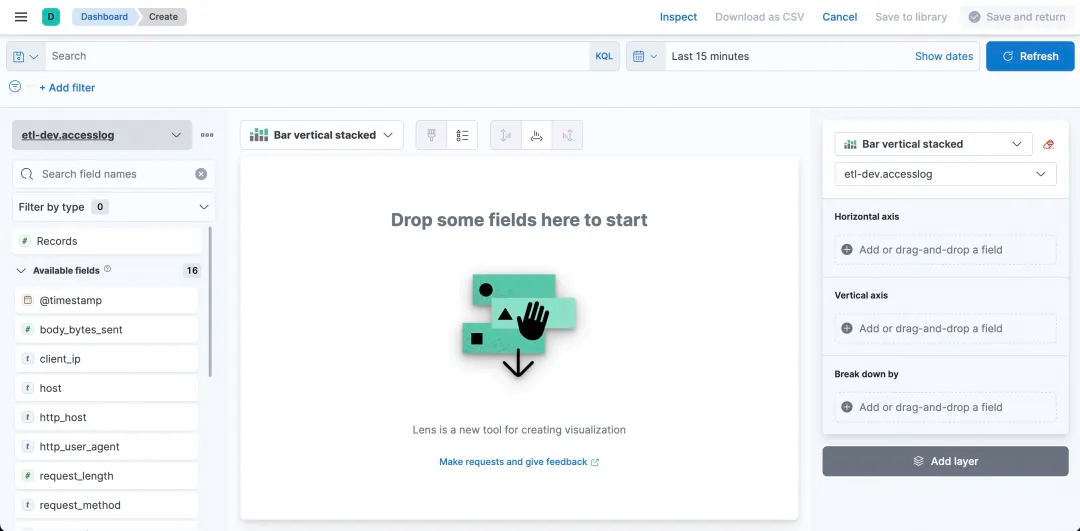
By setting the fields and statistics of the horizontal axis and vertical axis, it can easily make a desired graph.
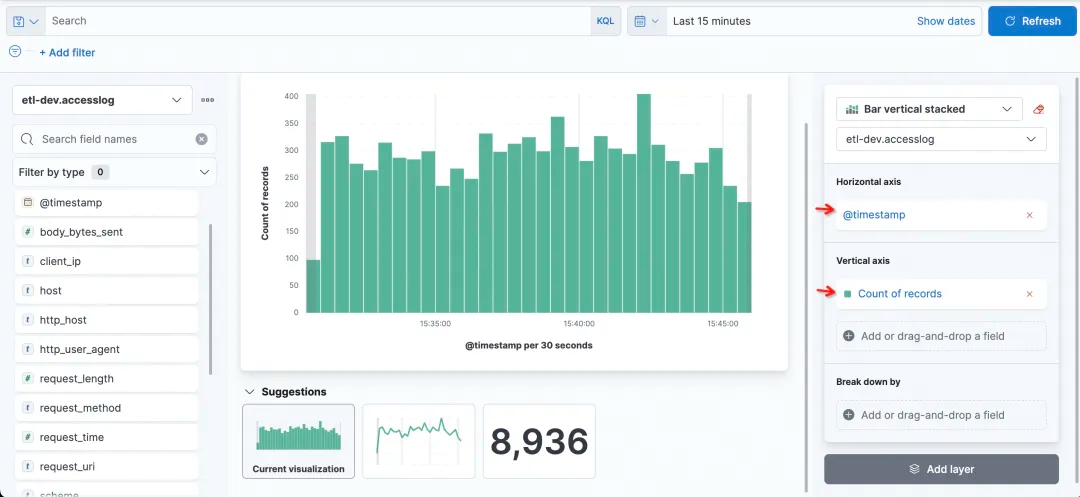
For example, you can obtain a simple histogram to count request accesses. Time is the horizontal axis, and the record number is the vertical axis.
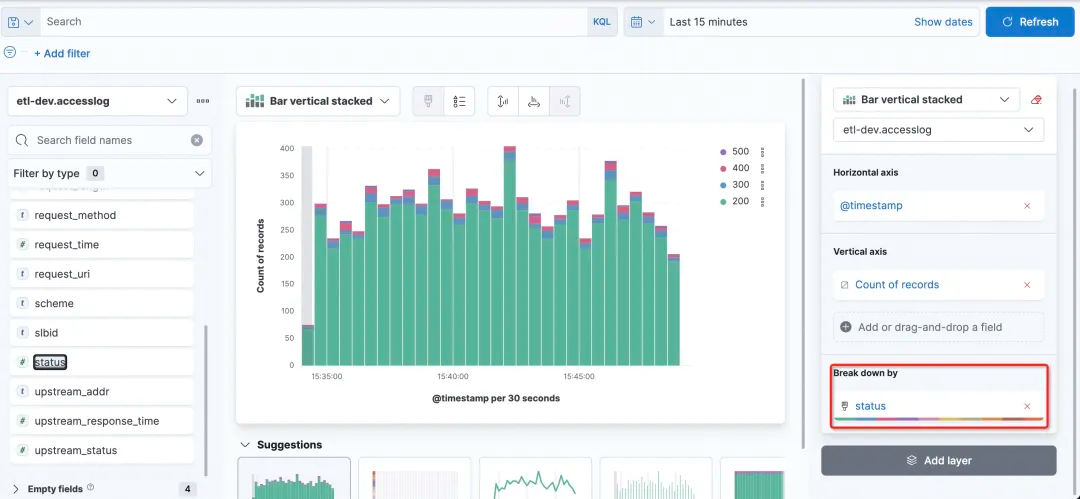
Now I want to see the status of each column, so I can choose status as the field of Break down by.
1) Why can't I see the SLS Logstore on Kibana?
Logstore on SLS is queried by using the Index Pattern of Kibana, while Logstore on SLS is created by manually creating the Index Pattern.
2) When creating an Index Pattern on Kibana, why is there no prompt if no input is made?
This is normal. After you enter the correct ${project}.${logstore} (you need to replace ${project} and ${logstore} with real values) on the left, it will be displayed.

3) When creating an Index Pattern on Kibana, is the wildcard * supported?
No. You must enter ${project}.${logstore} in full. For example, you can use etl-dev.accesslog to match it.

4) When creating an Index Pattern for Logstore on Kibana, why is there no prompt on the right side?

There are several possibilities:
https://${project}.${sls-endpoint}/es/. Note the /es/suffix.5) Does it support access to multiple SLS projects on Kibana?
Yes. The key lies in the configuration of kproxy. SLS_PROJECT, SLS_ENDPOINT, SLS_ACCESS_KEY_ID, and SLS_ACCESS_KEY_SECRET are the variable names related to the first Project. Starting from the second Project, its related variable names must be suffixed with numbers, such as SLS_PROJECT2, SLS_ENDPOINT2, SLS_ACCESS_KEY_ID2, and SLS_ACCESS_KEY_SECRET2. If the AccessKey of a Project is the same as that of the first Project, you can omit the corresponding AccessKey configuration of the Project.
For example, if another Project is to be checked by Kibaba, then for the second kproxy:
- SLS_ENDPOINT2=https://etl-dev2.cn-huhehaote.log.aliyuncs.com/es/
- SLS_PROJECT2=etl-dev2
- SLS_ACCESS_KEY_ID2=etl-dev2 the corresponding accessKeyId  # If it is the same as SLS_ACCESS_KEY_ID2, the configuration can be omitted
- SLS_ACCESS_KEY_SECRET2=etl-dev2 the corresponding accessKeyKey # If it is the same as SLS_ACCESS_KEY_ID2, the configuration can be omittedThis article demonstrates how to use Kibana to connect to the SLS ES-compatible API for querying and analysis. It is possible to seamlessly connect and utilize Kibana's query and visualization capabilities. This solution is suitable for the following two scenarios:
• If you have been using Kibana and your logs are already stored in Alibaba Cloud SLS, you can make use of this solution.
• If you are currently using the standard ELK solution but are weary of the maintenance or tuning efforts when using Elasticsearch, you may want to consider trying out Alibaba Cloud SLS solution (built on C++ underlying layer, serverless, low-cost, and ES-compatible).
Give it a try!
Microservices: How to Release New Versions under Heavy Traffic

212 posts | 13 followers
FollowAlibaba Cloud Native Community - May 13, 2024
Xi Ning Wang - August 30, 2018
Data Geek - May 14, 2024
Xi Ning Wang - August 21, 2018
Xi Ning Wang - August 23, 2018
Xi Ning Wang - August 23, 2018

212 posts | 13 followers
Follow Big Data Consulting for Data Technology Solution
Alibaba Cloud provides big data consulting services to help enterprises leverage advanced data technology.
Learn More Big Data Consulting Services for Retail Solution
Alibaba Cloud experts provide retailers with a lightweight and customized big data consulting service to help you assess your big data maturity and plan your big data journey.
Learn More Simple Log Service
An all-in-one service for log-type data
Learn More Data Lake Storage Solution
Build a Data Lake with Alibaba Cloud Object Storage Service (OSS) with 99.9999999999% (12 9s) availability, 99.995% SLA, and high scalability
Learn MoreMore Posts by Alibaba Cloud Native