By Zihao Rao and Long Yang
With the continuous development of software technology, many enterprise software systems have evolved from monolithic applications to cloud-native microservices models. This evolution enables applications to achieve high concurrency, easy scalability, and enhanced development agility. However, it also results in longer software application dependencies and reliance on various external technologies, posing challenges in troubleshooting online issues.
Despite the rapid evolution of observable technologies in distributed systems over the past decade, many problems have been mitigated to some extent. However, there are still challenges in identifying and addressing certain issues, as shown in the following figure.
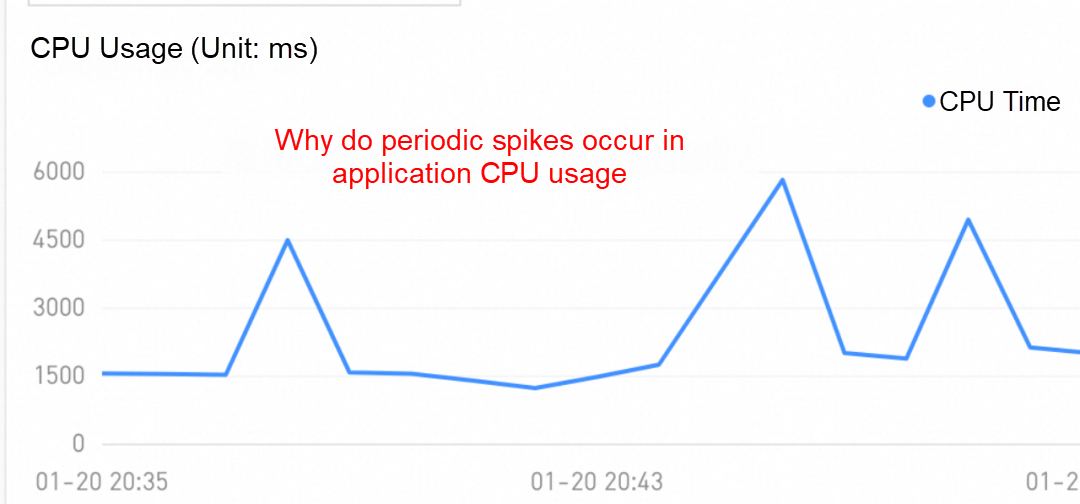
Figure 1 CPU persistence peak
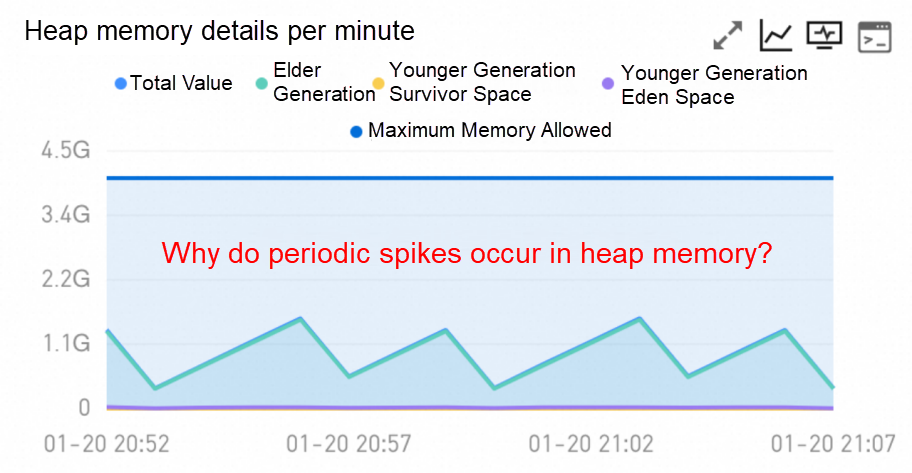
Figure 2 Where the heap memory space is used

Figure 3 Unable to locate the root cause of time consumption in the trace
Some of you may have more experience with troubleshooting tools, so you may think of the following troubleshooting methods for the preceding problems:
These solutions can sometimes solve problems, but if you have experience in troubleshooting related problems, you would know that these methods have their conditions and limits. For example,
Is there a simple, efficient, and powerful diagnostic technology that can help us solve the preceding problems? That is continuous profiling that we will introduce in the article.
Continuous profiling helps monitor and locate application performance bottlenecks by collecting the application's CPU & memory stacktrace information in a real-time manner. With this simple introduction, the concept of continuous profiling may still be vague to you. Though you might not have heard of continuous profiling before, you must have heard of or used the jstack provided by JDK, which is a tool that can print thread method stacks and locate the thread state when troubleshooting application problems.

Figure 4 jstack tool
The idea of continuous profiling is similar to jstack. It also captures CPU, memory, and other resources executed by the application thread at a certain frequency or threshold to apply for the use of stacktrace information, and then presents the relevant information through some visualization technologies, so that we can see the use of application-related resources more clearly. At this point, some of you who use more performance analysis tools may think of flame graphs:
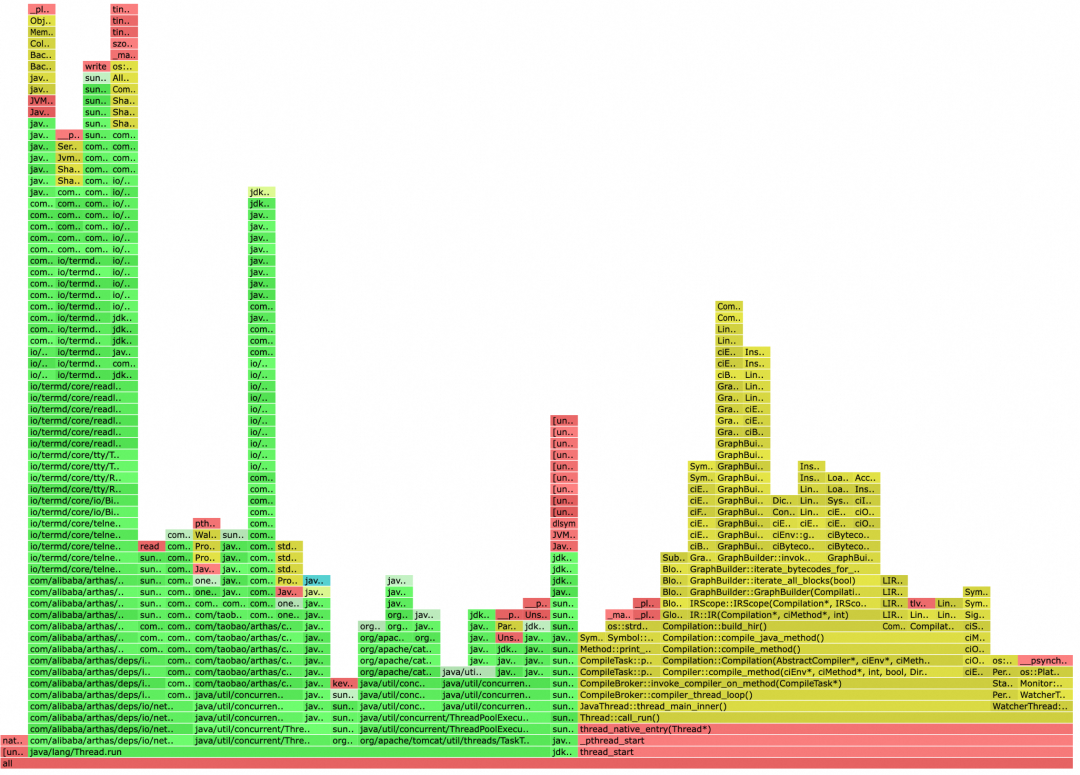
Figure 5 Flame graph tool
Usually, one-time performance diagnosis tools such as Arthas CPU hotspot flame graph generation tool which can be manually turned on or off during stress testing, are a kind of real-time profiling technology. The main difference between the two is that one-time performance diagnosis tools are real-time, not continuous.
Usually, we use CPU hotspot flame graph tools in stress testing scenarios. To do a stress testing performance analysis, we use some tools to grab the flame graph of an application over some time during stress testing. Continuous profiling is not only a solution to the performance observation of stress testing scenarios. More importantly, through some technical optimization, it can continuously profile the various resource use of the application in a low-overhead manner and follow the entire running lifecycle of the application. Then, through the flame graph or other visualization methods, it shows us more in-depth observable effects compared to observable technologies.
After discussing the basic concept of continuous profiling, you may be interested in its implementation principles. Here is a brief introduction to some related implementation principles.
We know that Tracing collects information in calls by tracking method points on the key execution path to restore details such as parameters, return values, exceptions, and call duration. However, it is challenging for business applications to comprehensively monitor all method points, and an excessive number of method points can lead to high overhead. This can result in blind spots in Tracing monitoring, as shown in Figure 3. Continuous profiling goes further by tracking resource applications related to key locations in the JDK library or relying on specific events in the operating system to collect information. This not only minimizes overhead but also provides greater insight through the collected information.
For instance, the general concept of CPU hotspot profiling involves obtaining information about threads executing on the CPU through system calls at the lowest level of the operating system, and then collecting method stack information at certain intervals. For example, if the interval is 10 ms, the stack trace information of 100 threads will be collected in 1 second, as depicted in Figure 6. Subsequently, the stack trace is processed, and visualization techniques such as the flame graph are used to display the CPU hotspot profiling result. It is important to note that the above is just a brief description of implementation principles. Different profiling engines and objects to be profiled typically involve various technical implementations.
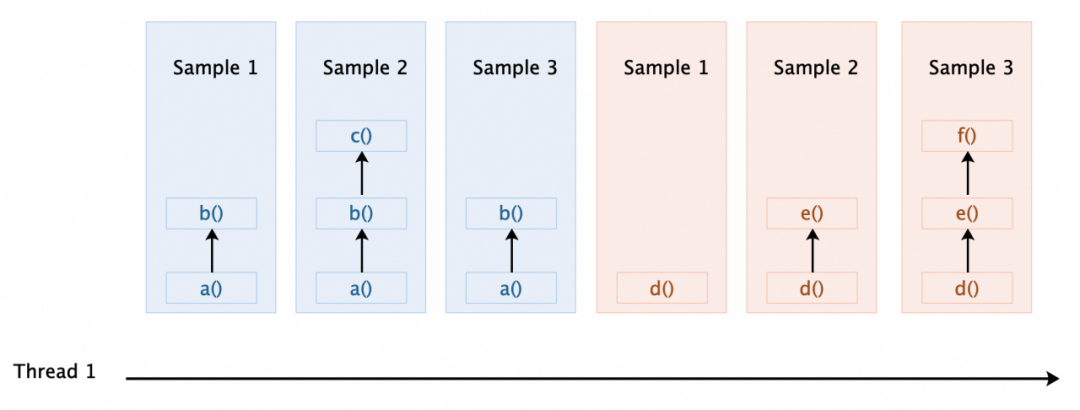
Figure 6 Principle of continuous profiling collection
In addition to the common CPU hotspot flame graph profiling, for the use and application of various system resources, profiling results provided by continuous profiling can also help the analysis of the related source application and the introduction to the implementation principle, but note that different profiling implementation technologies may have different results.
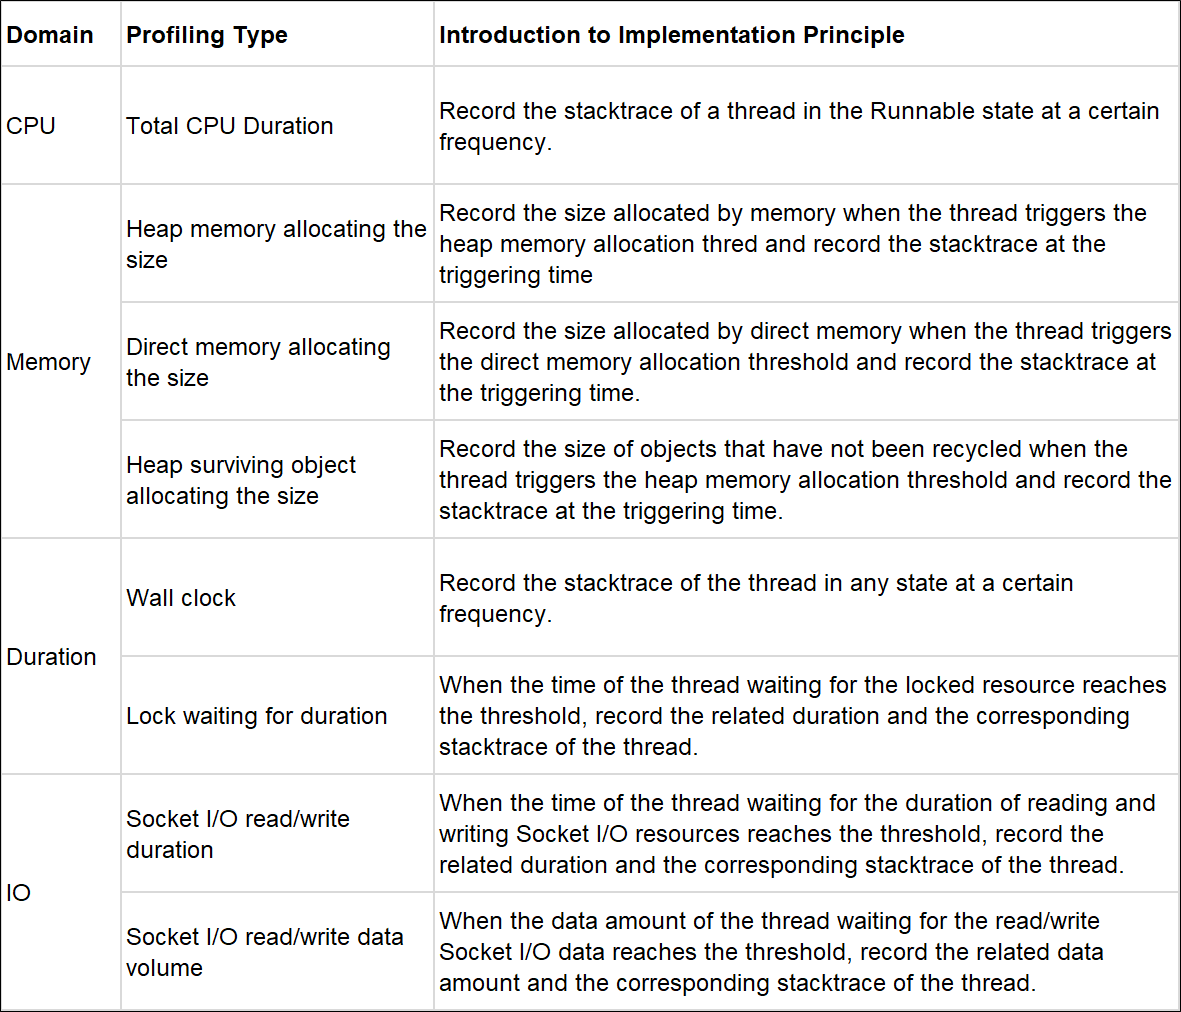
In so much information about continuous profiling, we have mentioned the flame graph, one of the most widely used technologies in terms of data visualization after continuous profiling and collection. What are the secrets of the flame graph?
The flame graph is a visualization analysis tool of program performance that helps developers track and display the function calls of a program and the time taken by the calls. The core idea is to convert the program's function call stacktrace into a rectangular flame-shaped image. The width of each rectangle indicates the resource use proportion of the function, and the height indicates the overall call depth of the function. By comparing the flame graphs at different time, the performance bottleneck of the program can be quickly diagnosed, so that targeted optimization can be carried out.
In a broad sense, we can draw a flame graph in two ways:
(1) the narrow flame graph with the bottom element of the function stacktrace being at the bottom, and the top element of the stacktrace being at the top, as shown in the left figure below
(2) the icicle-shaped flame graph with the bottom element of the stacktrace being at the top, and the top element of the stacktrace being at the bottom, as shown in the right figure below
 |
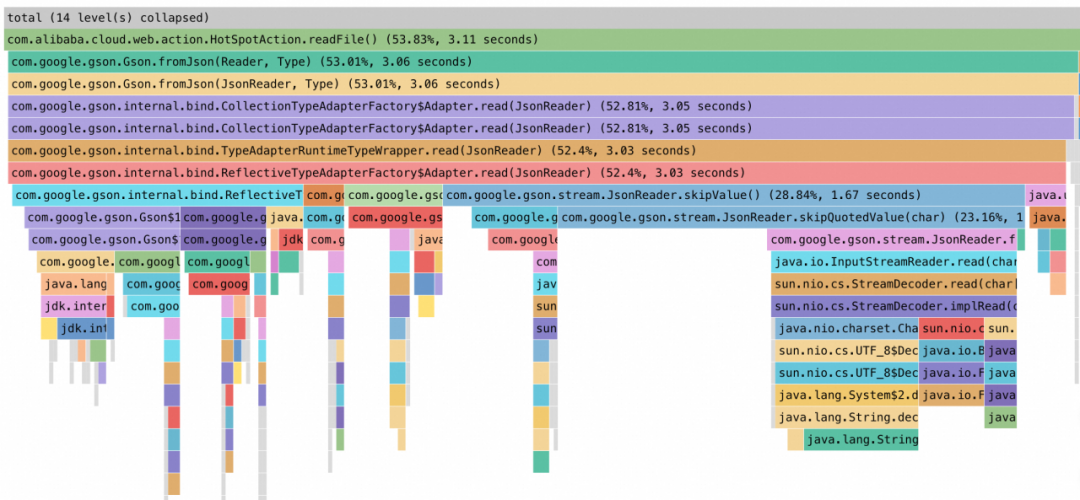 |
Figure 7 Two types of flame graphs
As a visualization technique for performance analysis, the flame graph can be used for performance analysis only based on the understanding of how it should be read. For example, for a CPU hotspot flame graph, one of the arguments is to see if there is a wider stack top in the flame graph. What is the reason?
This is because what the flame graph draws is the stacktrace of method execution in the computer. The call context of the function in the computer is based on a data structure called stack for storage. The stack data structure is characterized by the last-in-first-out (LIFO) of elements. Therefore, the bottom of the stack is the initial call function, and upper layers are called subfunctions. When the last subfunction, that is, the top of the stack, is executed, elements will be pushed out of the stack from top to bottom in turn. Therefore, the stack top is wider, which means that the execution time of the subfunction is long, and the parent function below it will also take a long time because it cannot be pushed out of the stack immediately after it has been executed.
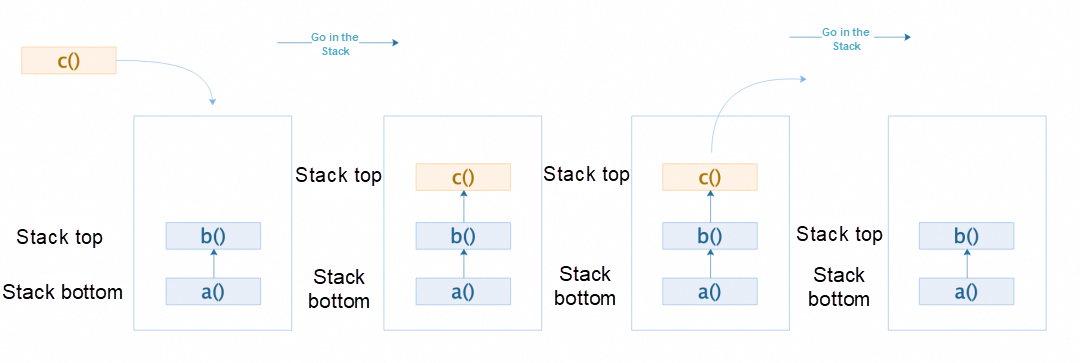
Figure 8 Stack data structure
Therefore, the steps for analyzing the flame graph are as follows:
The following figure shows a flame graph with high resource usage. To analyze the performance bottlenecks in the flame graph, perform the following steps:
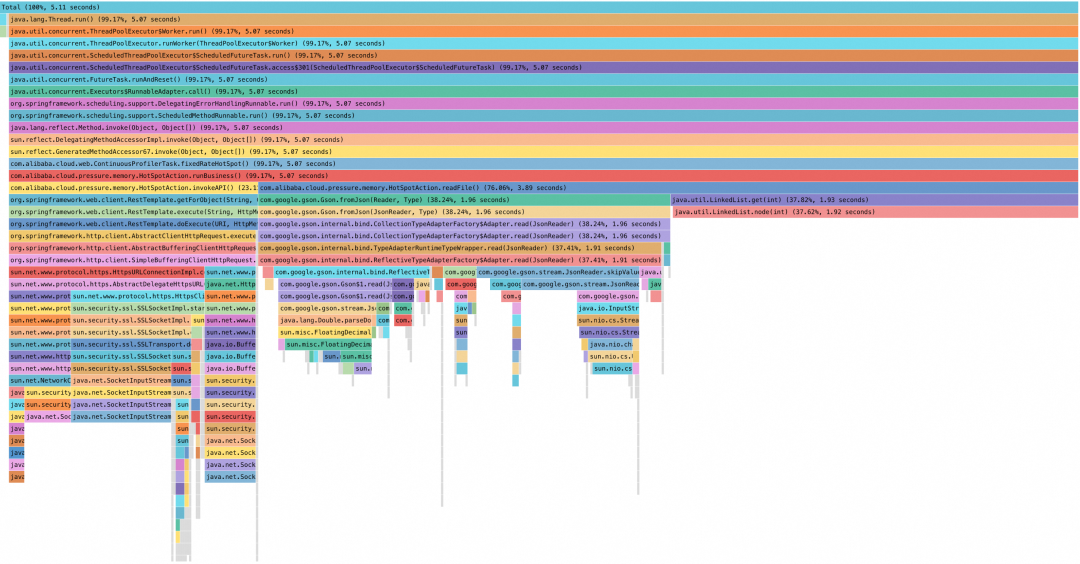
Figure 9 Flame graph analysis process
After the preceding introduction, you may have a certain understanding of the concept of continuous profiling, collection principles, and visualization techniques. Then, we will introduce the out-of-the-box continuous profiling capability provided by ARMS (Application Real-time Monitoring Service) to help troubleshoot and locate various online problems.
ARMS provides the one-stop continuous profiling feature. Nearly 10,000 of application instances are available online for continuous collection and monitoring.
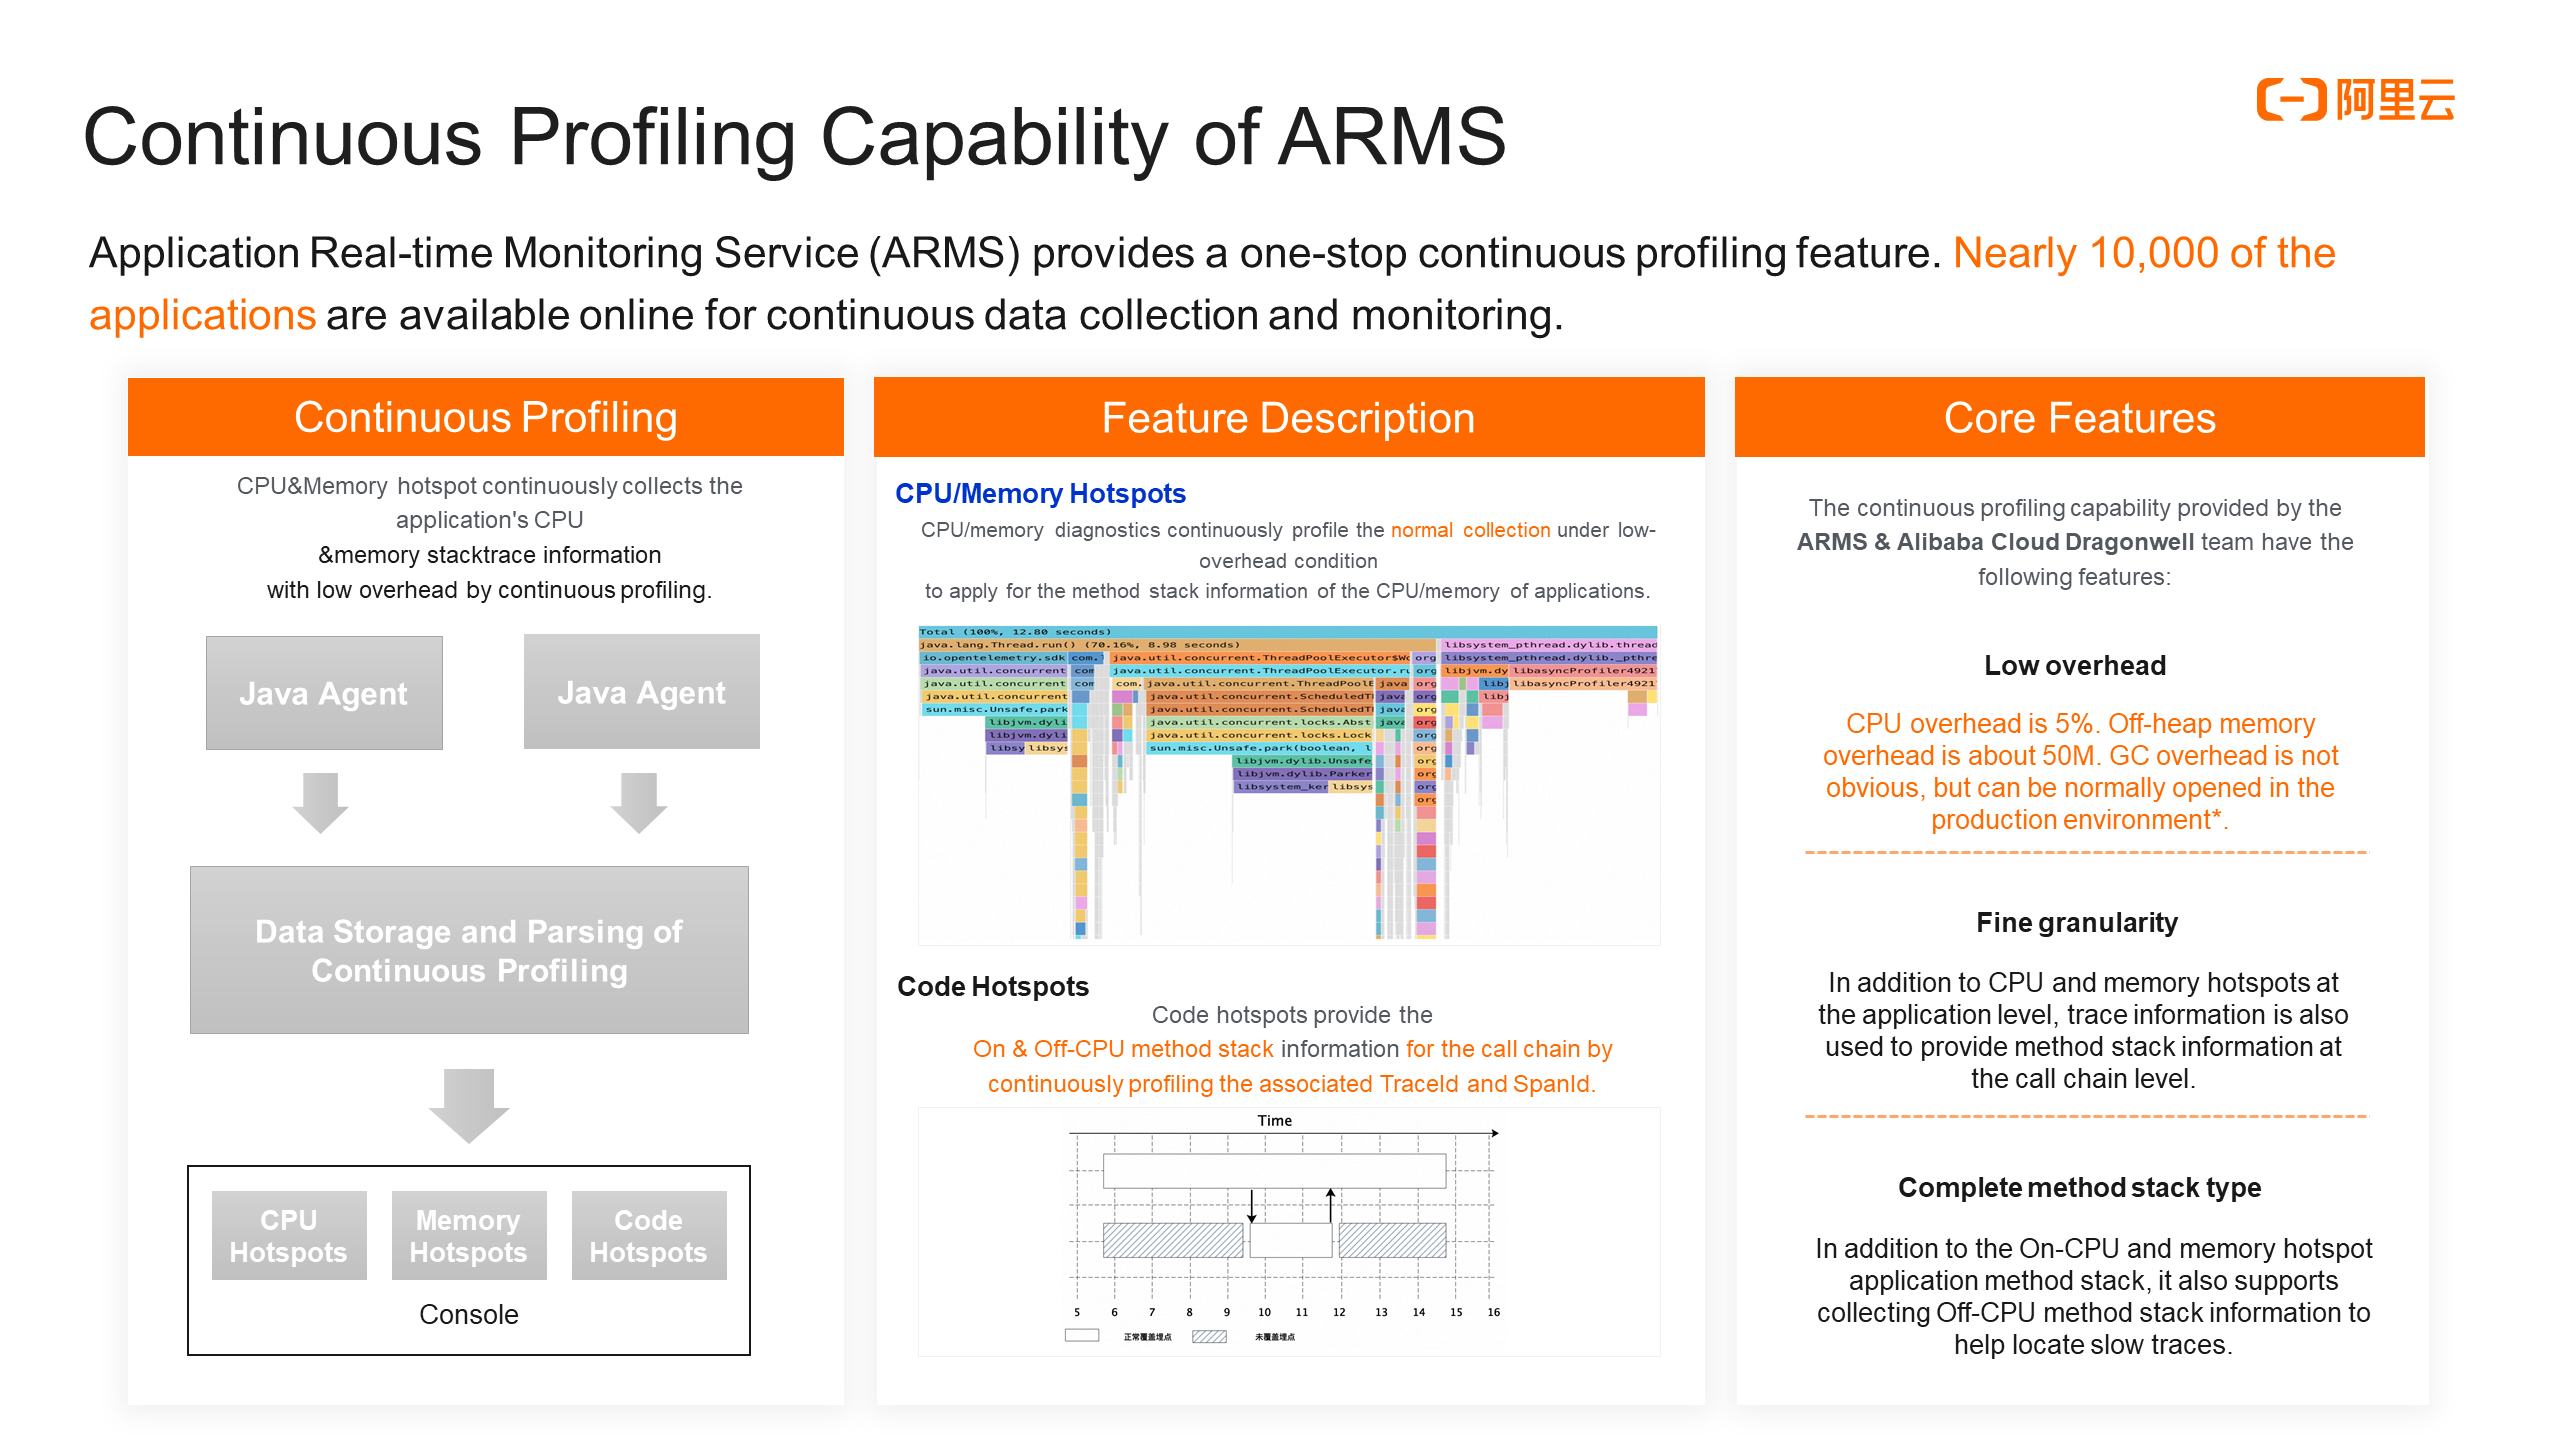
Figure 10 ARMS continuous profiling capabilities
The left side of the figure shows an overview of the continuous profiling capabilities of ARMS. Data processing, and data visualization are shown in sequence from top to bottom. As for specific functions, corresponding solutions are provided for several scenarios with the most urgent user needs, such as CPU and heap memory analysis, and CPU and memory hotspot functions are provided. ARMS provides the code hotspot feature for slow trace diagnosis. Continuous profiling on ARMS is a product developed by the ARMS team together with the Alibaba Cloud Dragonwell team. Compared with general profiling solutions, it features low overhead, fine granularity, and complete method stacks.
The ARMS product documentation provides the best practices for the corresponding sub-features:
• For more information about how to diagnose high CPU utilization, see Use CPU hotspots to diagnose high CPU consumption [1].
• For more information about how to diagnose high heap memory utilization, see Use memory hotspots to diagnose high heap memory usage [2].
• For more information about how to diagnose the root cause of slow traces, see Use the hotspot code analysis feature to diagnose slow traces[3].
Since the release of the relevant functions, it has better assisted users in diagnosing some complicated problems that have been plaguing online for a long time, and has been well received by many users. The following are some customer stories.
1. User A found that when an application service was just started, the first few requests were slow, and the monitoring blind area appeared when using Tracing, so time-consumption distribution cannot be diagnosed. Finally, User A used ARMS code hotspots to help diagnose that the root cause of the related slow trace is the time-consuming initialization of the Sharding-JDBC framework, which helped the user finally understand the root cause of this problem.
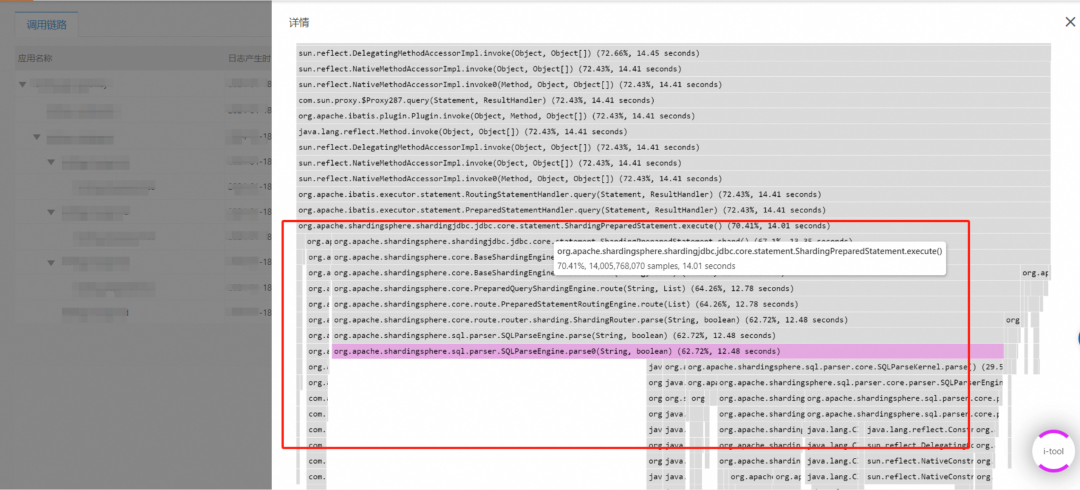
Figure 11 User problem diagnosis Case 1
2. User B found that during the stress test, the response time of some nodes in all instances of the application was much slower than that of other nodes, and the root cause cannot be found by using Tracing. Finally, through the code hotspots, User B found that a large amount of time would be spent on writing logs when the relevant application instances were under certain pressure. Then, according to the relevant information, the user checked the resource utilization rate of the log collection component in the application environment. It is found that a large amount of CPU was occupied during the stress test, resulting in slow request processing due to the lack of competition for resources in the application instance writing logs.
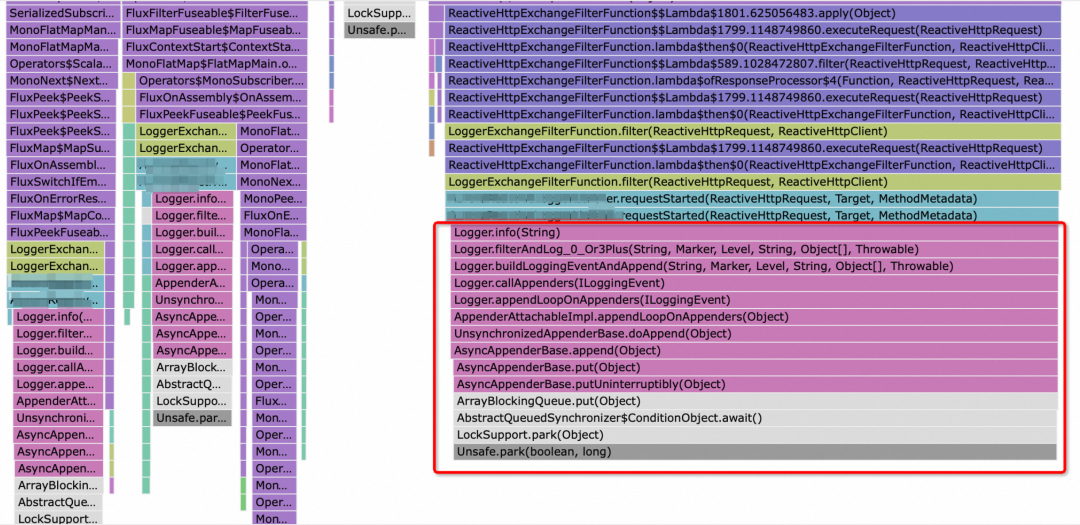
Figure 12 User problem diagnosis Case 2
3. User C found that during the running of the online application, the heap memory usage was always very large. Through memory hotspots, it was quickly discovered that the persistent processing of the subscribed upstream service information during the running of the microservice framework of this version used by the application resulted in a large amount of heap memory usage. Then, this user consulted the relevant framework service provider. Finally, User C learned that the problem can be solved by upgrading the framework version.
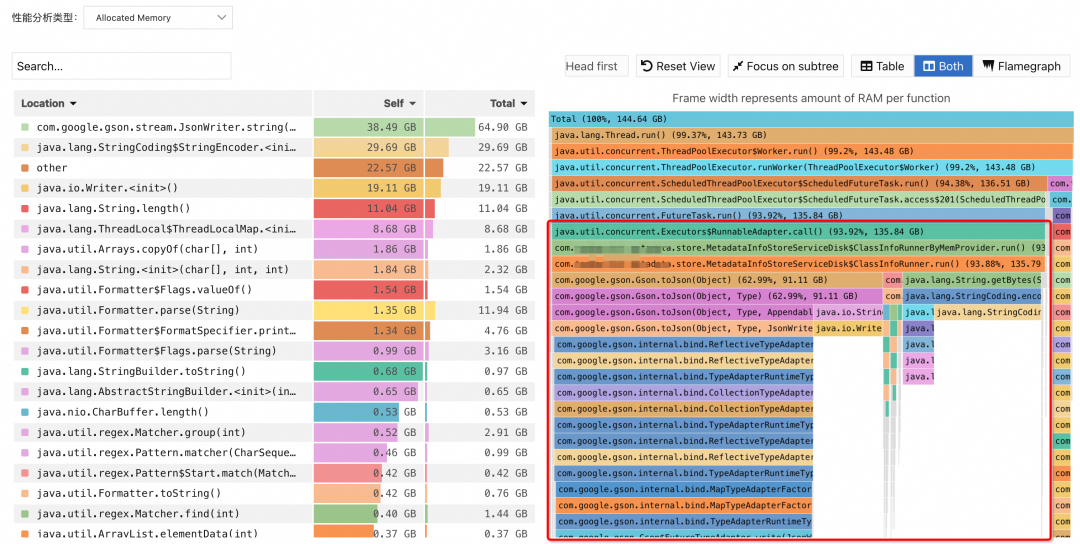
Figure 13 User problem diagnosis Case 3
The utilization rate of CPU /memory and other resources in the running process of many enterprise applications is in fact quite low. With minimal resource consumption, continuous profiling offers a new perspective for applications, allowing for detailed root cause identification when exceptions occur.
If you are interested in the continuous profiling feature in ARMS, click here to learn more.
[1] Use CPU hotspots to diagnose high CPU consumption
[2] Use memory hotspots to diagnose high heap memory usage
[3] Use code hotspots to diagnose problems with slow traces
Practices for Distributed Elasticity Training in the ACK Cloud-native AI Suite
Use SPL to Efficiently Implement Flink SLS Connector Pushdown

208 posts | 12 followers
FollowAlibaba Cloud Native - February 2, 2024
Alibaba Cloud Native Community - May 9, 2023
Alibaba Cloud Native - July 4, 2023
Alibaba Cloud Indonesia - February 22, 2024
Alibaba Cloud Native - September 12, 2024
Alibaba Cloud Native - March 6, 2024

208 posts | 12 followers
Follow Application Real-Time Monitoring Service
Build business monitoring capabilities with real time response based on frontend monitoring, application monitoring, and custom business monitoring capabilities
Learn More Managed Service for Prometheus
Multi-source metrics are aggregated to monitor the status of your business and services in real time.
Learn More Real-Time Livestreaming Solutions
Stream sports and events on the Internet smoothly to worldwide audiences concurrently
Learn More Enterprise Distributed Application Service
A PaaS platform for a variety of application deployment options and microservices solutions to help you monitor, diagnose, operate and maintain your applications
Learn MoreMore Posts by Alibaba Cloud Native