By Chengpu and Yibo
Starting from the earliest paper published by Google titled Dapper, a Large-Scale Distributed Systems Tracing Infrastructure, observability solutions supplemented by metrics, tracing, and logging have gradually gained acceptance in the industry and become the de facto standard.
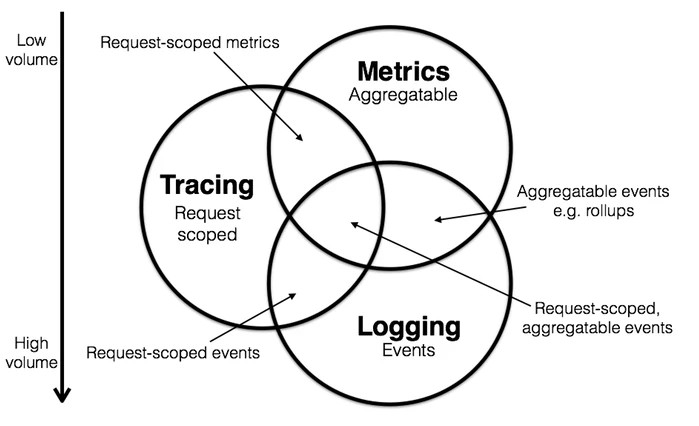
Based on the aforementioned full-stack observability solution technology, problem diagnosis has evolved from the previous challenges of not knowing where to start or solely relying on logs, to the following steps:
This complete set of observability solutions not only enables the quick identification and timely mitigation of problems after they occur but also facilitates early detection, solution, and repair of issues even before major faults emerge.
Can the comprehensive observability solutions mentioned above permanently solve all online monitoring issues? The answer is no, especially in the realm of tracing. Typically, tracing relies on Java Agent or SDK solutions to instrument mainstream software development frameworks such as HTTP services, RPC services, databases, and distributed messaging MQ. This instrumentation collects trace monitoring data, which is then used to correlate monitoring information with specific requests, reconstructing the processing logic. As a result, when requests behave abnormally, you can review the call information based on the collected monitoring data. Besides providing a way to track the core path a request takes, another fundamental purpose of tracing is to identify time-consuming slow spots within a trace to aid in code optimization. The specific troubleshooting process involves using detailed trace information, as illustrated below, to diagnose the time-consuming bottleneck logic in the trace:
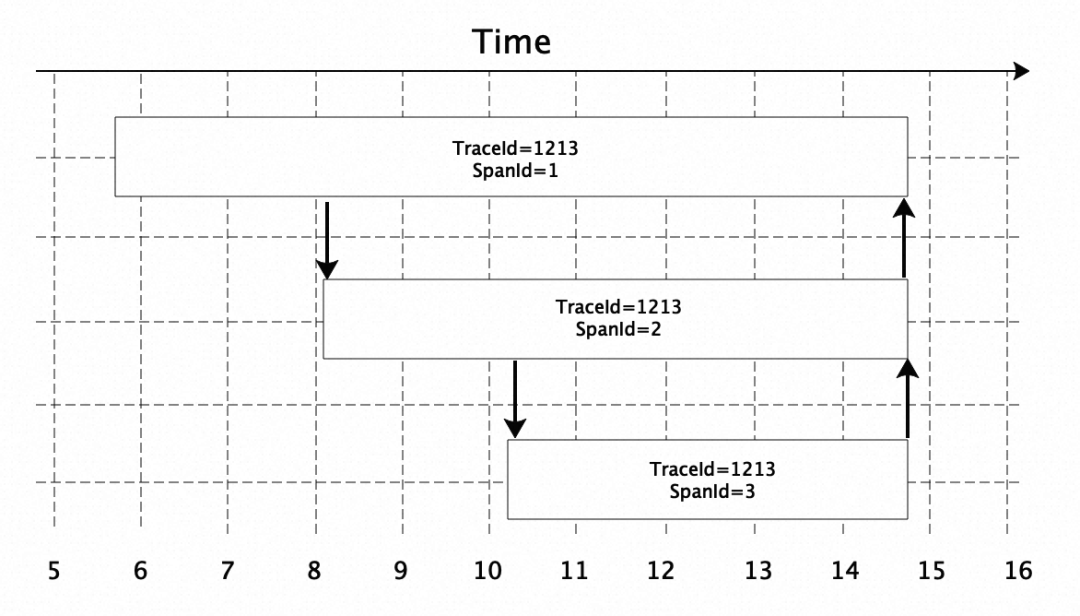
As shown in the preceding figure, a trace has a unique TraceId. The trace contains multiple spans. Each span has a specific SpanId and indicates that multiple downstream services have been called. With the preceding figure, we can know the services that a request passed through (assuming that a downstream service corresponds to a span, which may be different in some tracing analysis systems) and the time consumed, so as to locate the time-consuming bottleneck of the application and optimize the performance of the application.
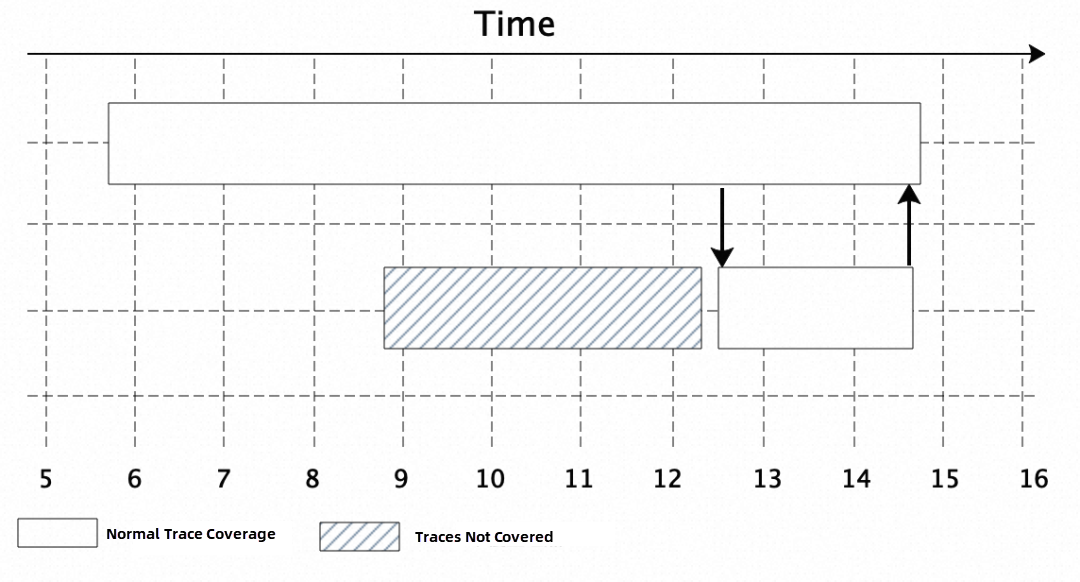
However, in the field of distributed microservices, due to the complexity of traces that span across machines or even data centers, general tracing systems can only trace core methods within mainstream open-source software frameworks. When a time-consuming position appears within user business logic that is not captured in the traces, a long period of time consumption will be present within the final trace. This period cannot be associated with a specific code execution method, making it challenging to accurately determine the time consumption of the business logic.
The specific case can be seen in the following code:
public String demo() throws SQLException {

    // It takes 1,000 ms to simulate the time-consuming logic of other businesses.
    take1000ms(1000);
    // Execute the SQL query.
    stmt = conn.createStatement();
    ResultSet rs = stmt.executeQuery("SELECT * FROM table");

    return "Hello ARMS!";
}

private void take1000ms(long time) {
  try {
    Thread.sleep(time);
  } catch (InterruptedException e) {
    e.printStackTrace();
In the above code logic, lines 6 and 7 represent the execution logic related to the database connection. Typically, mainstream tracing systems cover such logic with trace points. However, the specific customer service time in line 4 is not captured by the monitoring trace due to the lack of corresponding trace points. As a result, the time consumption is incorrectly attributed to the Spring Boot method demo at the upper layer entrance.
The final representation in the tracing trace may appear similar to the figure below. Through the tracing trace, we can only determine the time consumption of the first-layer external interface and the execution logic of well-known software frameworks. The gray-shaded section represents the user business logic code that is not covered by the tracing system. This monitoring blind spot prevents us from accurately determining the actual time consumption, which hinders the troubleshooting of online performance issues.
The above problems are common among enterprise users.
To address the issue of diagnosing time-consuming slow traces in scenarios where traces are missed by the tracing system, there are few relevant industry solutions currently available. Some of you who are familiar with Arthas may mention the trace command [1]. It can help pinpoint specific time-consuming positions in slow traces in simple reproducible scenarios.
• Limited Scope
Slow call diagnosis is only supported in scenarios that can be reliably reproduced. It is challenging to troubleshoot slow call problems triggered by garbage collection, resource contention, or network issues.
• High use threshold
In actual production scenarios, traces can be complex. You must be well-versed in the business code and manually run the trace command on specific business methods to monitor request duration. If you are unfamiliar with the business method execution or encounter complex asynchronous call scenarios, it becomes difficult to use this tool for troubleshooting.
• High Check Cost
This tool is useful for troubleshooting slow calls in simple single-hop business scenarios. However, in complex cross-application multi-hop business scenarios, the troubleshooting process becomes cumbersome. You need to use APM tools to locate the application instance where the specific slow call occurs. Additionally, if the service call method stack is deep, you have to execute relevant commands layer by layer to identify the source of the problem step by step.
To sum up, the trace command of Arthas can be effective in simple slow call scenarios, but it falls short in troubleshooting slow traces in complex scenarios.
To address this, the Alibaba Cloud Application Real-Time Monitoring Service (ARMS) team and the Alibaba Dragonwell team utilize continuous profiling technology to help users restore the method stack information of the trace and overcome blind spots in tracing monitoring.
As a well-known APM tool in China, ARMS not only provides mainstream observability solutions for tracing, metrics, and logging, but also offers out-of-the-box continuous profiling (CP) solutions. Continuous profiling helps monitor and pinpoint application performance bottlenecks by dynamically collecting stack information related to CPU or memory usage in real-time. The following figure shows the architecture of the continuous profiling capabilities provided by ARMS.
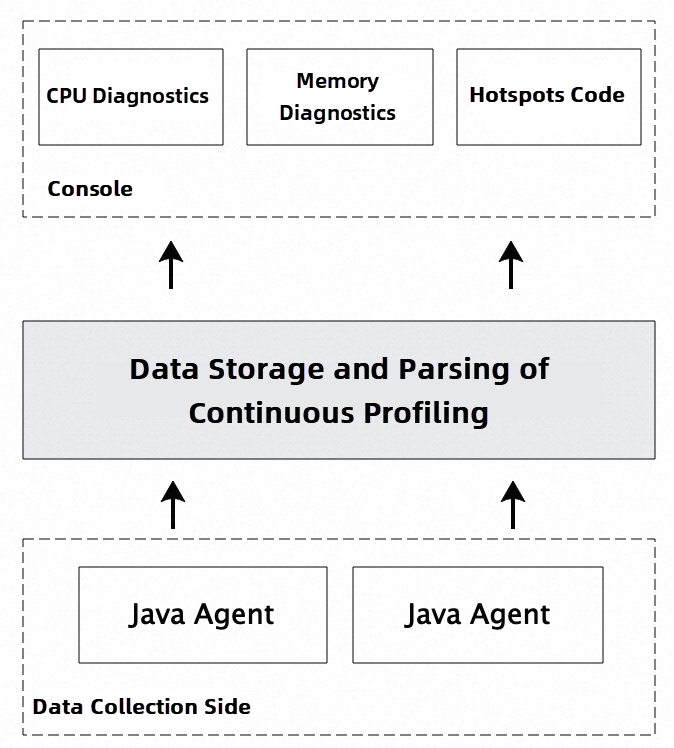
On the client-side, Java Agent technology provides non-intrusive continuous profiling data collection capabilities in addition to other observability features. The collected data is then analyzed and processed on the server-side. The console interface offers users out-of-the-box functionalities, including CPU diagnostics, memory diagnostics, and hotspot code analysis.
Many of you may be familiar with flame graphs when troubleshooting application performance issues. By observing the presence of a wide top in the flame graph, you can identify application performance problems. For most developers, the term flame graph typically refers to CPU hotspot flame graphs. These graphs represent the time consumed by CPU methods executed within the application over a specific period. Leveraging the open source continuous profiling tool, Async Profiler [2], the CPU and memory diagnostics feature provided by ARMS enables you to regularly collect method stack information related to CPU and memory usage in your application, at a low cost. It allows you to monitor CPU and memory usage in production scenarios efficiently and effectively. With this feature, you can overcome situations where it is difficult to regularly enable open source tools and easily address scenarios that are difficult to reproduce.
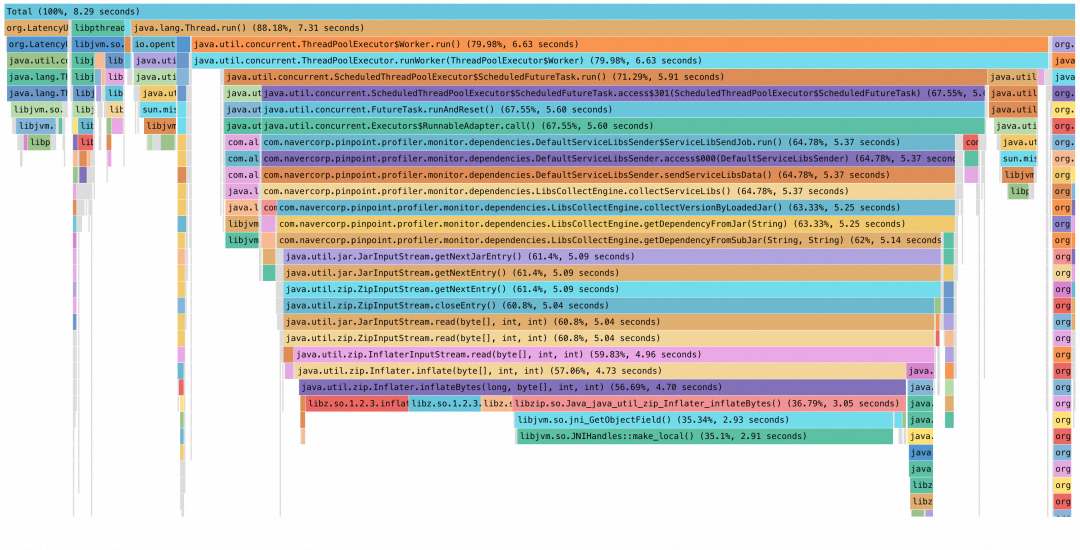
After CPU & memory diagnostics are introduced, some of you may wonder whether using the method stack flame graph corresponding to CPU diagnostics can help solve the problem of blind zones in tracing system monitoring and help troubleshoot slow traces. The answer is no, because the CPU diagnostics is implemented by capturing the method stack information of the execution thread executing on the CPU at regular intervals and then converting it into a flame graph.
In addition to the Running state (also called On-CPU) executed on the CPU, there are other thread states, such as Blocked and Waiting (collectively called Off-CPU) in software programs. A slow trace is often caused by the superposition of multiple thread states, resulting in long time consumption. Therefore, the CPU flame graph has a limited effect on slow trace scenarios.
Is there a flame graph technology that can not only describe On-CPU but also contain Off-CPU content? Then, I have to mention the Wallclock flame graph. The implementation principle is not complicated. That is, select a group of threads in the application at a fixed frequency to collect the method stack information at the current moment and draw the corresponding flame graph through aggregation. Async Profiler also provides related capabilities.
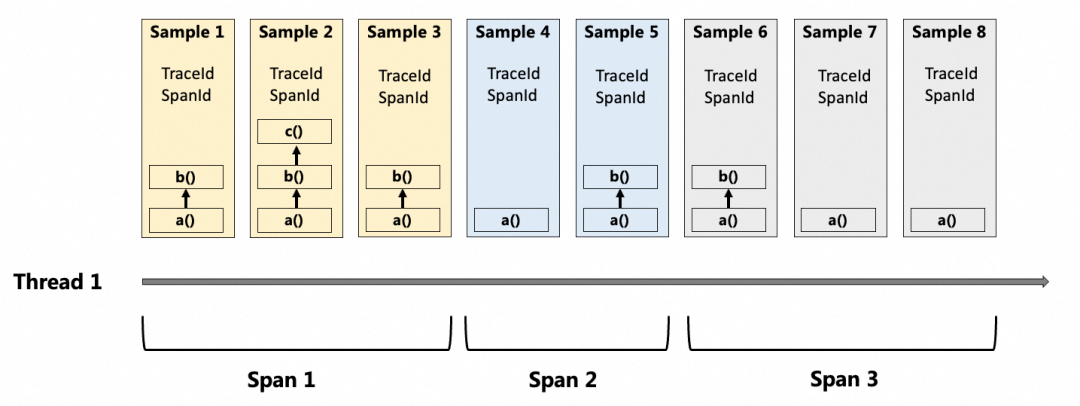
Based on the wall clock capability of open source Async Profiler, the topic of this article, hotspot code, provides an On & Off-CPU flame graph by associating the TraceId and SpanId information in the traces, which can effectively restore the details of the blind zones of tracing monitoring and help users diagnose various common slow trace problems. The specific process is shown in the following figure. By associating or unassociating the TraceId and SpanId information when the thread starts creating and stops creating a span, the method stack snapshot sample of the resulting wallclock contains relevant information. Then, the final continuous profiling data is processed and analyzed to restore the wallclock flame graph related to the corresponding trace to help locate slow trace problems.
Compared with other slow trace diagnostic tools or open source continuous profiling tools, the continuous profiling capabilities provided by ARMS have the following features:
• Low overhead
Through measures such as automatic sampling based on the trace process and wallclock profiling based on the associated sample rate, the current continuous profiling capabilities provided by ARMS have a CPU overhead of 5%, an off-heap memory overhead of about 50 MB, and an insignificant GC (Garbage Collection) overhead. It can be normally enabled regularly in the production environment.
• Fine granularity
In addition to CPU and memory hotspots at the application level, it also provides method stack information for the trace level by associating TraceId and SpanId information, which can effectively help diagnose slow trace problems.
• Safe and reliable, simple and efficient
Some open source continuous profiling technologies, such as using Arthas to generate CPU flame graphs (the bottom layer also relies on Async Profiler), are generally ready to use and disabled after use. Therefor, even if there are technical risks, it is not easy to find. In the product development process, we still found use risks in the continuous profiling process of many open source technologies such as Async Profiler. For example, memory profiling may cause application crash #694 [3], and wallclock flame graphs may cause threads to block #769 [4] for a long time. Fixing these problems makes our product capabilities more secure and reliable. In addition to security, after the continuous profiling capabilities provided by ARMS are enabled regularly, data is automatically saved for 7 days. By doing so, users won't miss every diagnostic scene of each slow trace.
1. Log on to the ARMS console. In the left-side navigation pane, choose Application Monitoring > Applications.
2. On the Applications page, select a region in the top navigation bar and click the name of the application that you want to manage.
3. In the left-side navigation pane, click Interface Invocation. On the page that appears, select an interface and click the Interface Snapshot tab.
4. On the Interface Snapshot tab, click a trace ID.
5. In the Details column, click the Magnifier icon. On the Method Stack tab, you can view the method stack information displayed by using the tracing tool. The method stack information contains only the execution logic related to MariaDB, and the time consumption of former businesses is not recorded.
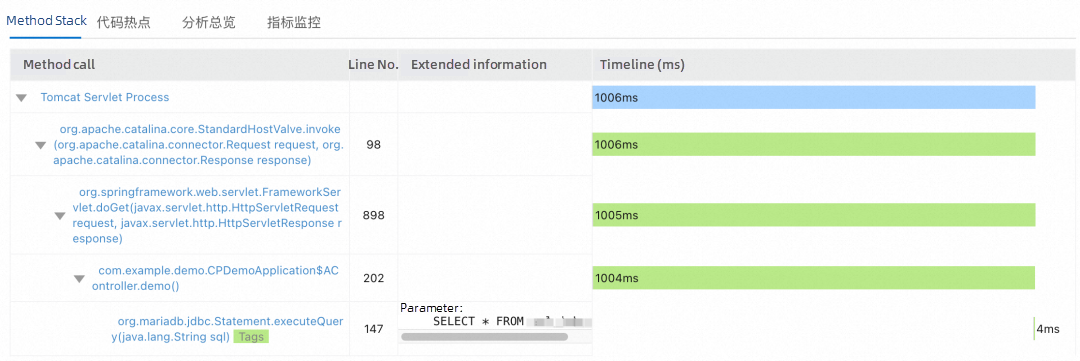
6. Then, click the Code Hotspot tab. In the flame graph on the right, you can observe the method stack related to MariaDB (represented by the sharp flame on the right side of the flame graph below). Additionally, you will notice the 990ms time consumption related to java.lang.Thread.sleep() (Please note that continuous profiling, which relies on sampling, may introduce slight deviations).
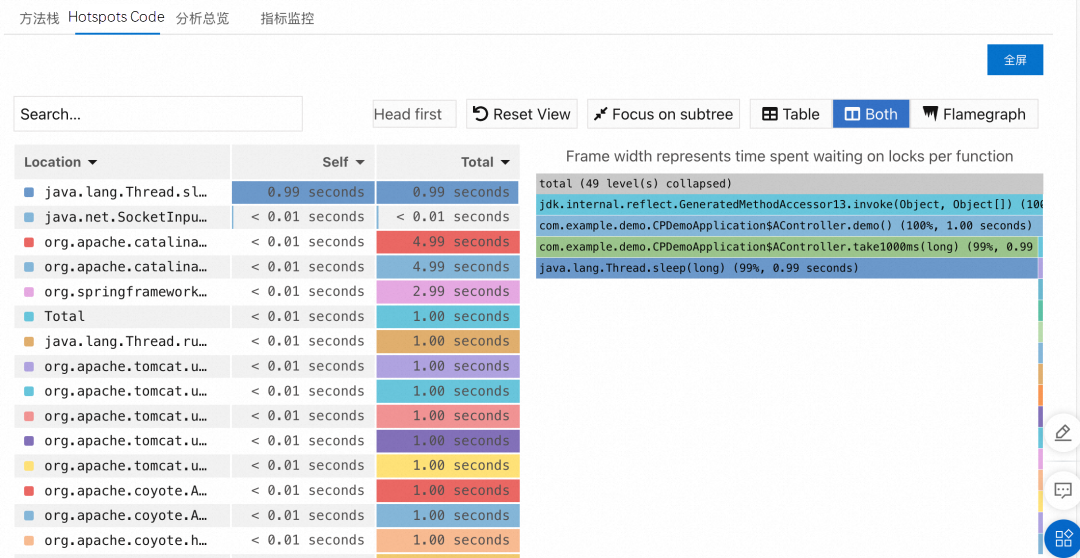
On the left side of the figure, you can see the time consumed by all the methods involved in the current invocation. On the right side, there is a flame graph depicting the method stack information for each method. The Self column displays the time consumed by the method itself. When analyzing hotspot code, you can locate time-consuming methods by focusing on the "Self" column or the wide flame at the bottom of the right-side flame graph. A wide flame usually indicates a system performance bottleneck. In the example above, the java.lang.Thread.sleep() method consumes a significant amount of time due to system performance bottlenecks. For more details on how to use this feature, please refer to the relevant user documentation [5].
[1] Trace command
https://arthas.aliyun.com/en/doc/trace.html
[2] Async Profiler
https://github.com/async-profiler/async-profiler
[3] #694
https://github.com/async-profiler/async-profiler/issues/694
[4] #769
https://github.com/async-profiler/async-profiler/issues/769
[5] User documentation
https://www.alibabacloud.com/help/en/arms/application-monitoring/user-guide/use-code-hotspots-to-diagnose-code-level-problems?spm=a2c4g.11186623.0.i3
Model Service Mesh: Model Service Management in Cloud-native Scenario

212 posts | 13 followers
FollowAlibaba Cloud Native Community - September 22, 2025
Alibaba Cloud Native - April 16, 2024
Alibaba Cloud Native Community - April 18, 2025
Alibaba Cloud Native - August 14, 2024
Alibaba Cloud Native - March 6, 2024
Alibaba Cloud Native Community - January 20, 2026

212 posts | 13 followers
Follow Application Real-Time Monitoring Service
Build business monitoring capabilities with real time response based on frontend monitoring, application monitoring, and custom business monitoring capabilities
Learn More Real-Time Livestreaming Solutions
Stream sports and events on the Internet smoothly to worldwide audiences concurrently
Learn More Managed Service for Prometheus
Multi-source metrics are aggregated to monitor the status of your business and services in real time.
Learn More CloudMonitor
Automate performance monitoring of all your web resources and applications in real-time
Learn MoreMore Posts by Alibaba Cloud Native