By Qi Zhang (Sichu)
Are you still using the tedious traditional approach to examine each line of code for unearthing errors?

Fret not! As the saying goes, "Arthas keeps you from worrying about troubleshooting." Let's talk about Arthas, the magical Java diagnostics tool.
Arthas is an open-source online diagnostics tool that uses command-line interaction mode and supports Web-based diagnostics. It also provides the comprehensive Tab auto-completion feature to further facilitate problem locating and diagnostics. Arthas is a Java diagnostics tool, which is used by 99% of Alibaba developers, has earned 20,000 stars on GitHub since it became open-source more than a year ago. Instead of direct downloading, I recommend developers to use Arthas in Cloud Toolkit, which is an integrated development environment (IDE) plug-in, to implement one-click remote diagnostics.
Thanks to its powerful and comprehensive features, Arthas can do more than you can imagine. Arthas has a quick and relevant resolution to all your worries
For more information about the commands and features of Arthas, see its Official Documentation.
In the following sections, I will list several scenarios that I came across recently.
Usually, requests to the server are normal. However, during a stress test, when all CPUs on the server approach 100% utilization, the dependent services and databases did not run into a bottleneck. Why?
While running the jstack command, I just saw the stack at a certain point in time. As a result, locating the real problem becomes an issue.
How to view information about the current thread and its stack.
Use thread -n 3 -i 10000 to query the top 3 busiest threads within 10 seconds and print their stacks, which facilitates problem locating. The problem that I finally found was relatively simple: The location information, including class name, method name, and line number, is printed in the log.
Dynamically acquire code information including method name and line number. This is usually done by new Throwable() -> print Throwable stack -> extract the topmost business code in the stack -> split string to acquire information including class, method, and line number.
However, printing stacks may cause significant performance loss.

There was a time when I always came across occasional timeouts. However, logs seemed all right, and so did EagleEye traces. No database operation or HSF call was particularly slow.
The elapsed time of the requests seemed quite normal according to statistics from the monitoring system. I could not find any abnormal RT.
I thought there might be a problem with logs, but there was no evidence to support it.
I ran the ttrace command to monitor the elapsed time of each step. In addition, used conditional expressions to print detailed logs when the elapsed time exceeds a certain time.
Further, I executed the command on a machine and waited. When the timeout reoccurs, the distribution of elapsed time could be captured.

Based on the results from Arthas, I located the problem: log printing. Once I changed synchronous logs to asynchronous logs, the problem was solved.
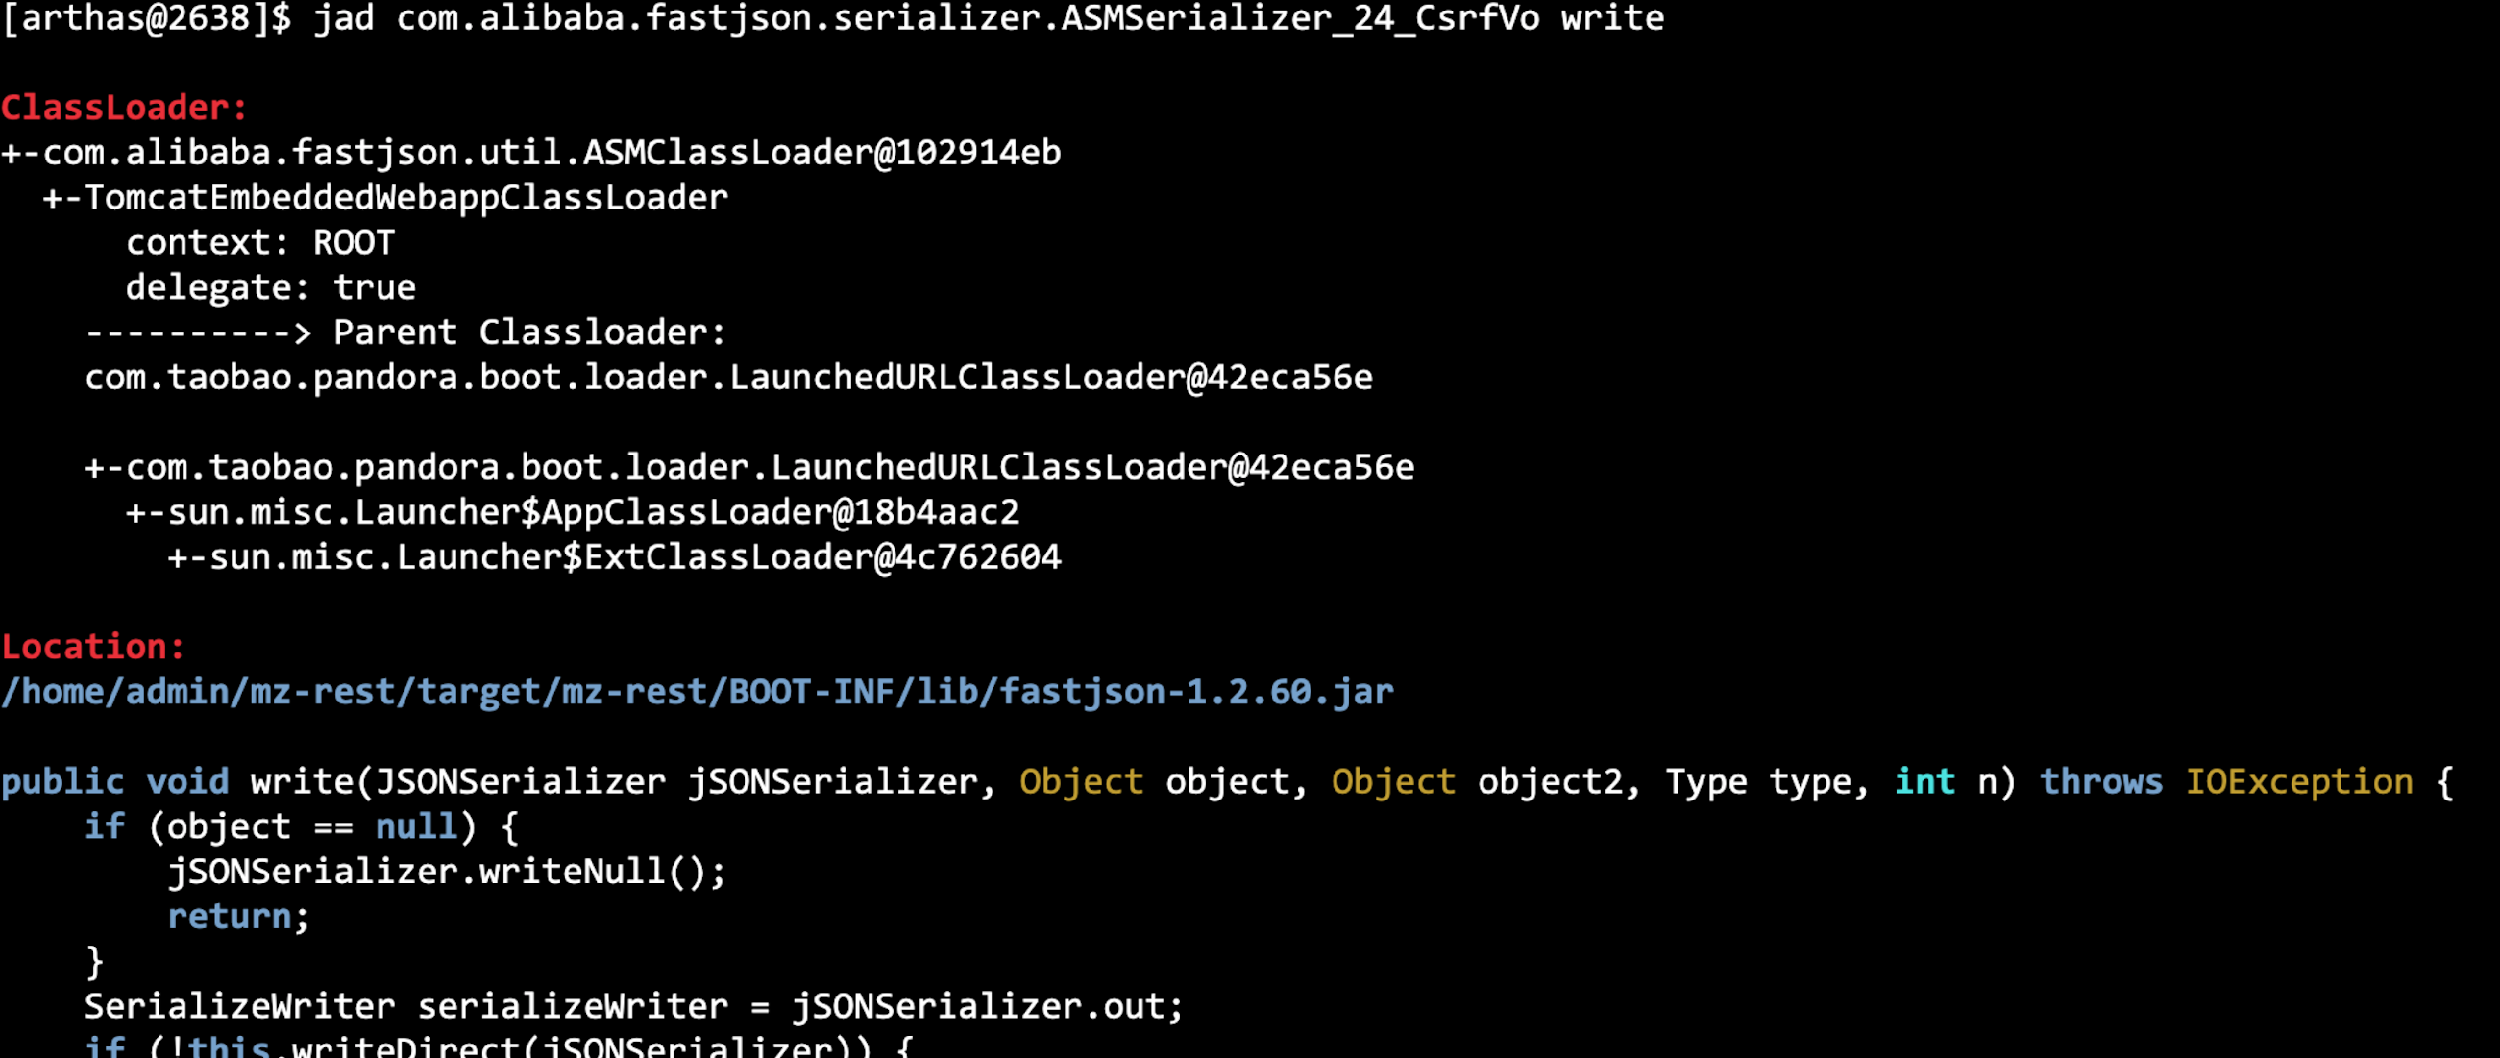
Once I came across a problem, where the output numbers during JSON serialization were not quoted. To resolve the issue, I tried to debug and examine my code in various ways and found that it was a serialization class that was generated by using ASM dynamic bytecode. Therefore, I completely gave up debugging as it wasn't effective in locating the problem.
Alternatively, it's easy to locate and troubleshoot the problem by decompiling the classes that are generated with dynamic bytecode by using the jad command of Arthas and other commands such as watch.
The jad command decompiles the source code of a given loaded class.

Also, use the mc(memory compiler) and redefine commands to update the code online. Go on, start exploring!
Do these capabilities make us omnipotent? No. Let's take a look at the following scenario.
In the troubleshooting process, I found that logs were output to the console, which caused significant performance loss. Was there any quick solution to solve the problem without publishing it?
sc -d ch.qos.logback.core.ConsoleAppender

class-info       ch.qos.logback.core.ConsoleAppender
  code-source       /home/admin/.../lib/logback-core-1.2.3.jar
  name             ch.qos.logback.core.ConsoleAppender
  isInterface       false
  isAnnotation     false
  isEnum           false
  isAnonymousClass false
  isArray           false
  isLocalClass     false
  isMemberClass     false
  isPrimitive       false
  isSynthetic       false
  simple-name       ConsoleAppender
  modifier         public
  annotation
  interfaces
  super-class       +-ch.qos.logback.core.OutputStreamAppender
                      +-ch.qos.logback.core.UnsynchronizedAppenderBase
                        +-ch.qos.logback.core.spi.ContextAwareBase
                          +-java.lang.Object
  class-loader     +-com.taobao..LaunchedURLClassLoader@58dad04a
                      +-sun.misc.Launcher$AppClassLoader@18b4aac2
                        +-sun.misc.Launcher$ExtClassLoader@58ceff1
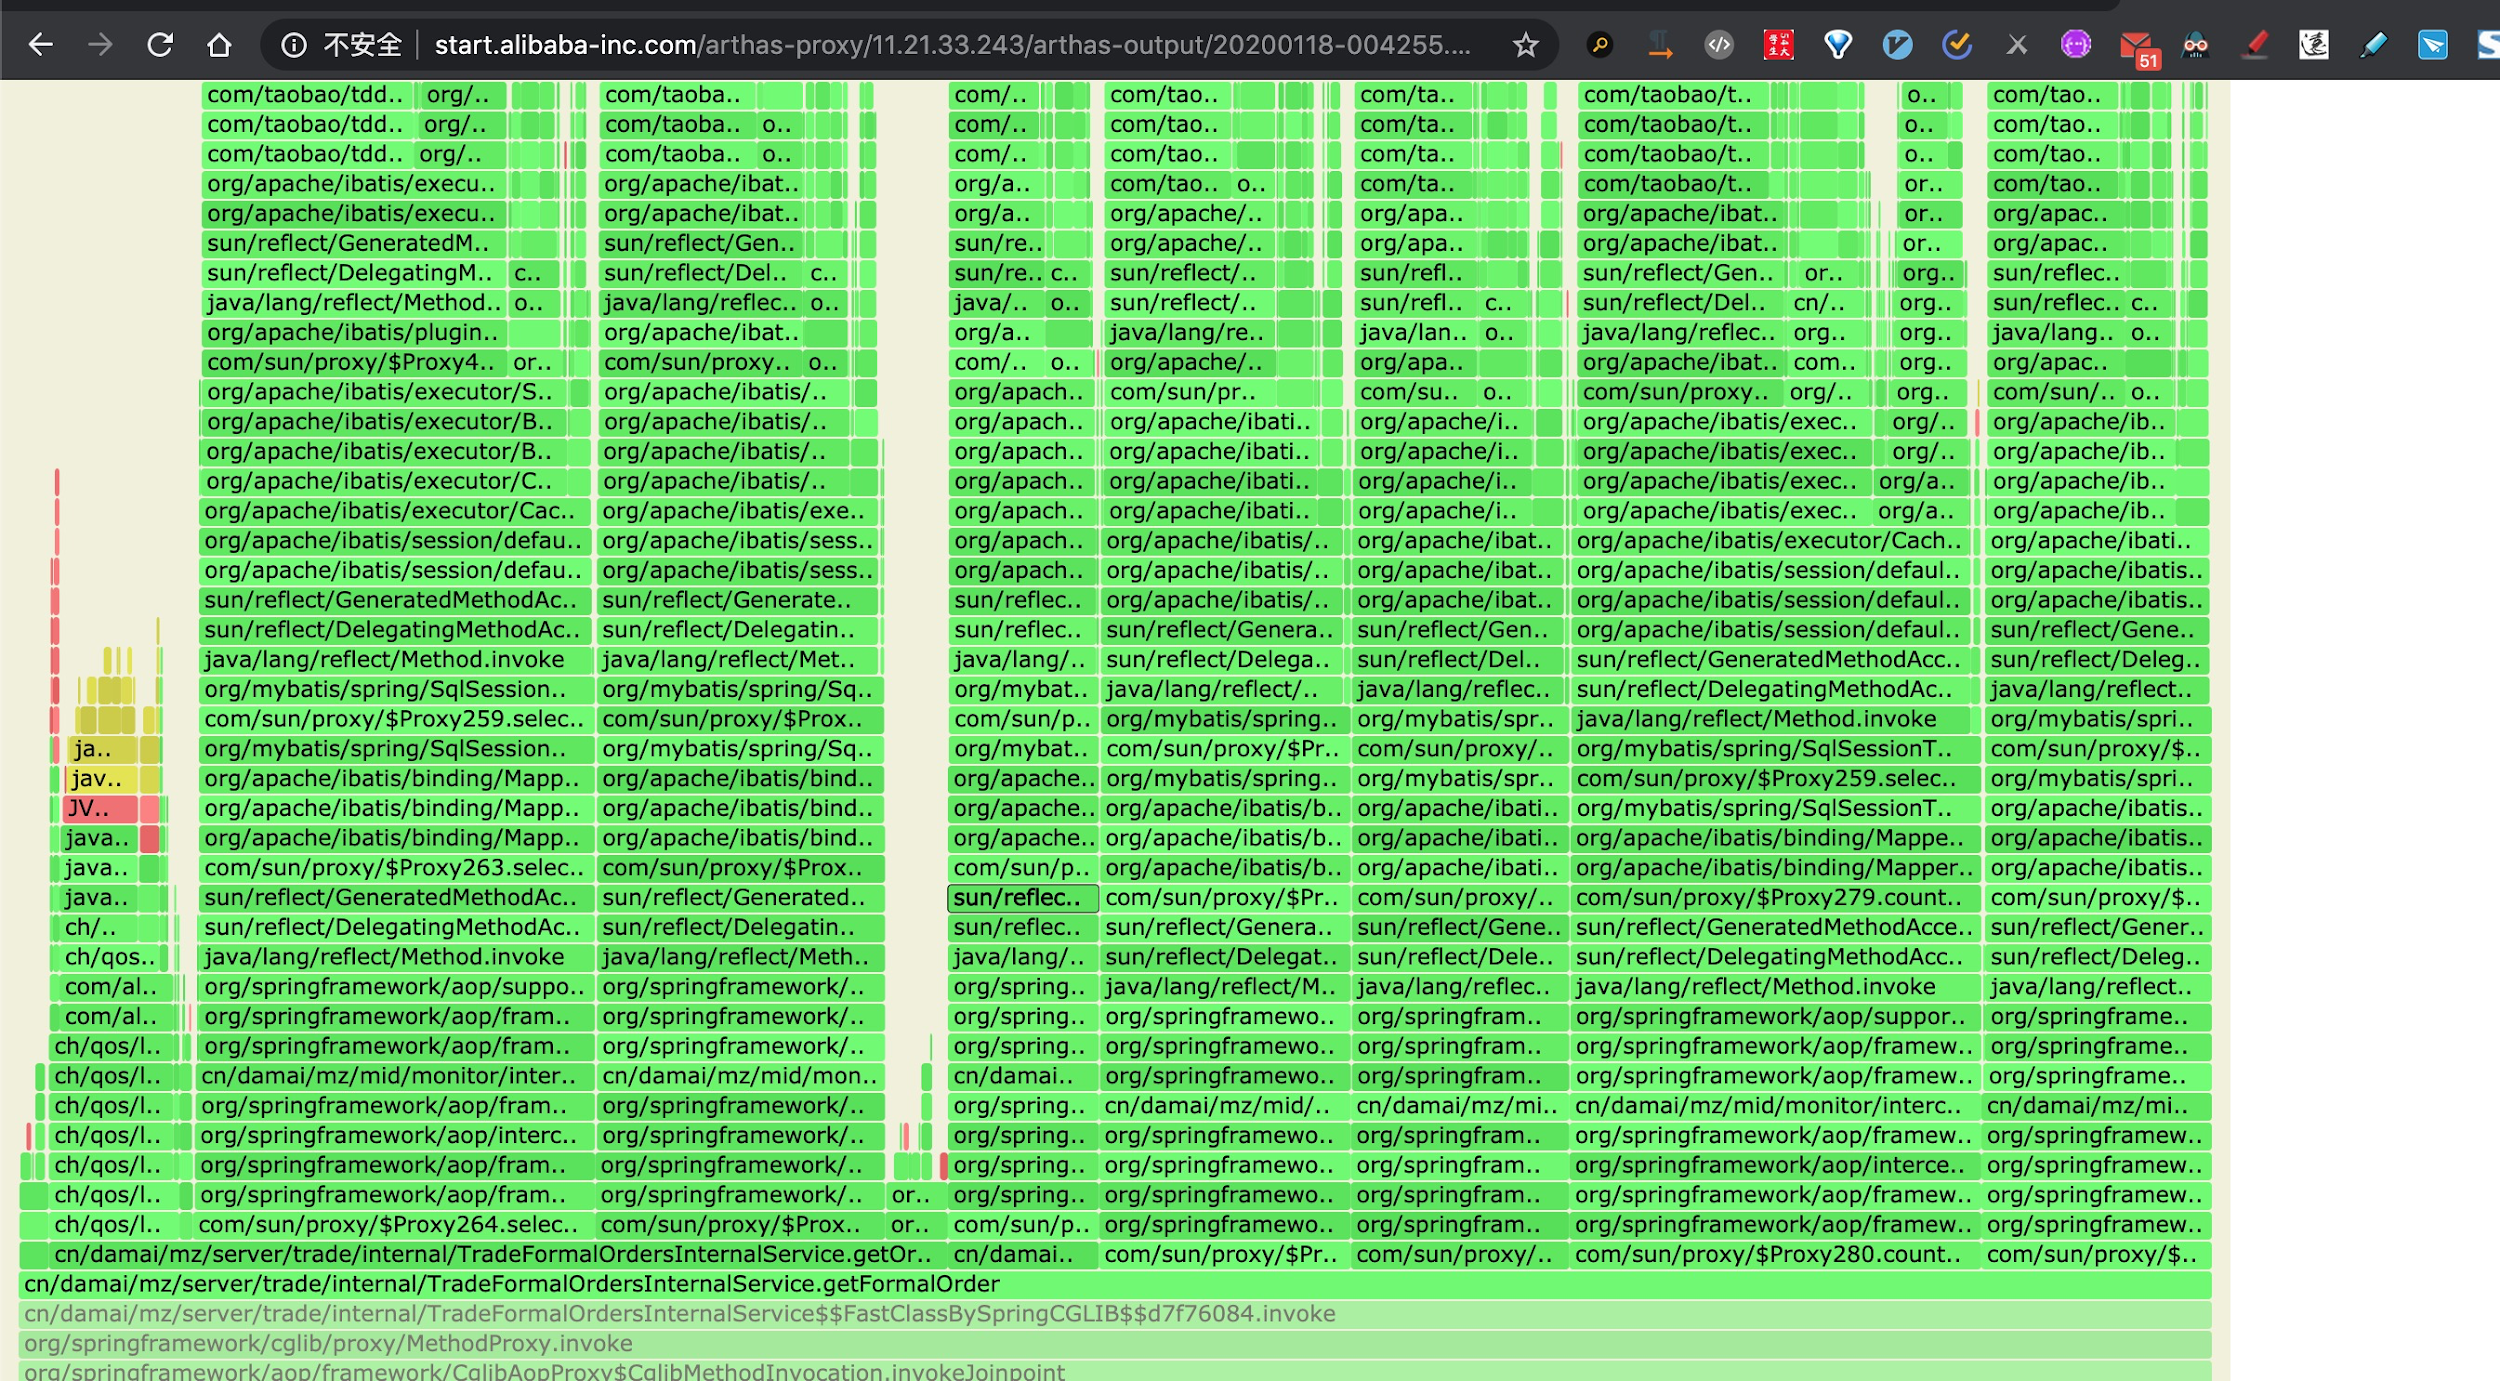
classLoaderHash 5f205aaognl -c 5f205aa '@org.slf4j.LoggerFactory@getLogger("root").aai.appenderList'1ognl -c 5f205aa '@org.slf4j.LoggerFactory@getLogger("root").aai.appenderList.remove(0)'While troubleshooting performance problems, use flame graphs, a magical tool that clearly display the statistics of elapsed time associated with each method within a period of time.

Released by Alibaba Cloud, Cloud Toolkit is a free local IDE plug-in that helps developers to efficiently develop, test, diagnose, and deploy applications. Use the plug-in to deploy local applications with one click on any server or even to the cloud, such as Elastic Compute Service (ECS), Enterprise Distributed Application Service (EDAS), Alibaba Cloud Container Service for Kubernetes (ACK), Alibaba Cloud Container Registry (ACR), and Mini Program Cloud. Also, use its built-in tools including Arthas Diagnostics, Dubbo, Terminal, File Upload, Function Compute, and MySQL Executor. In addition to IntelliJ IDEA, the mainstream version, other versions such as Eclipse, Pycharm, and Maven are also available.
We recommend using the IDEA plug-in to download Cloud Toolkit and use Arthas.
Download Arthas by using the URL: https://github.com/alibaba/arthas
Seven Challenges for Cloud-native Storage in Practical Scenarios

675 posts | 56 followers
FollowOpenAnolis - March 4, 2026
OpenAnolis - June 25, 2025
Alibaba Cloud Native Community - September 22, 2025
crane.dong - May 6, 2021
Alibaba Cloud Native Community - July 13, 2022
OpenAnolis - September 4, 2025

675 posts | 56 followers
Follow Mobile Testing
Provides comprehensive quality assurance for the release of your apps.
Learn More Container Service for Kubernetes
Alibaba Cloud Container Service for Kubernetes is a fully managed cloud container management service that supports native Kubernetes and integrates with other Alibaba Cloud products.
Learn More Penetration Test
Penetration Test is a service that simulates full-scale, in-depth attacks to test your system security.
Learn More Managed Service for Prometheus
Multi-source metrics are aggregated to monitor the status of your business and services in real time.
Learn MoreMore Posts by Alibaba Cloud Native Community