By System O&M SIG
Recently, at the Apsara Conference 2022 OpenAnolis Forum-eBPF & Linux Stability Session, Yi Zhang (the maintainer of Anolis OS Operation and Maintenance (O&M) SIG) gave a keynote speech on the SysAK System Operation and Maintenance Tool Set. The following article highlights the main points of that speech.

Hello everyone, during Apsara Conference 2021, we open-sourced the system operation and maintenance tool set SysAK in the OpenAnolis and provided a variety of diagnostic functions. As one of the main projects of System O&M SIG (Special Interest Group), over the past year, SysAK also made more upgrades to its technical architecture and application scenarios to adapt to more scenarios. Today, I will share the core technical structure and usage scenarios of the latest version. Due to time limits, I will focus on the relevant components of the monitoring mode. I will use the enhanced features of Anolis OS and SysAK to monitor difficult problems and system health.
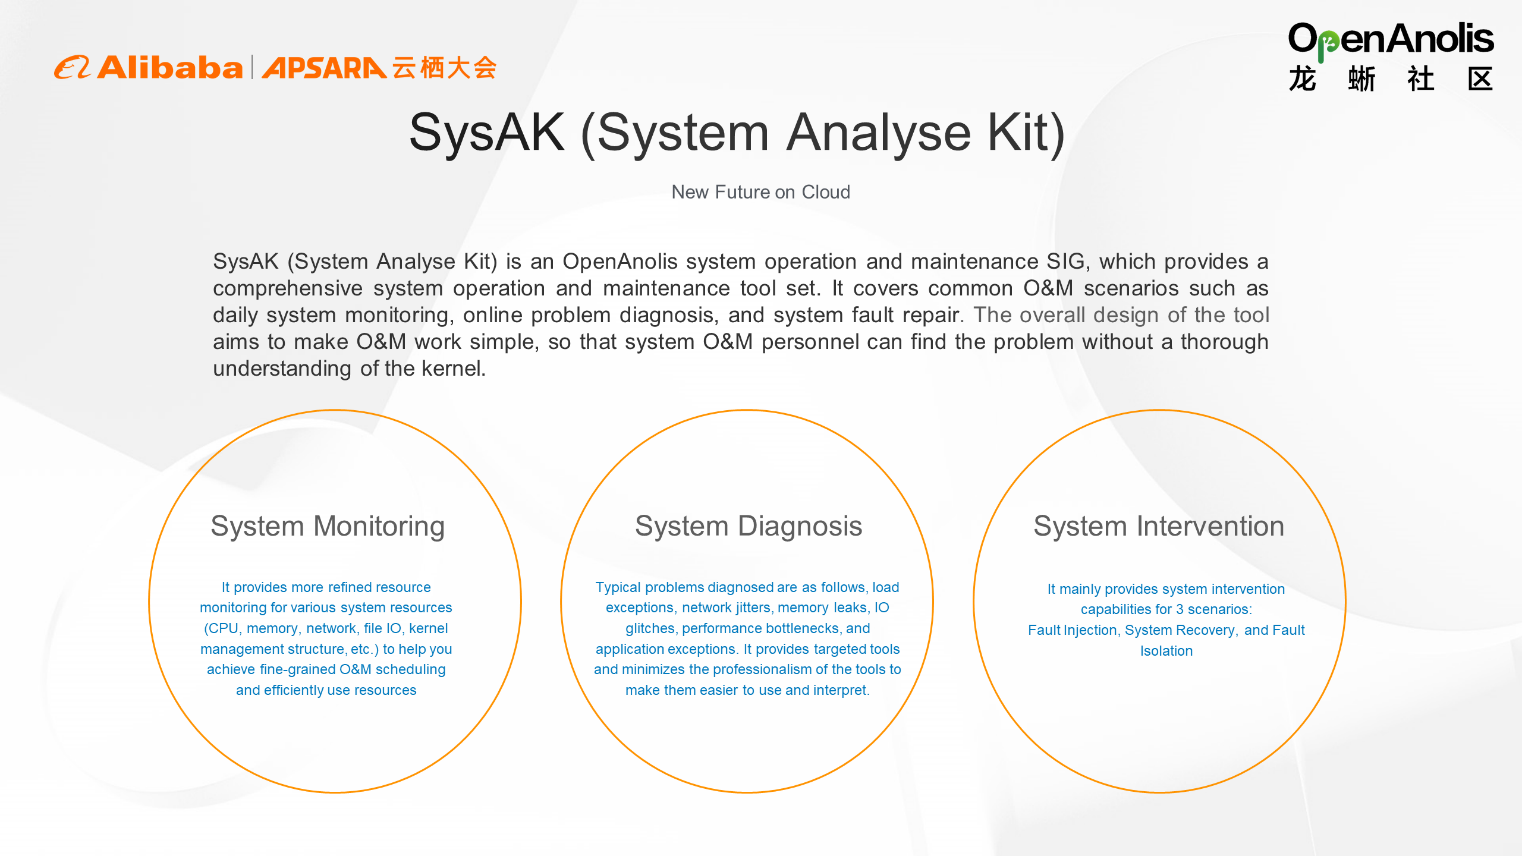
SysAK is called System Analyse Kit. Based on millions of servers' O&M experience, we provide a comprehensive system O&M tool set, covering common O&M scenarios such as daily system monitoring, online problem diagnosis, and system fault repair. It mainly includes three aspects:
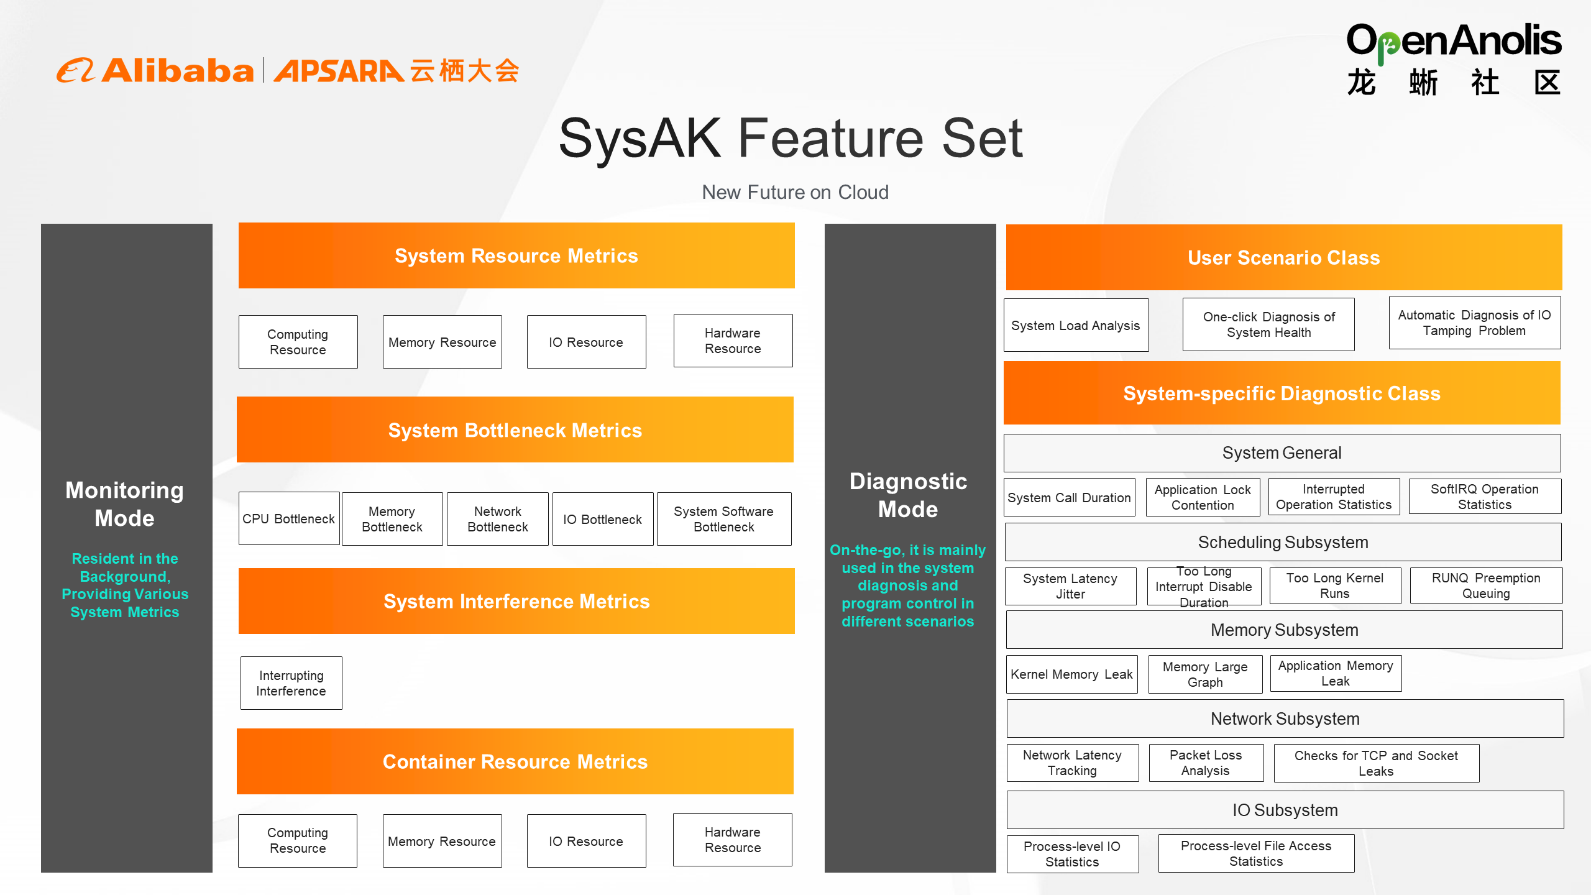
The SysAK framework includes two major modes: monitoring mode and diagnostic mode. The system resource bottleneck metrics include CPU bottlenecks, memory bottlenecks, network bottlenecks, and IO bottlenecks. You can monitor the bottlenecks to find the dependency on resources during application running and then properly schedule and allocate resources to applications based on the dependency and other data.
In addition to the four major hardware resources, the system software itself also has bottlenecks. For example, the Linux kernel system may have concurrent bottlenecks in the process of accessing various files, handles, caches, and shared resources. SysAK has also done a lot of work to address the bottleneck.
Interference is a common factor during application running, which can cause jitter or interruption. For the cloud-native trend, SysAK implements container resource visualization.
Diagnostic Mode: It detects problems in a timely manner, diagnoses them based on the root cause of the problem, and starts as usage. The following three services are supported based on user O&M scenarios:
In addition to user scenarios, we provide deeper data diagnosis for advanced technical support personnel (such as functions that take a long time to call system data, interrupted operation statistics, scheduling modules, memory modules, latency jitter, and memory leaks). We will do a special function diagnosis based on the characteristics of each subsystem.
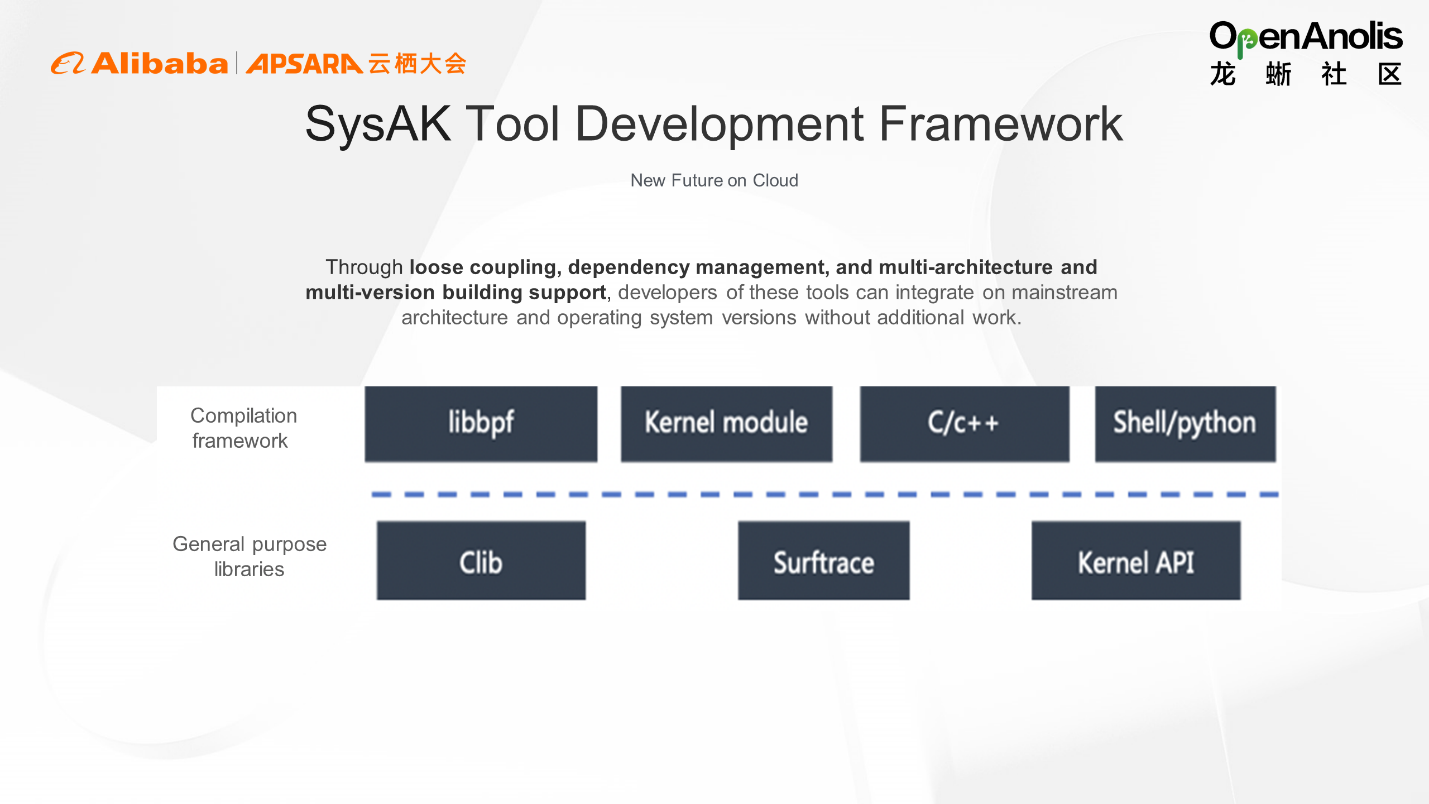
SysAK helps developers of these tools integrate mainstream architectures and operating system versions without additional work through loose coupling, dependency management, and multi-architecture and multi-version building support.
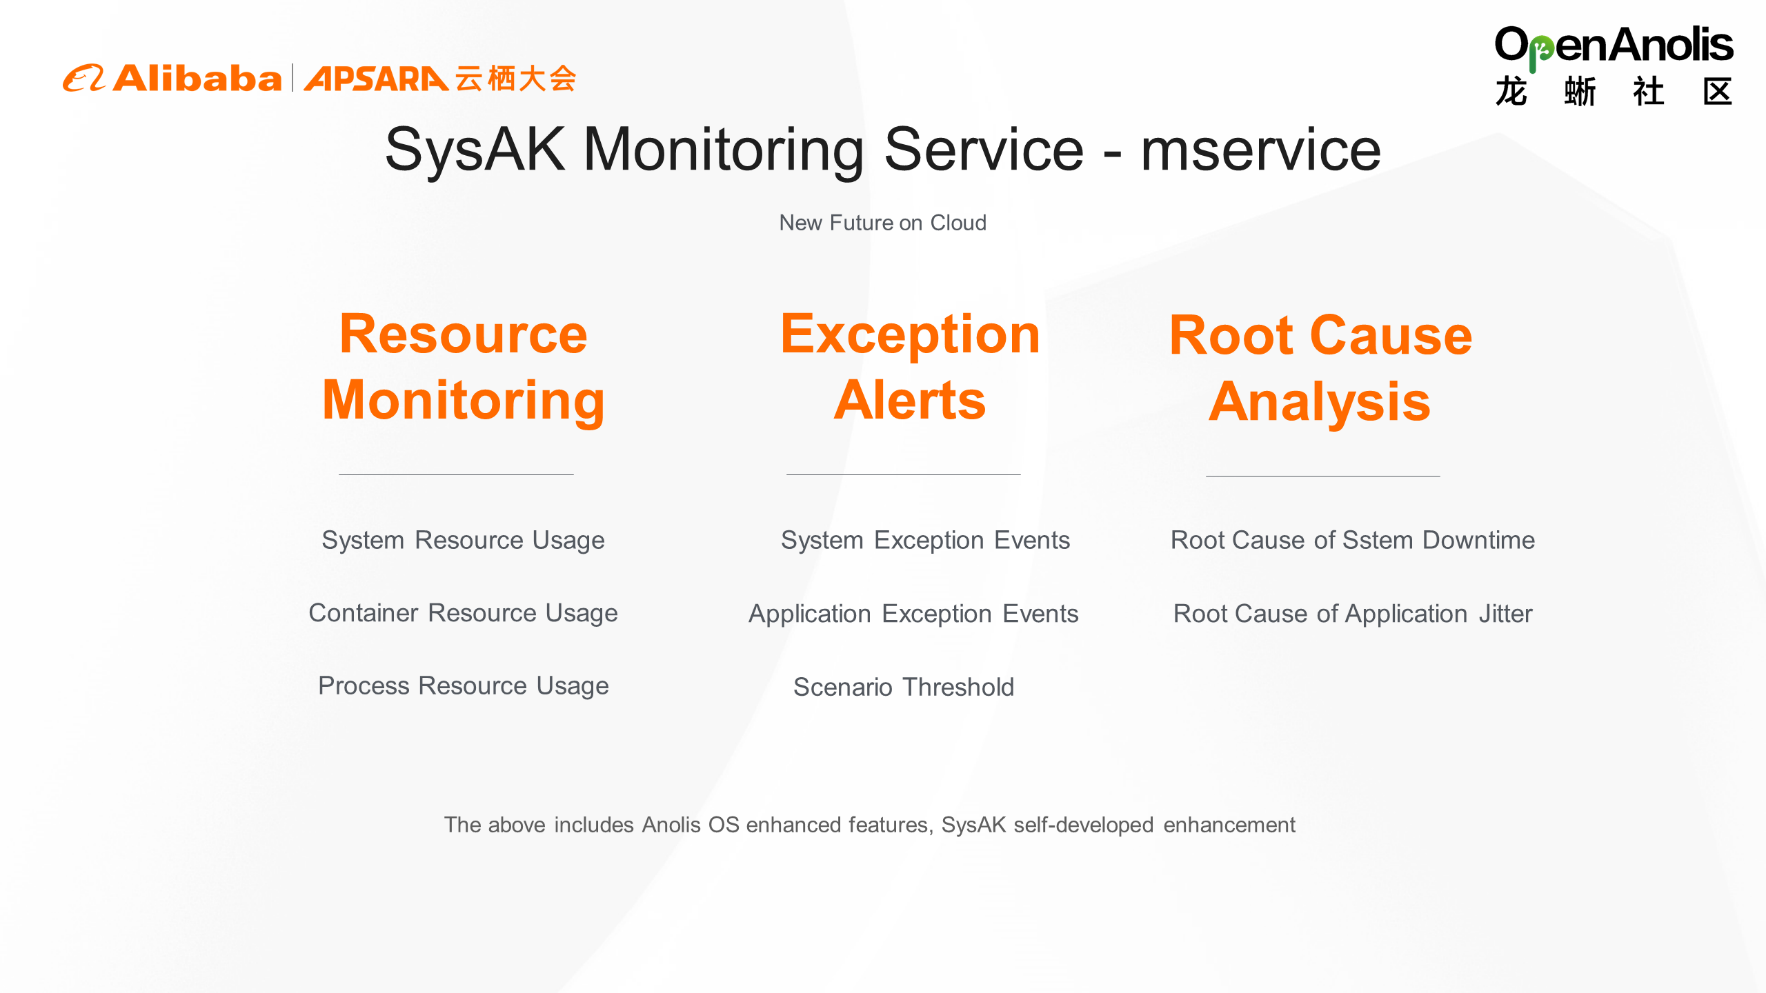
The mservice of SysAK provides three major capabilities: resource monitoring, exception alert, and root cause analysis. The exception alert function sets a special threshold, provides alerts, and performs automatic analysis.
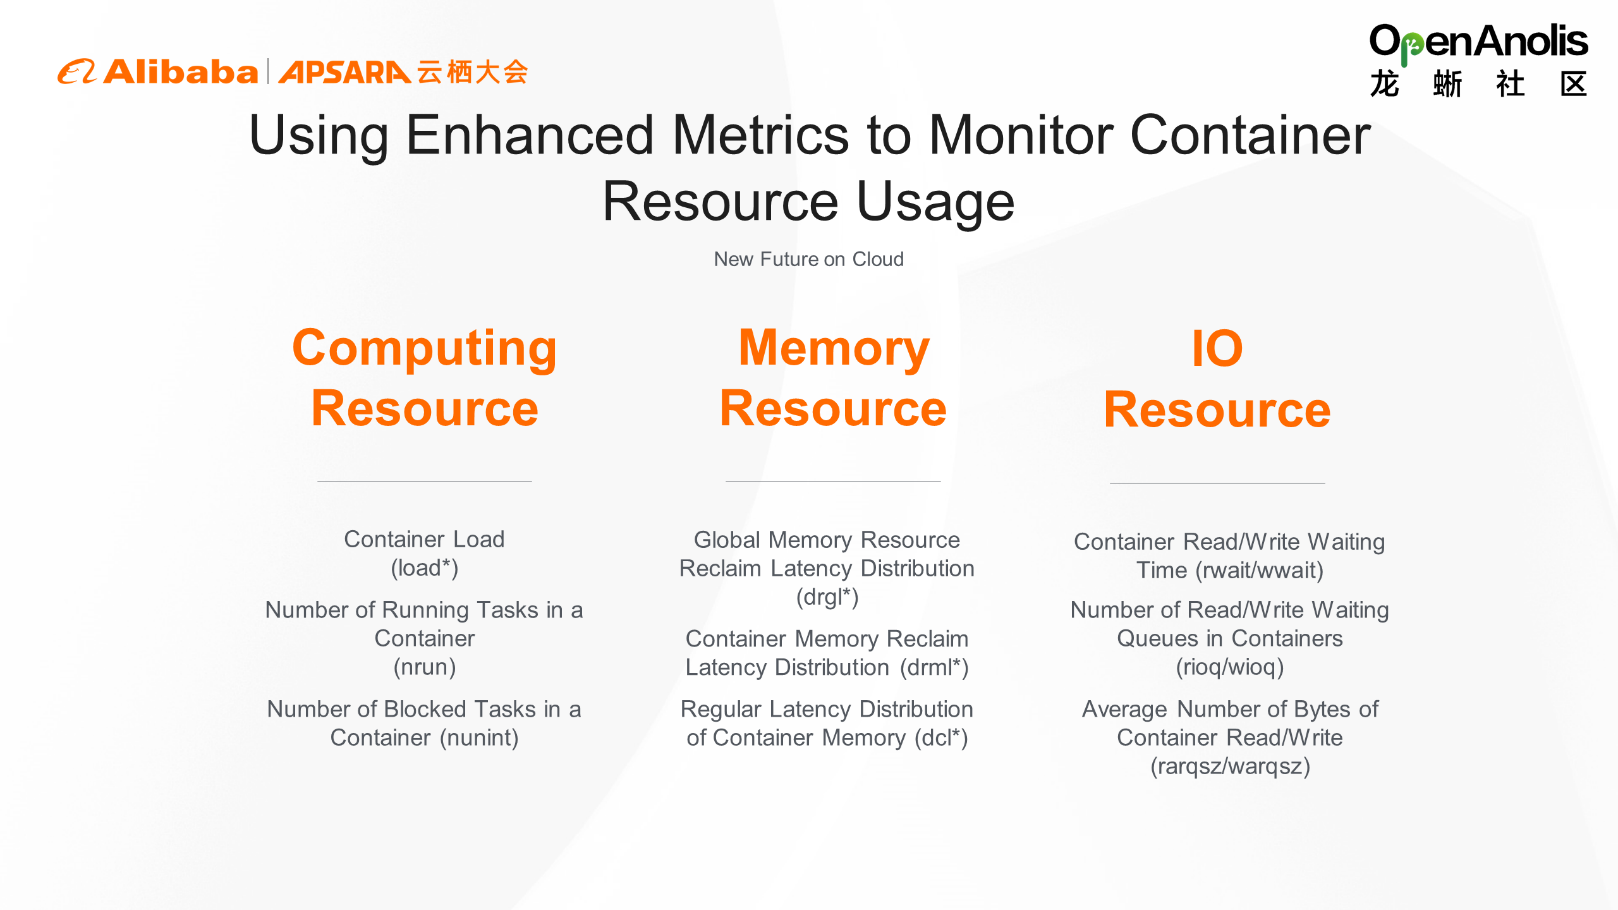
SysAK can use enhanced metrics to monitor the use of container resources, mainly relying on the enhanced features of the Anolis OS kernel and the expansion of SysAK itself.
Computing Resource: It includes the container load and the number of running and blocked tasks.
Memory Resource: Bottlenecks may frequently occur during memory usage, and enhanced monitoring is mainly for latency. Memory reclaim latency includes global memory reclaim and container memory reclaim, affecting the service running status of containers. Therefore, we make statistics on the distribution of reclaim latency and the number of times of regulation. Based on the results, we determine whether the container business encounters bottlenecks.
IO Resource: It includes the wait time, number of queues, and average number of bytes in container read and write.
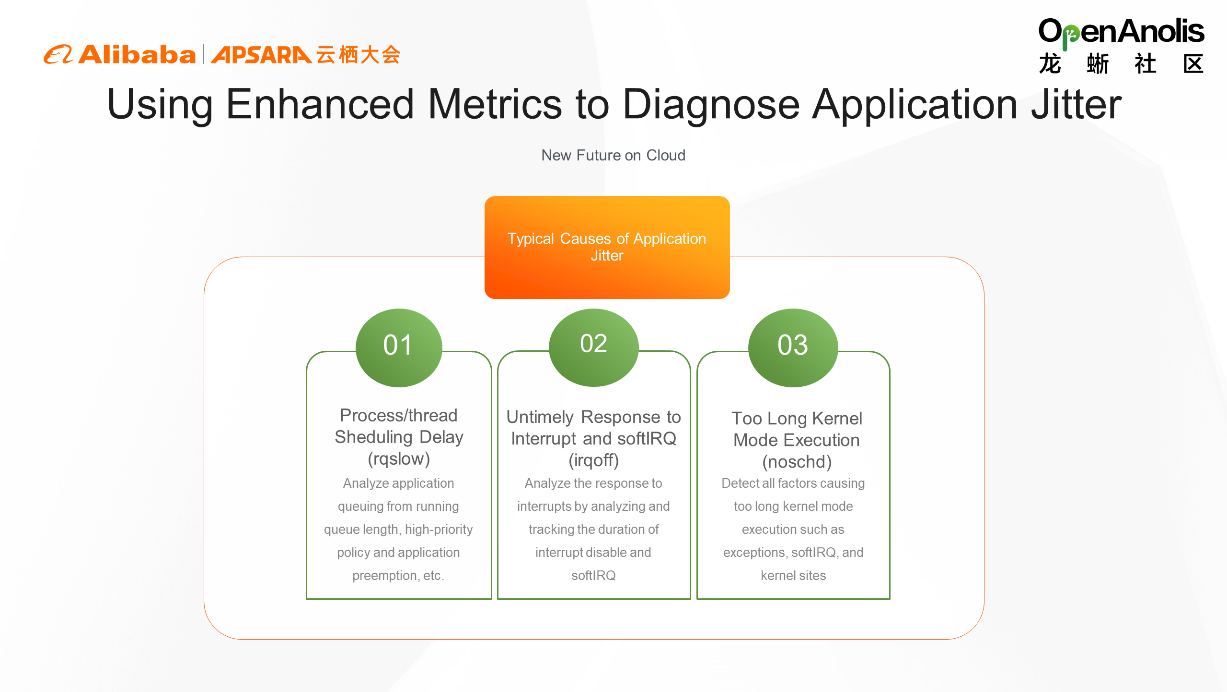
Jitter is an occasional problem in daily O&M. However, it is difficult to collect actual root cause data in the occasional process. If there is too much data collection, the overall system performance will be affected. However, too little collection is not enough to analyze the root cause of the problem. The causes of service jitter can be summarized into the following three causes:
The three causes above can cover the root causes of 70%-80% of jitter. Therefore, detection on them can virtually solve the jitter problem.
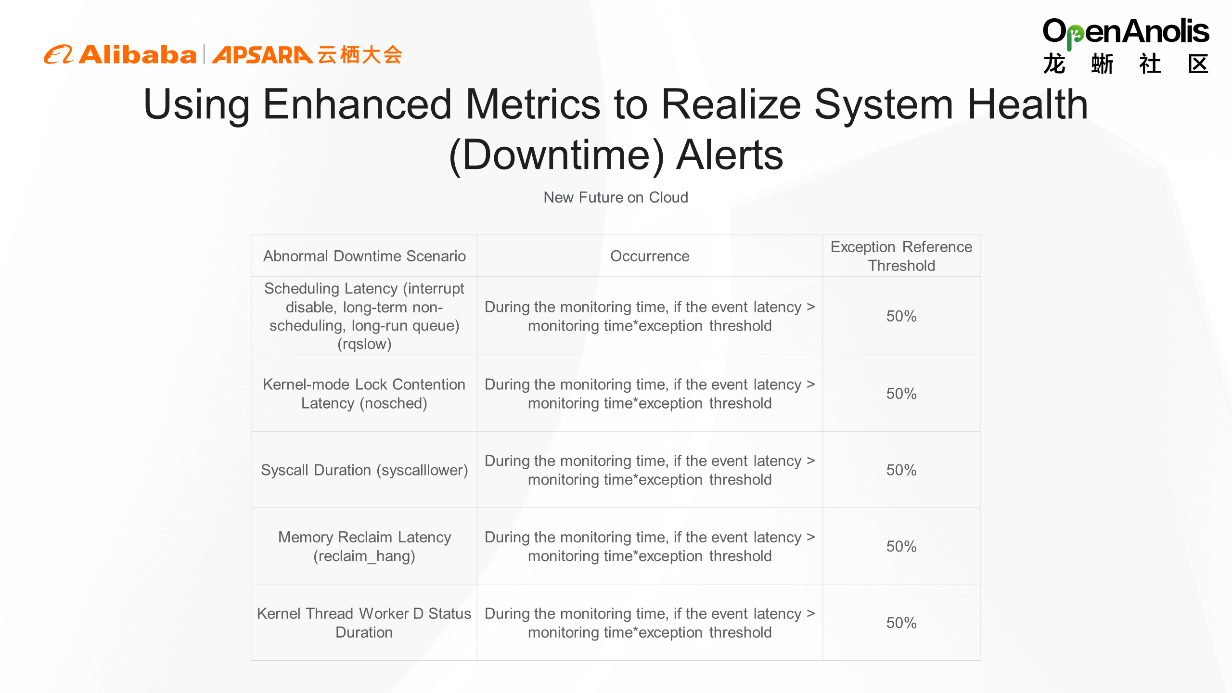
SysAK is also enhanced for system health alerts.
For example, the application does not jitter, but suddenly slows down, which will cause the system to enter an unavailable state in the long run, such as downtime. Downtime causes great impacts, and most of them are not recoverable. Before that, an early warning can be made by various means. For example, check the impact metrics of downtime through the algorithm to determine whether the downtime will occur, and do the health prediction in advance. The main metrics include scheduling latency, kernel lock contention latency, and memory reclaim latency.
Combined with past experience, we set the current exception reference threshold at 50%.
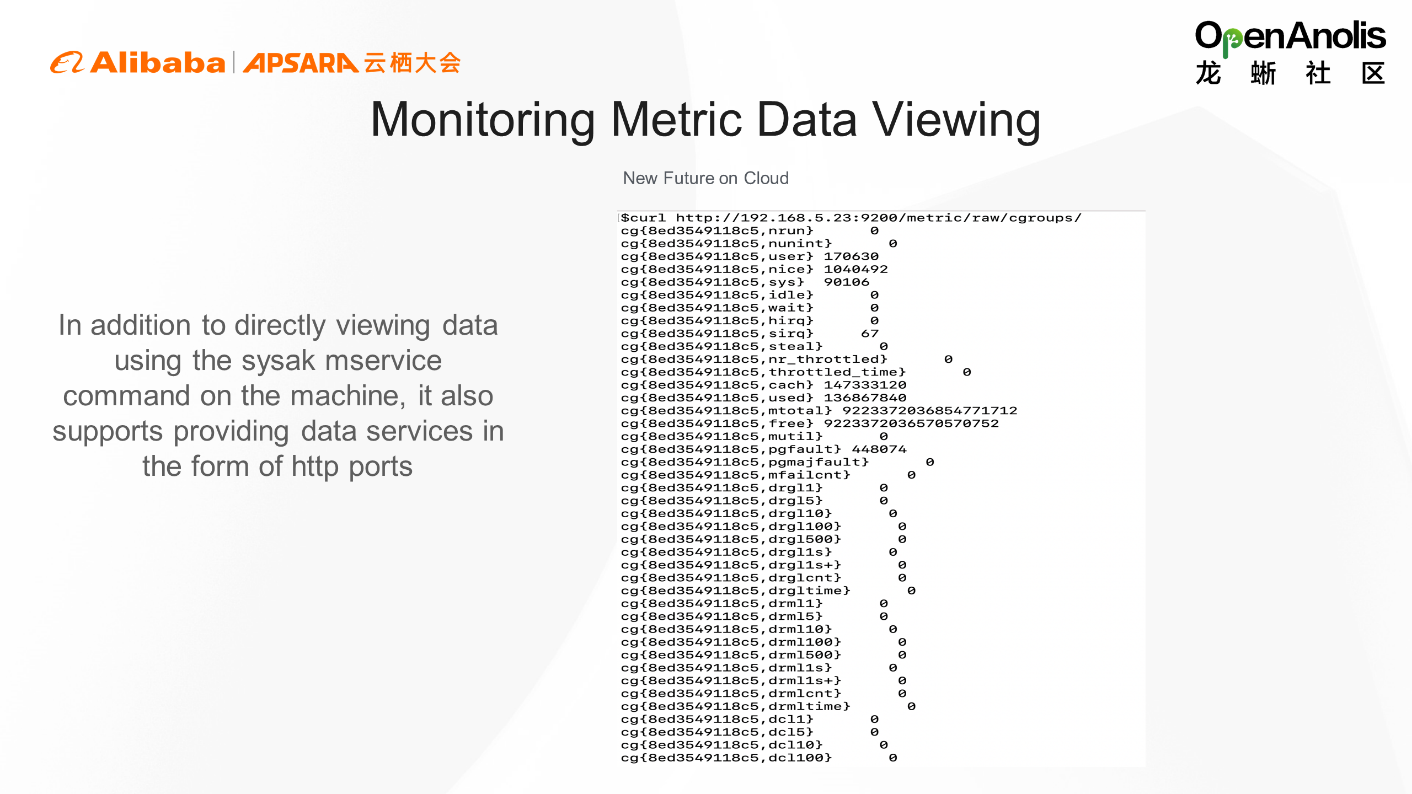
SysAK is mainly used for standalone diagnosis and monitoring. In addition to using SysAK mservice commands to directly view data on the machine, SysAK supports providing data services in the form of http ports, as shown in the figure above. A graphical display based on the data is also supported.
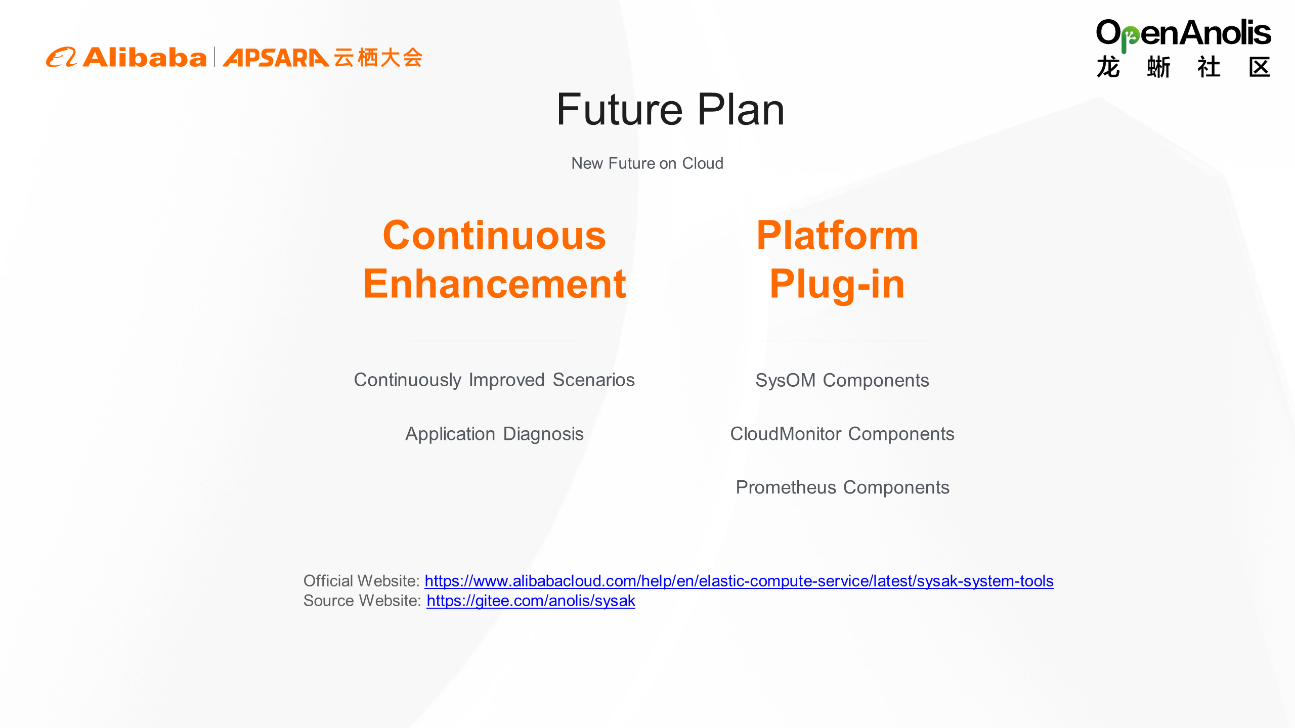
In the future, in addition to improving the usage scenarios of the tool itself, we will continue to enhance other capabilities of SysAK. Currently, SysAK can only perform diagnosis at the system level. In the future, we will consider performing diagnostics at the application level to provide more data for application diagnosis.
In addition, SysAK is open-source in OpenAnolis. We hope more developers will join us to develop O&M. We also hope the SysAK tool will continue to develop as a technical data collection feature for O&M platforms. Therefore, we will focus on platform plug-ins. Currently, it has been used as a component of SysOM and CloudMonitor. In the future, it will be used as a plug-in extension of Prometheus to meet more scenarios.
Usage Notes of SysAK: https://www.alibabacloud.com/help/en/elastic-compute-service/latest/sysak-system-tools
System O&M SIG: https://openanolis.cn/sig/sysom
Source Website: https://gitee.com/anolis/sysak

101 posts | 6 followers
FollowOpenAnolis - May 26, 2022
OpenAnolis - September 21, 2022
Alibaba Cloud Community - August 12, 2022
OpenAnolis - August 9, 2022
OpenAnolis - October 26, 2022
Alibaba Cloud Community - May 27, 2022

101 posts | 6 followers
Follow Bastionhost
A unified, efficient, and secure platform that provides cloud-based O&M, access control, and operation audit.
Learn More Managed Service for Grafana
Managed Service for Grafana displays a large amount of data in real time to provide an overview of business and O&M monitoring.
Learn More Apsara Stack
Apsara Stack is a full-stack cloud solution created by Alibaba Cloud for medium- and large-size enterprise-class customers.
Learn More CloudOps Orchestration Service
CloudOps Orchestration Service is an automated operations and maintenance (O&M) service provided by Alibaba Cloud.
Learn MoreMore Posts by OpenAnolis