By Wu Chong
This article summarizes the content of a recent livestream session focused on the actual demonstration of building streaming applications based on Flink SQL. It also incorporates some improvements to the broadcast content, for instance, the simplification of the preparation process by using Docker Compose to install all components except Flink. Find the complete video of the live presentation in Chinese here.
Flink 1.10.0 is just released and provides many exciting new features. In particular, the Flink SQL module is developing very fast. Therefore, this article specifically looks at how to use Flink SQL to quickly build streaming applications from a practical point of view.
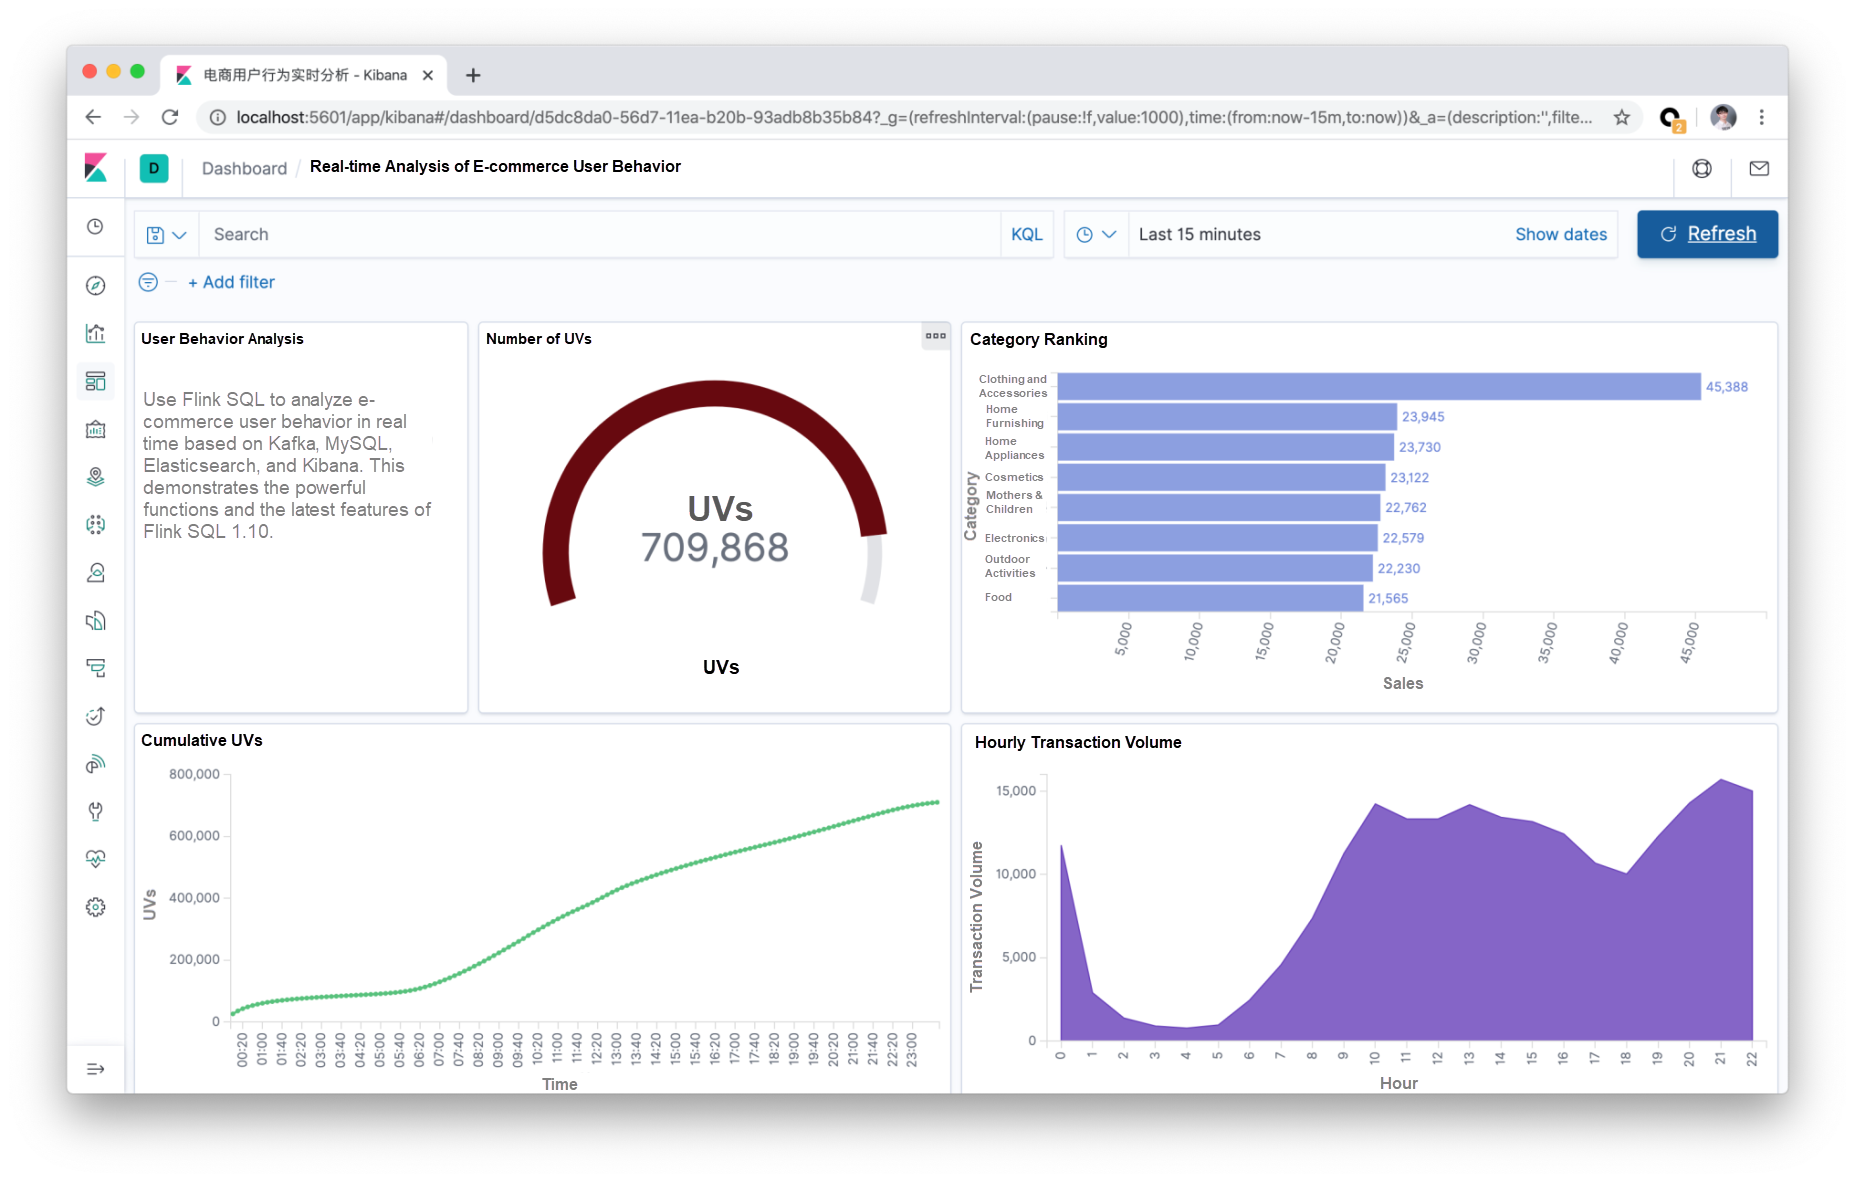
This article describes how to use Flink SQL to analyze e-commerce user behavior in real-time based on Kafka, MySQL, Elasticsearch, and Kibana. All procedures in this article are performed on the Flink SQL CLI. The entire process only involves SQL plain text, without a single line of Java or Scala code or IDE installation. The final result of this demo is shown in the following figure:
Prepare a Linux or MacOS computer with Docker and Java 8 installed.
The components required in this demo are all orchestrated in containers, so just use docker-compose to start them with one click. Run the wget command to automatically download the docker-compose.yml file, or manually download the file.
mkdir flink-demo; cd flink-demo;
wget https://raw.githubusercontent.com/wuchong/flink-sql-demo/master/docker-compose.yml
Docker Compose contains the following containers:
docker-compose.yml to adjust the generation rate (which takes effect after docker compose is restarted).Before starting containers, we recommend modifying the Docker configuration to update the resource specification to 4 GB memory and 4 cores. To start all containers, run the following command in the directory that contains docker-compose.yml.
docker-compose up -dThis command automatically starts all the containers defined in the Docker Compose configuration in detached mode. Run docker ps to check whether the five containers start properly. Also, enter http://localhost:5601/ in a browser to check whether Kibana is running properly.
Run the following command to stop all containers:
docker-compose downWe recommend manually downloading and installing Flink, instead of automatically starting Flink through Docker. This gives a more intuitive understanding of the components, dependencies, and scripts of Flink.
1) Download and decompress the following Flink 1.10.0 installation package (decompress the package to the flink-1.10.0 directory): https://www.apache.org/dist/flink/flink-1.10.0/flink-1.10.0-bin-scala_2.11.tgz.
2) Go to the flink-1.10.0 directory by running cd flink-1.10.0.
3) Run the following command to download the JAR dependency package and copy it to the lib/ directory. Manually download and copy the package. Operations are dependent on the implementation of each connector.
-P ./lib/ https://repo1.maven.org/maven2/org/apache/flink/flink-json/1.10.0/flink-json-1.10.0.jar | \wget -P ./lib/ https://repo1.maven.org/maven2/org/apache/flink/flink-sql-connector-kafka_2.11/1.10.0/flink-sql-connector-kafka_2.11-1.10.0.jar | \wget -P ./lib/ https://repo1.maven.org/maven2/org/apache/flink/flink-sql-connector-elasticsearch7_2.11/1.10.0/flink-sql-connector-elasticsearch7_2.11-1.10.0.jar | \wget -Pz ./lib/ https://repo1.maven.org/maven2/org/apache/flink/flink-jdbc_2.11/1.10.0/flink-jdbc_2.11-1.10.0.jar | \wget -P ./lib/ https://repo1.maven.org/maven2/mysql/mysql-connector-java/5.1.48/mysql-connector-java-5.1.48.jar 4) In conf/flink-conf.yaml, set taskmanager.numberOfTaskSlots to 10 as multiple tasks will run at once.
5) Run ./bin/start-cluster.sh to start the cluster.
If the operation succeeds, access the Flink Web UI at http://localhost:8081. The number of available slots is 10.

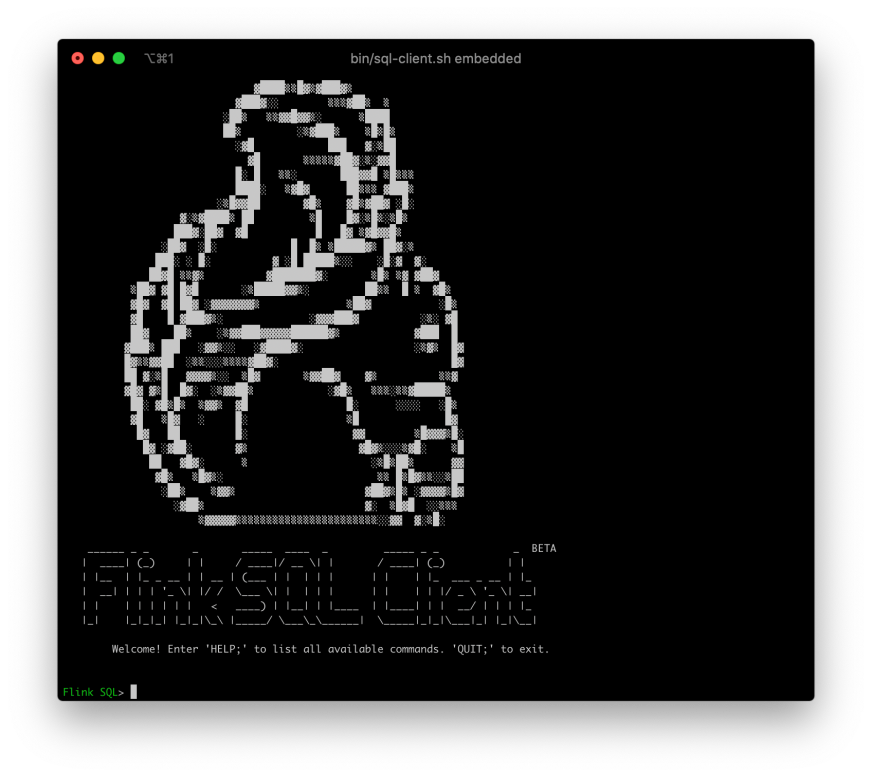
6) Run bin/sql-client.sh embedded to start the SQL CLI. The following squirrel welcome page will appear.
After the Datagen container is started, it will continuously write data to Kafka's user_behavior topic. This data contains the user behavior for November 27, 2017 (including the click, purchase, additional purchase, and like behaviors). Each row represents a user behavior, with the user ID, product ID, product category ID, behavior type, and time in JSON format. Note that this raw dataset is from the Alibaba Cloud Tianchi public dataset.
In the directory that contains docker-compose.yml, run the following command to view the first 10 data entries generated in the Kafka cluster:
docker-compose exec kafka bash -c 'kafka-console-consumer.sh --topic user_behavior --bootstrap-server kafka:9094 --from-beginning --max-messages 10'
{"user_id": "952483", "item_id":"310884", "category_id": "4580532", "behavior": "pv", "ts": "2017-11-27T00:00:00Z"}
{"user_id": "794777", "item_id":"5119439", "category_id": "982926", "behavior": "pv", "ts": "2017-11-27T00:00:00Z"}
⋯
After obtaining an available data source, use DDL to create and connect to the topic in this Kafka cluster. Run the DDL on the Flink SQL CLI.
CREATE TABLE user_behavior (
    user_id BIGINT,
    item_id BIGINT,
    category_id BIGINT,
    behavior STRING,
    ts TIMESTAMP(3),
    proctime as PROCTIME(),   -- 通过计算列产生一个处理时间列
    WATERMARK FOR ts as ts - INTERVAL '5' SECOND  -- 在ts上定义watermark,ts成为事件时间列
) WITH (
    'connector.type' = 'kafka',  -- 使用 kafka connector
    'connector.version' = 'universal',  -- kafka 版本,universal 支持 0.11 以上的版本
    'connector.topic' = 'user_behavior',  -- kafka topic
    'connector.startup-mode' = 'earliest-offset',  -- 从起始 offset 开始读取
    'connector.properties.zookeeper.connect' = 'localhost:2181',  -- zookeeper 地址
    'connector.properties.bootstrap.servers' = 'localhost:9092',  -- kafka broker 地址
    'format.type' = 'json'  -- 数据源格式为 json
);
The above snippet declares five fields based on the data format. In addition, it uses the computed column syntax and built-in PROCTIME() function to declare a virtual column that generates the processing time. It also uses the WATERMARK syntax to declare the watermark policy in the ts field (a 5-second disorder is tolerated.) Therefore, the ts field becomes the event time column. For more information about time attributes and DDL syntax, see the following official documents:
After creating a Kafka table on the SQL CLI, run show tables; and describe user_behavior; to view registered tables and table details, respectively. Also, run the command SELECT * FROM user_behavior; directly on the SQL CLI to preview the data (press q to exit.)
Next, let's learn more about Flink SQL in three actual scenarios.
First, create an Elasticsearch (ES) result table on the SQL CLI. In this case, save two pieces of data: hour and transaction volume.
CREATE TABLE buy_cnt_per_hour (
    hour_of_day BIGINT,
    buy_cnt BIGINT
) WITH (
    'connector.type' = 'elasticsearch', -- 使用 elasticsearch connector
    'connector.version' = '6',  -- elasticsearch 版本,6 能支持 es 6+ 以及 7+ 的版本
    'connector.hosts' = 'http://localhost:9200',  -- elasticsearch 地址
    'connector.index' = 'buy_cnt_per_hour',  -- elasticsearch 索引名,相当于数据库的表名
    'connector.document-type' = 'user_behavior', -- elasticsearch 的 type,相当于数据库的库名
    'connector.bulk-flush.max-actions' = '1',  -- 每条数据都刷新
    'format.type' = 'json',  -- 输出数据格式 json
    'update-mode' = 'append'
);
In Elasticsearch, there is no need to create a buy_cnt_per_hour index in advance. Instead, the Flink Job automatically creates the index.
The hourly transaction volume refers to the number of "buy" user behaviors in each hour. Therefore, the TUMBLE window function is required to implement the hourly window. Then, each window collects the number of "buy" events separately. To implement this, filter out the "buy" data first and then run COUNT(*).
INSERT INTO buy_cnt_per_hour
SELECT HOUR(TUMBLE_START(ts, INTERVAL '1' HOUR)), COUNT(*)
FROM user_behavior
WHERE behavior = 'buy'
GROUP BY TUMBLE(ts, INTERVAL '1' HOUR);
Here, use the built-in HOUR function to extract the value for each hour in the day from a TIMESTAMP column. Use INSERT INTO to continuously insert query results into the es result table defined in the previous section. The ES result table can be seen as a materialized view of the query. For more information about window aggregation, see the following link: https://ci.apache.org/projects/flink/flink-docs-release-1.10/dev/table/sql/queries.html#group-windows
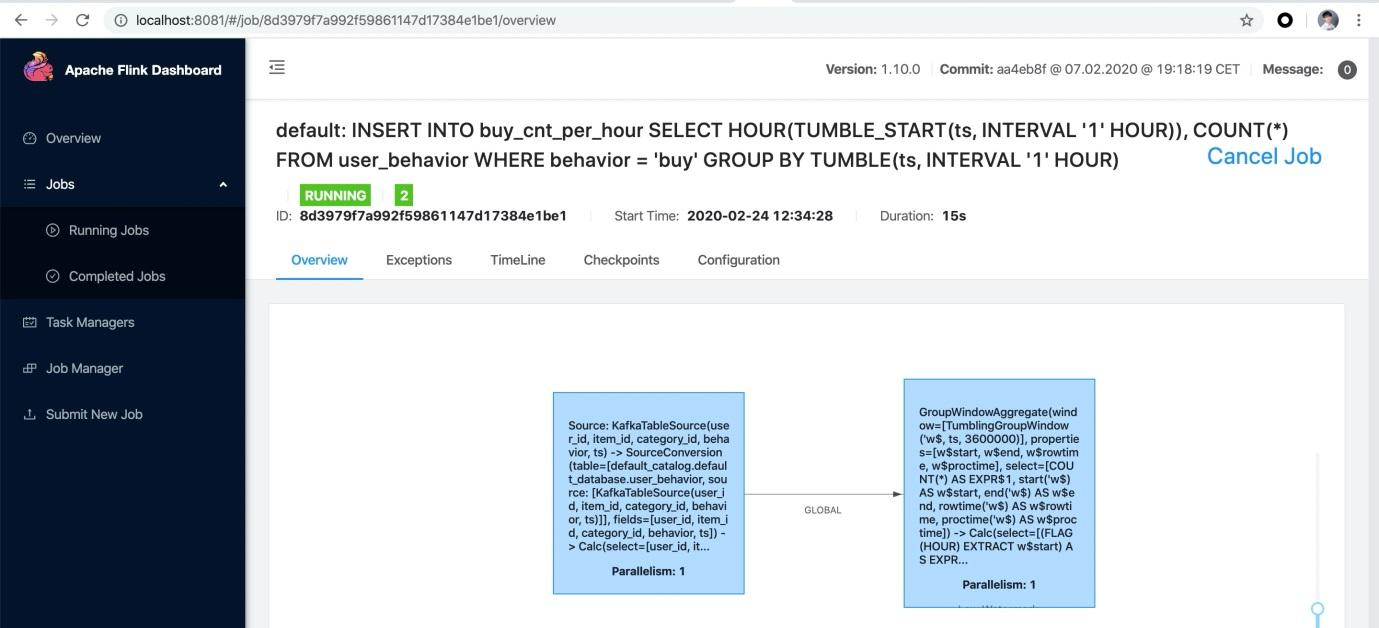
After running the preceding query on the Flink SQL CLI, observe the submitted task on the Flink Web UI. This task is a streaming task and therefore runs continuously.
Sart the Kibana container through Docker Compose. Access Kibana at http://localhost:5601. First, configure an index pattern by clicking "Management" in the left-side toolbar and find "Index Patterns". Next, click "Create Index Pattern" and enter the full index name "buy_cnt_per_hour" to create the index pattern. After creating the index pattern, Kibana will perceive the index and allows to explore the data.
Click "Discovery" in the left-side toolbar. Kibana lists the content of the created index.

Next, create a dashboard to display various views. Click "Dashboard" on the left side of the page to create a dashboard named "User behavior log analysis". Then, click "Create New" to create a new view. Select "Area" (area chart), select the "buy_cnt_per_hour" index, and draw the transaction volume area chart according to the configuration on the left in the following screenshot. Then, save it as "Transaction volume per hour".
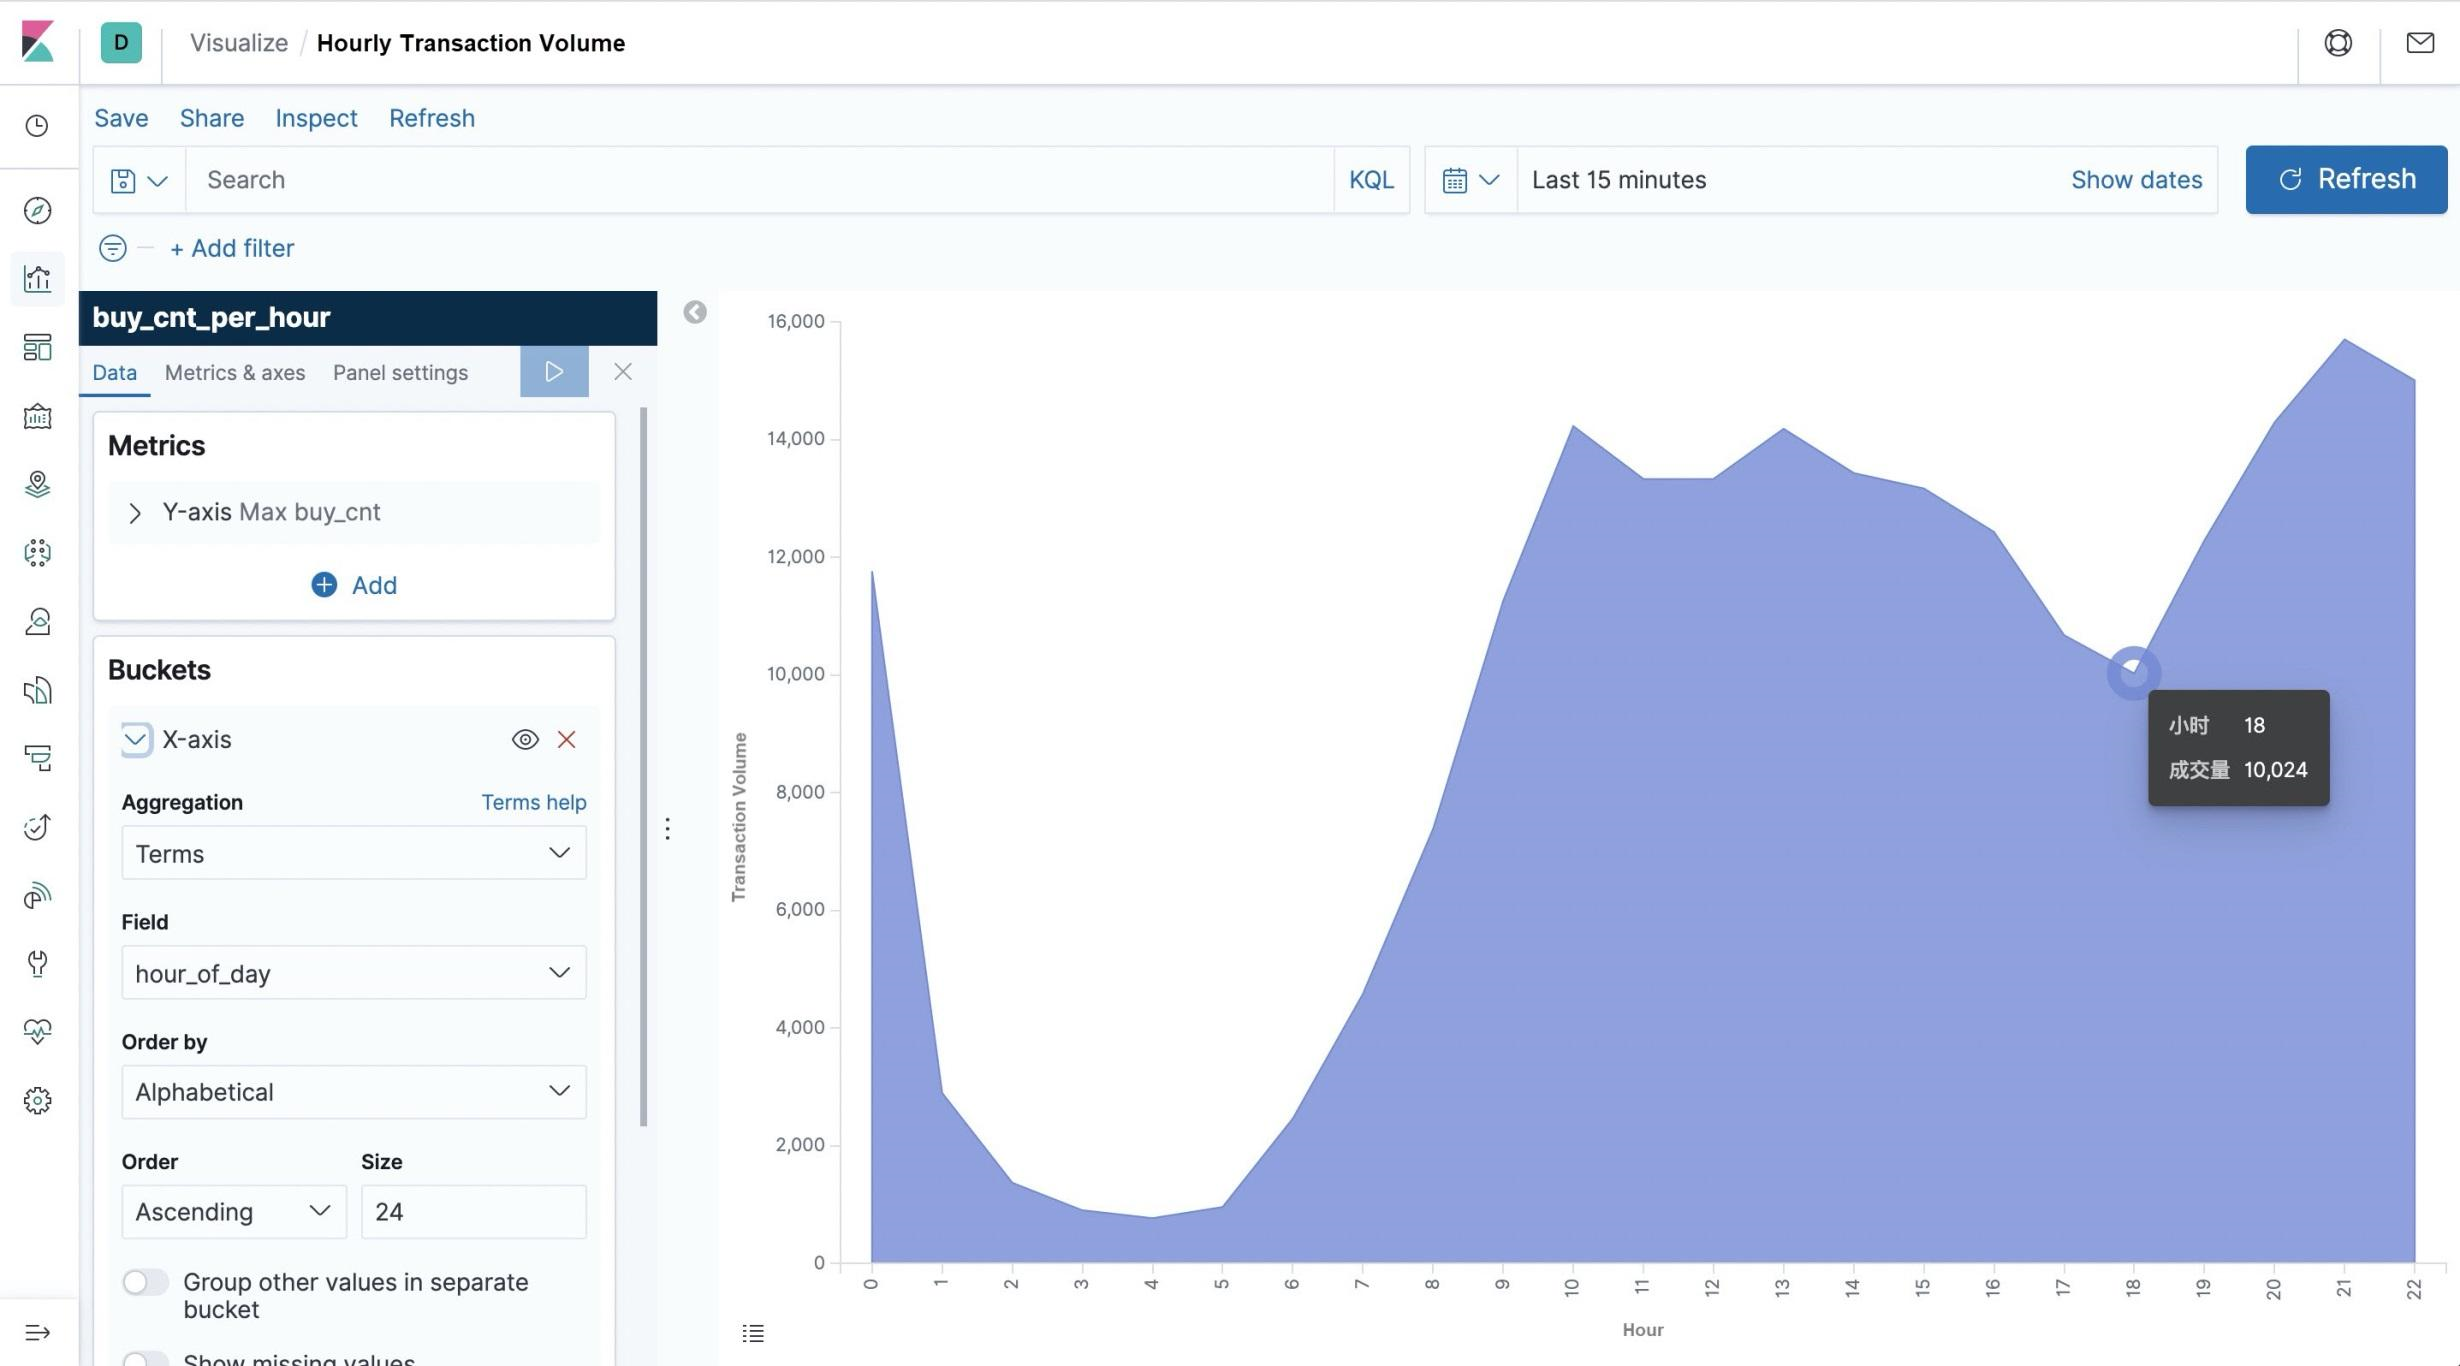
Note that the early morning has the fewest transactions during the day.
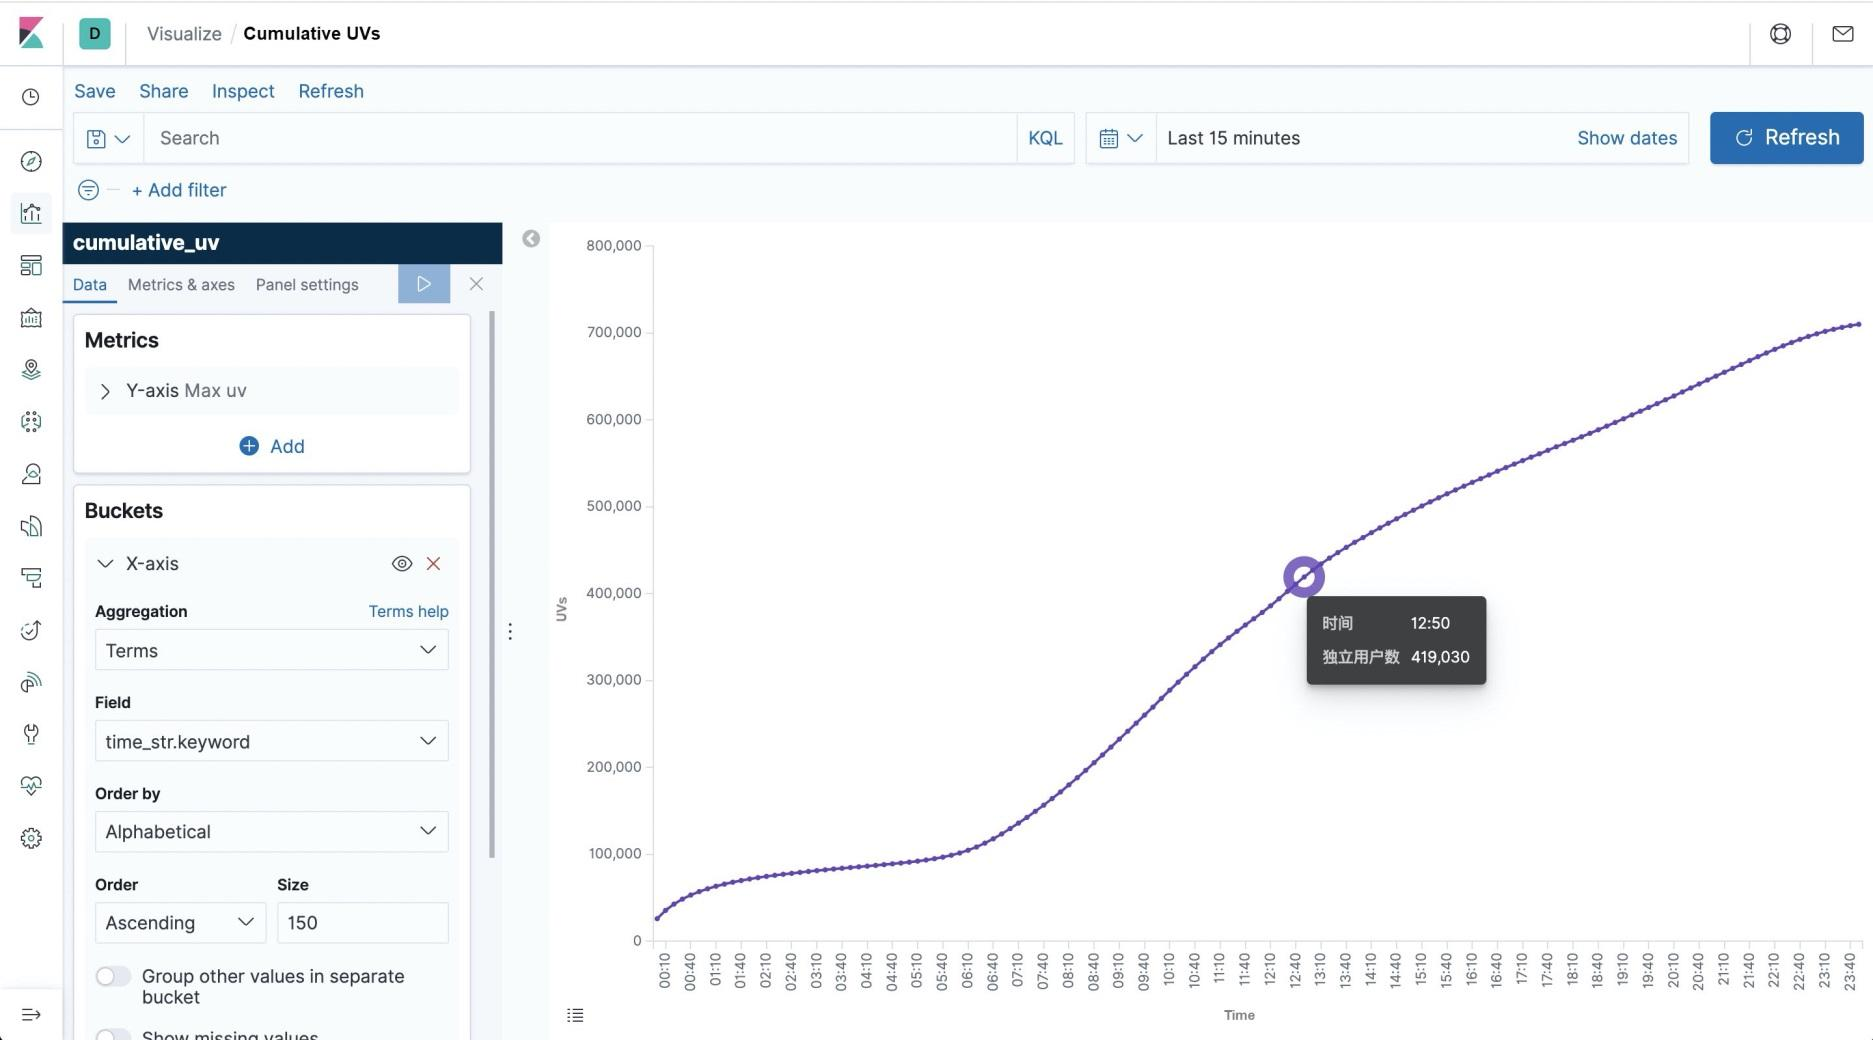
Visualize the cumulative number of unique viewers (UVs) at each moment of the day, which represents the total number of UVs from 00:00 to the current time. The resulting curve always increases.
First, create an Elasticsearch table on the SQL CLI to store the resulting summary data. This table has two major fields: time and cumulative UVs.
CREATE TABLE cumulative_uv (
    time_str STRING,
    uv BIGINT
) WITH (
    'connector.type' = 'elasticsearch',
    'connector.version' = '6',
    'connector.hosts' = 'http://localhost:9200',
    'connector.index' = 'cumulative_uv',
    'connector.document-type' = 'user_behavior',
    'format.type' = 'json',
    'update-mode' = 'upsert'
);
To create this curve, use OVER WINDOW to calculate the current minute of each data entry and the current number of cumulative UVs (the number of UVs from 0 to the current row). Here, use the built-in COUNT(DISTINCT user_id) function to collect UV statistics. Flink SQL has significantly improved the COUNT DISTINCT function. Hence, use it with confidence.
CREATE VIEW uv_per_10min AS
SELECT
  MAX(SUBSTR(DATE_FORMAT(ts, 'HH:mm'),1,4) || '0') OVER w AS time_str,
  COUNT(DISTINCT user_id) OVER w AS uv
FROM user_behavior
WINDOW w AS (ORDER BY proctime ROWS BETWEEN UNBOUNDED PRECEDING AND CURRENT ROW);
Here, use SUBSTR, DATE_FORMAT, and the built-in || function to convert a TIMESTAMP field into a 10-minute interval time string, such as 12:10, 12:20. For more information about OVER WINDOW, see: https://ci.apache.org/projects/flink/flink-docs-release-1.10/dev/table/sql/queries.html#aggregations.
Also, use the CREATE VIEW syntax to register a query as a logical view, which allows to easily reference this query in subsequent queries and facilitates the dismantling of complex queries. Note that creating a logical view does not trigger the execution of the job and the view results are not implemented. Therefore, this implementation is lightweight and does not require additional overhead. Each row of uv_per_10min input data generates a row of output data, putting great pressure on the storage system. Based on uv_per_10min, perform aggregation again based on the minute time so that only one point of data is stored in Elasticsearch for every 10 minutes. This greatly reduces the visual rendering workload of Elasticsearch and Kibana.
INSERT INTO cumulative_uv
SELECT time_str, MAX(uv)
FROM uv_per_10min
GROUP BY time_str;
After submitting the preceding query, create a cumulative_uv index pattern in Kibana. Then, create a "Line" (line graph) on the dashboard, select the cumulative_uv index, and draw the cumulative UV curve according to the configuration on the left in the following screenshot. Finally, save the curve.
The last visualization is a category list, which allows seeing the most important categories. However, the 5,000 categories in the source data are too detailed and do not have much significance in the ranking. To address this problem, include them in a smaller number of top-level categories. Therefore, in the MySQL container, prepare mapping data between sub-categories and top-level categories and use it as a dimension table.
Create a MySQL table on the SQL CLI and use it for the dimension table query.
CREATE TABLE category_dim (
    sub_category_id BIGINT,  -- 子类目
    parent_category_id BIGINT -- 顶级类目
) WITH (
    'connector.type' = 'jdbc',
    'connector.url' = 'jdbc:mysql://localhost:3306/flink',
    'connector.table' = 'category',
    'connector.driver' = 'com.mysql.jdbc.Driver',
    'connector.username' = 'root',
    'connector.password' = '123456',
    'connector.lookup.cache.max-rows' = '5000',
    'connector.lookup.cache.ttl' = '10min'
);
In addition, create an Elasticsearch table to store the category statistics.
CREATE TABLE top_category (
    category_name STRING,  -- 类目名称
    buy_cnt BIGINT  -- 销量
) WITH (
    'connector.type' = 'elasticsearch',
    'connector.version' = '6',
    'connector.hosts' = 'http://localhost:9200',
    'connector.index' = 'top_category',
    'connector.document-type' = 'user_behavior',
    'format.type' = 'json',
    'update-mode' = 'upsert'
);
First, use dimension table join to fill in the category names. Use CREATE VIEW to register the query as a view and simplify the logic. Dimension table join uses the temporal join syntax. For more information, see relevant documents:
CREATE VIEW rich_user_behavior AS
SELECT U.user_id, U.item_id, U.behavior,
  CASE C.parent_category_id
    WHEN 1 THEN '服饰鞋包'
    WHEN 2 THEN '家装家饰'
    WHEN 3 THEN '家电'
    WHEN 4 THEN '美妆'
    WHEN 5 THEN '母婴'
    WHEN 6 THEN '3C数码'
    WHEN 7 THEN '运动户外'
    WHEN 8 THEN '食品'
    ELSE '其他'
  END AS category_name
FROM user_behavior AS U LEFT JOIN category_dim FOR SYSTEM_TIME AS OF U.proctime AS C
ON U.category_id = C.sub_category_id;
Financially, group categories by category name to collect buy event quantity statistics and write the data to Elasticsearch.
INSERT INTO top_category
SELECT category_name, COUNT(*) buy_cnt
FROM rich_user_behavior
WHERE behavior = 'buy'
GROUP BY category_name;
After submitting the preceding query, create a top_category index pattern in Kibana. Then, create a "Horizontal Bar" (bar graph) on the dashboard, select the top_category index, and draw the category ranking list according to the configuration on the left in the following screenshot. Finally, save the list.
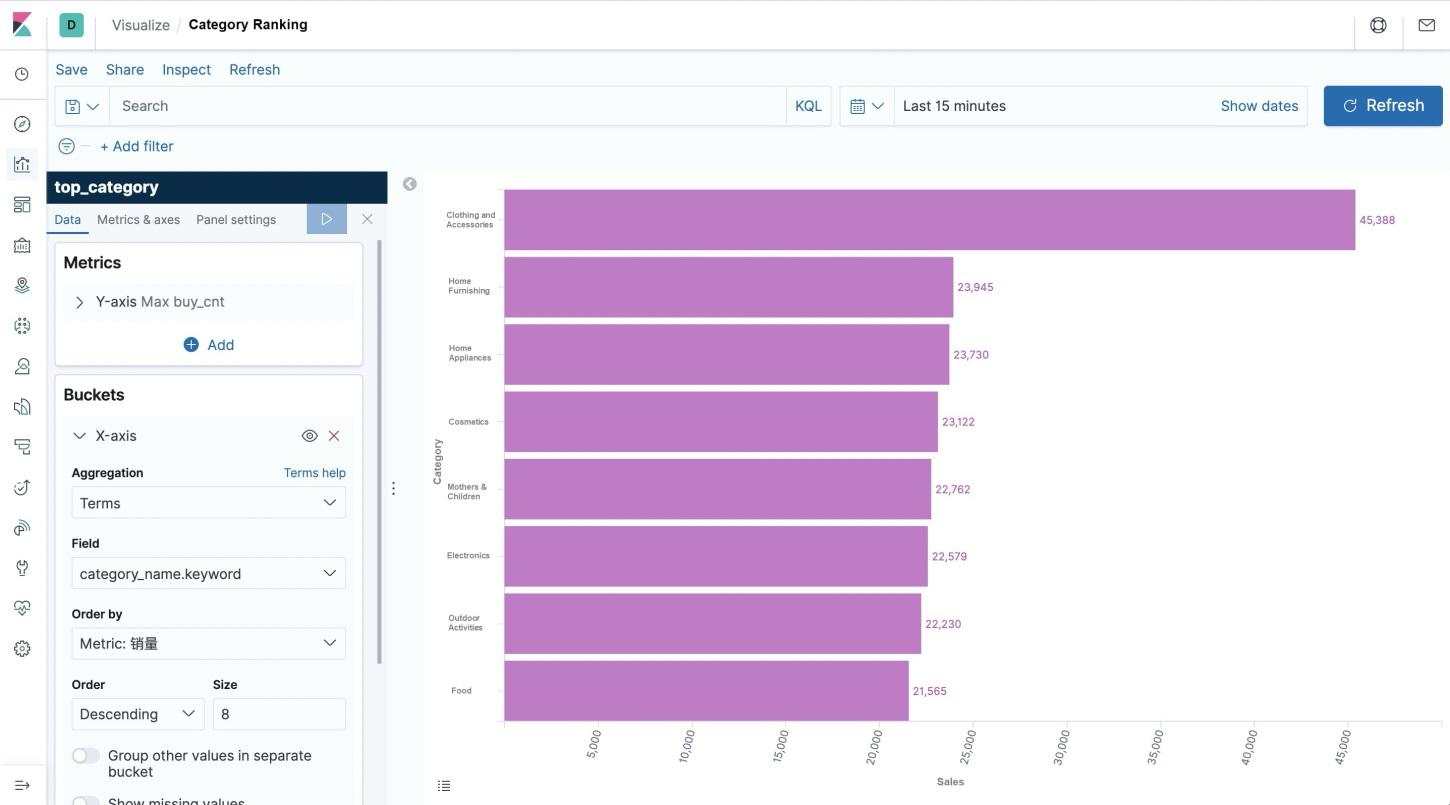
Note that the transaction volume of clothing and accessories is far higher than that of other categories.
This completes three practical cases and their views. Now, return to the dashboard page and drag and drop each view to give the dashboard a more formal and intuitive style, as shown at the beginning of this article. Of course, Kibana also provides a rich set of graphic and visualization options, and user behavior data contains a lot more interesting information to explore. Use Flink SQL to analyze data in more dimensions, use Kibana to display more views and observe real-time changes in graphs.
This article describes how to use Flink SQL to integrate Kafka, MySQL, Elasticsearch, and Kibana and quickly build a real-time analysis application. The entire process can be completed by using SQL plain text, without a line of Java or Scala code. Hope this article gave you a better understanding of the convenient and powerful Flink SQL, which features a convenient connection to various external systems, native support for event times and disordered data processing, dimension table join, and a wide range of built-in functions. We hope the practical exercises are entertaining and inspiring.
Flink Is Attempting to Build a Data Warehouse Simply by Using a Set of SQL Statements

157 posts | 45 followers
FollowApache Flink Community China - January 11, 2022
Apache Flink Community China - March 17, 2023
Apache Flink Community China - September 26, 2021
Apache Flink Community China - August 12, 2022
Apache Flink Community China - June 2, 2022
Alibaba Cloud MaxCompute - November 15, 2021

157 posts | 45 followers
Follow Realtime Compute for Apache Flink
Realtime Compute for Apache Flink offers a highly integrated platform for real-time data processing, which optimizes the computing of Apache Flink.
Learn More Media Solution
An array of powerful multimedia services providing massive cloud storage and efficient content delivery for a smooth and rich user experience.
Learn More Big Data Consulting for Data Technology Solution
Alibaba Cloud provides big data consulting services to help enterprises leverage advanced data technology.
Learn More Big Data Consulting Services for Retail Solution
Alibaba Cloud experts provide retailers with a lightweight and customized big data consulting service to help you assess your big data maturity and plan your big data journey.
Learn MoreMore Posts by Apache Flink Community
Start building with 50+ products and up to 12 months usage for Elastic Compute Service
Get Started for Free Get Started for Free