As the current standard solution for observability, OpenTelemetry has enjoyed rapid development in recent years. OpenTelemetry Trace v1.0 released was recently, and Metrics v1.0 will be released in a few months. After relatively slow development and joint efforts by many companies, the first version of the Log specification was released six months ago. After several updates, it is also galloping towards v1.0.
This article mainly introduces the OpenTelemetry Log specification, which comes from many great companies, such as Google, Microsoft, AMS, DataDog, and members of many excellent projects, including Splunk, ES, and Fluentd. It also covers a lot of knowledge and experience related to development and O&M, which deserves our attention.
The officially proposed purposes are listed below:
From the top-level purpose of OpenTelemetry, standardization is the most important in the definition of the log model to unify the common schemas of Metrics, Tracing, and Logging, so the three can be seamlessly interconnected. Surely, for the sake of as much universality as possible, the log model will be defined while referring to a large number of log formats, together with the information expression being flexible as much as possible.

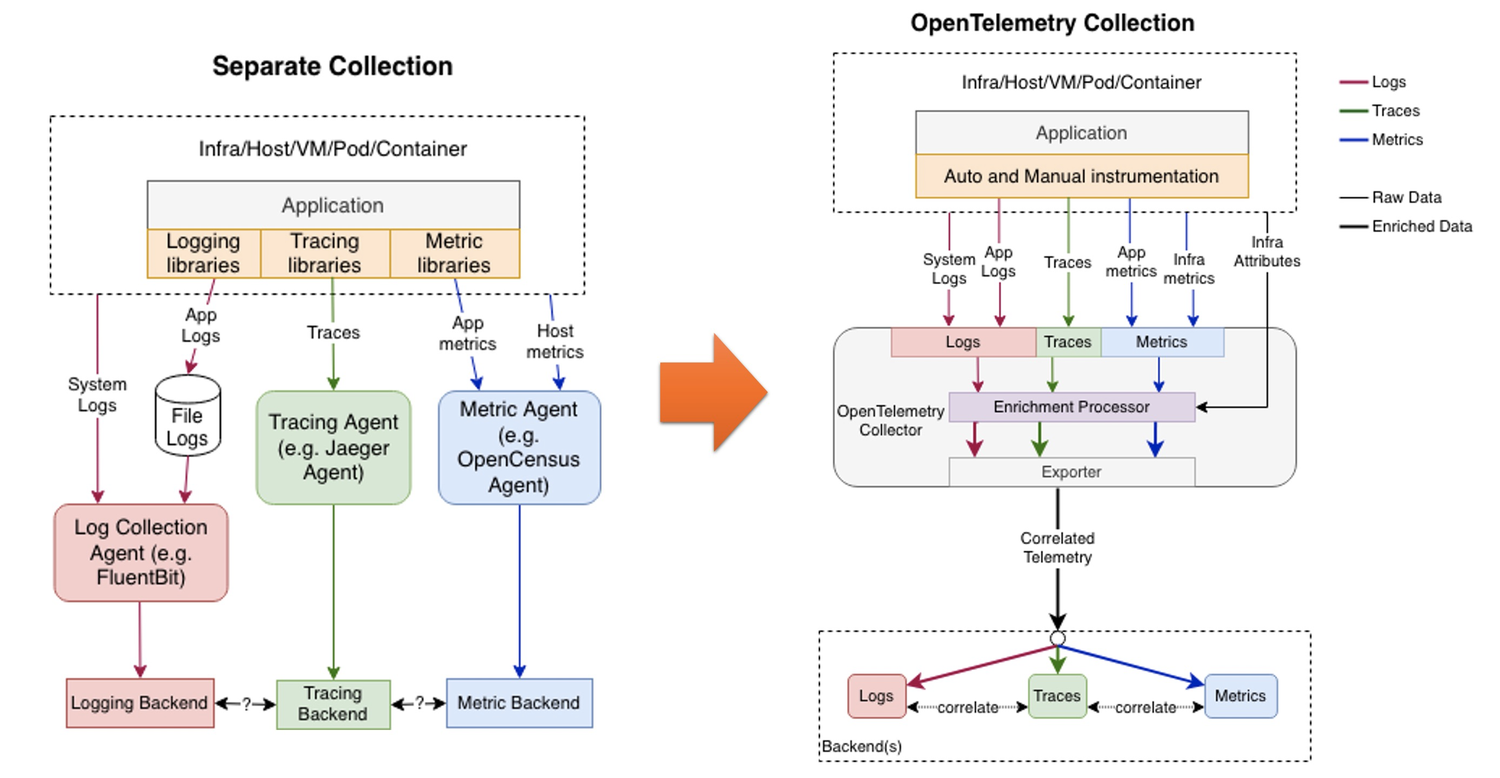
In the traditional architecture, Logs, Traces, and Metrics are generated and collected separately. With OpenTelemetry, all data will be collected by OpenTelemetry Collector and transmitted to a unified backend for association. The benefits are listed below:
The preceding figure shows the ultimate goal. However, it is estimated that other log collectors are still required in the next one or two years since OpenTelemetry Collector does not provide enough solid support for Log currently.
In terms of expressiveness, LogModel must be able to express at least the following three types of logs or events:
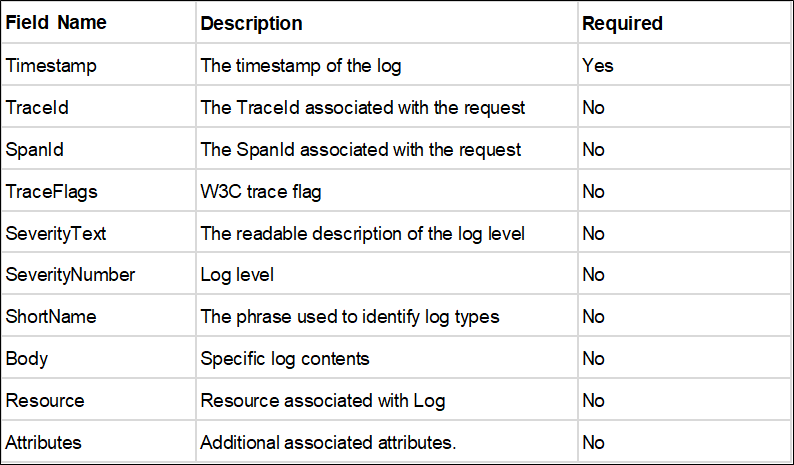
LogModel only defines the logical expression of record, regardless of the specific physical formats and coding forms. Each record has two field types:
KeyValue pairs, varying in types according to different Top-level names
Timestampuint64, nanosecond
TraceIdA byte array – For detailed information, please see: W3C Trace Context
SpanIdA byte array – If there is a SpanId, there must be a TraceId.
TraceFlagsA single byte – For detailed information, please see: W3C Trace Context
SeverityTextThe readable description of the log level – If unset, it is mapped according to the default mapping rule of SeverityNumber.
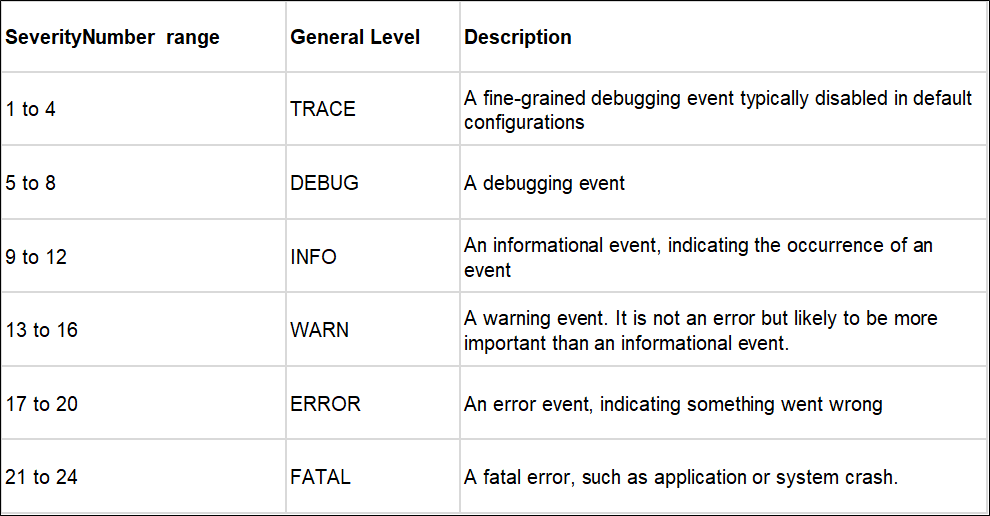
SeverityNumberSeverityNumber is similar to the log level in Syslog. OpenTelemetry defines 24 log levels in 6 categories, covering the definition of all types of log levels.

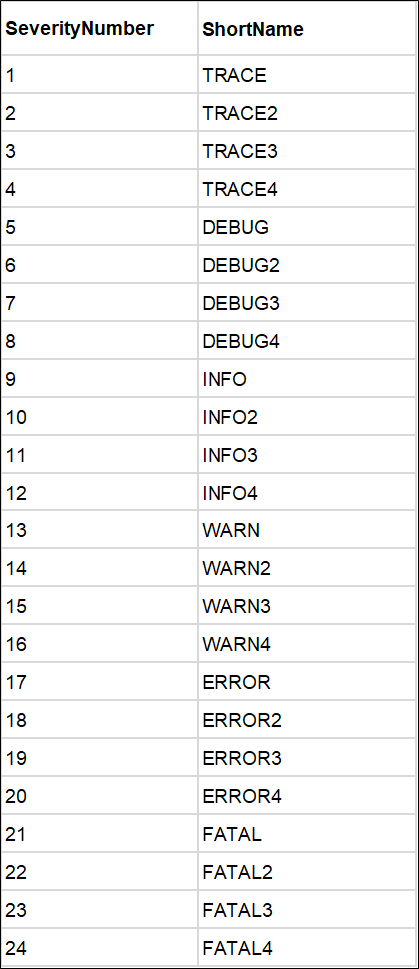
SeverityNumber and SeverityText can be mapped automatically. Therefore, SeverityText can be left unfilled when a log is generated to reduce the serialization, deserialization, and transmission costs. The mapping relations are listed below:

ShortNameIdentify a log type with a specific word, usually no more than 50 bytes, for example, ProcessStarted.
BodyIts log content is of anyType, which can be int, string, bool, float, an array, or Map.
Key/Value pair list – Please see OpenTelemetry general Resource definition. Information, such as host name, process number, and service name is included, which can be used to associate with Metrics and Tracing.
Key/Value pair list. Key is always a string, and Value is of anyType. For detailed information, please see Definitions of Attributes in Tracing.
Example 1:
{
  "Timestamp": 1586960586000, // JSON needs to make a decision about
                              // how to represent nanoseconds.
  "Attributes": {
    "http.status_code": 500,
    "http.url": "http://example.com",
    "my.custom.application.tag": "hello",
  },
  "Resource": {
    "service.name": "donut_shop",
    "service.version": "semver:2.0.0",
    "k8s.pod.uid": "1138528c-c36e-11e9-a1a7-42010a800198",
  },
  "TraceId": "f4dbb3edd765f620", // this is a byte sequence
                                 // (hex-encoded in JSON)
  "SpanId": "43222c2d51a7abe3",
  "SeverityText": "INFO",
  "SeverityNumber": 9,
  "Body": "20200415T072306-0700 INFO I like donuts"
}
Example 2:
{
  "Timestamp": 1586960586000,
  ...
  "Body": {
    "i": "am",
    "an": "event",
    "of": {
      "some": "complexity"
    }
  }
}
Example 3:
{
   "Timestamp": 1586960586000,
   "Attributes":{
      "http.scheme":"https",
      "http.host":"donut.mycie.com",
      "http.target":"/order",
      "http.method":"post",
      "http.status_code":500,
      "http.flavor":"1.1",
      "http.user_agent": "Mozilla/5.0 (Macintosh; Intel Mac OS X 10_14_0) AppleWebKit/537.36 (KHTML, like Gecko) Chrome/80.0.3987.149 Safari/537.36",
   }
}According to the specifications above, the OpenTelemetry Log model mainly seeks the following points:
TraceID and SpanID to be associated with Traces. At the same time, it can be associated with Traces and Metrics better through Resource.Overall, this model overall is very suitable for modern IT systems. However, much work is needed to implement the model successfully, including log collection, parsing, transmission, environments, and compatibility with many other existing systems. Fortunately, Fluentd is also part of the CNCF project. It may become the log collection kernel of OpenTelemetry in the future working in coordination with the Collector.
Future Direction of Observability in Cloud-Native: A Case Study of Autonomous Driving
12 posts | 1 followers
FollowAlibaba Cloud Native Community - July 4, 2023
Alibaba Developer - August 2, 2021
Alibaba Cloud Native Community - August 30, 2022
DavidZhang - January 15, 2021
Alibaba Cloud Native Community - November 18, 2024
Alibaba Cloud Native Community - February 8, 2025
12 posts | 1 followers
Follow Simple Log Service
An all-in-one service for log-type data
Learn More Alibaba Cloud Linux
Alibaba Cloud Linux is a free-to-use, native operating system that provides a stable, reliable, and high-performance environment for your applications.
Learn More Managed Service for Prometheus
Multi-source metrics are aggregated to monitor the status of your business and services in real time.
Learn More Application Real-Time Monitoring Service
Build business monitoring capabilities with real time response based on frontend monitoring, application monitoring, and custom business monitoring capabilities
Learn MoreMore Posts by DavidZhang