As distributed applications and Serverless applications are accepted by more developers and enterprises, the operation and maintenance problems behind them are gradually highlighted. The request link in the microservices model is too long, which takes a long time to locate the problem. For example, completing a single user request in a distributed application may require different microservices and any service failure or performance failure will affect the user request significantly. As the business continues to expand, traces are becoming more complex. It is difficult to handle only by logs or Application Performance Monitoring (APM).
Facing such problems, Google has published a paper entitled Dapper - a Large-Scale Distributed Systems Tracing Infrastructure [1] to introduce their distributed tracking technology and point out that distributed tracing systems should meet the following business requirements.
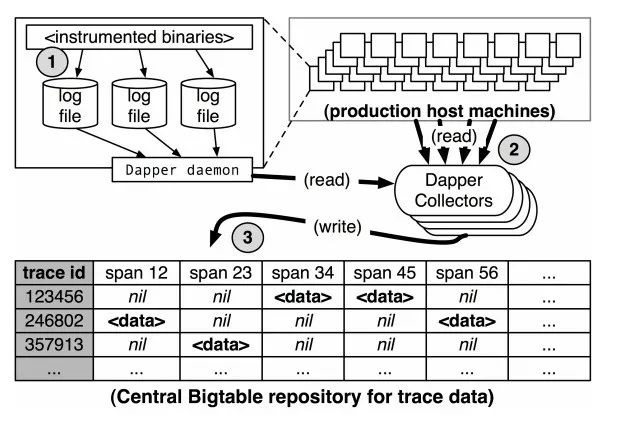
In addition to the requirements above, the paper focuses on the three core links of distributed tracing: data collection, data persistence, and data display. Data collection refers to tracking in the code to set what needs to be reported in the request. Data persistence means storing the reported data on disks. Data display is rendered on the interface based on the request associated with the TraceID query.
After the publication of this paper, distributed tracing has been accepted by more people, and the concept of technology has gradually emerged. Related products have sprung up. Distributed tracing products (such as Uber's Jaeger and Twitter's Zipkin) have become famous. However, this process also brings a problem. Although each product has its own set of data collection standards and SDK, most of them are based on the Google Dapper protocol with different implementations. OpenTracing and OpenCensus were created to solve this problem.
It is too difficult for many developers to make applications support distributed tracing. It requires the transfer of trace data within and between processes. What is more difficult is that other components need to support distributed tracing, including open-source services (such as NGINX, Cassandra, and Redis), or open-source libraries (such as gRPC and ORMs) introduced into the services.

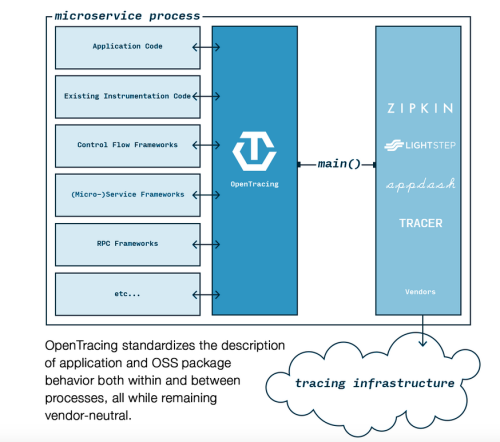
Before OpenTracing, on the one hand, many distributed tracking systems were implemented using application-level detection with incompatible APIs, which made developers uneasy about the close coupling of applications with any specific distributed tracing. On the other hand, these application-level detection APIs have very similar syntax. The OpenTracing specification was created to solve the problem of incompatibility of API in different distributed tracing systems or the standardization of tracing data from one library to another and one process to the next. It is a lightweight standardization layer located between applications /class libraries and tracing or log analysis programs.
The advantage of OpenTracing is that it has formulated a set of protocol standards unrelated to manufacturers and platforms. Therefore, developers can add or replace the implementation of underlying monitoring faster only by modifying Tracer. Based on this, the Cloud Native Computing Foundation (CNCF) officially accepted OpenTracing in 2016. OpenTracing has become the third CNCF project. Kubernetes and Prometheus have become the de facto standards in the cloud-native and open-source fields. This also shows the importance the industry attaches to observable and uniform standards.
OpenTracing consists of the API specification, the framework and libraries that implement the specification, and project documentation. It has made the following efforts:
The system has a logical unit with start time and execution duration and contains multiple states.
Each span encapsulates the following states:
In the key-value pair, the key must be a string, and the value can be a string, a Boolean value, or a numeric value.
Each log consists of a key-value pair and a timestamp. In the key-value pair, the key must be a string, and the value can be of any type.
It refers to the relationships between zero span or multiple spans. References relationships are established between spans through SpanContext.
OpenTracing currently defines two types of references: ChildOf and FollowsFrom. Both of these reference types specifically simulate the relationship between the child span and the parent span.
The parent span in the ChildOf relationship waits for the child span to return. The execution time of the child span affects the execution time of the parent span. The parent span depends on the execution result of the child span. In addition to sequential tasks, there are many parallel tasks in our logic, and their corresponding spans are also parallel. In this case, a parent span can merge all child spans and wait until all parallel child spans to the end. In distributed applications, some upstream systems do not rely in any way on the execution results of downstream systems. For example, upstream systems send messages to downstream systems through the message queue. In this case, the relationship between the child span corresponding to the downstream system and the parent span corresponding to the upstream system is FollowsFrom.
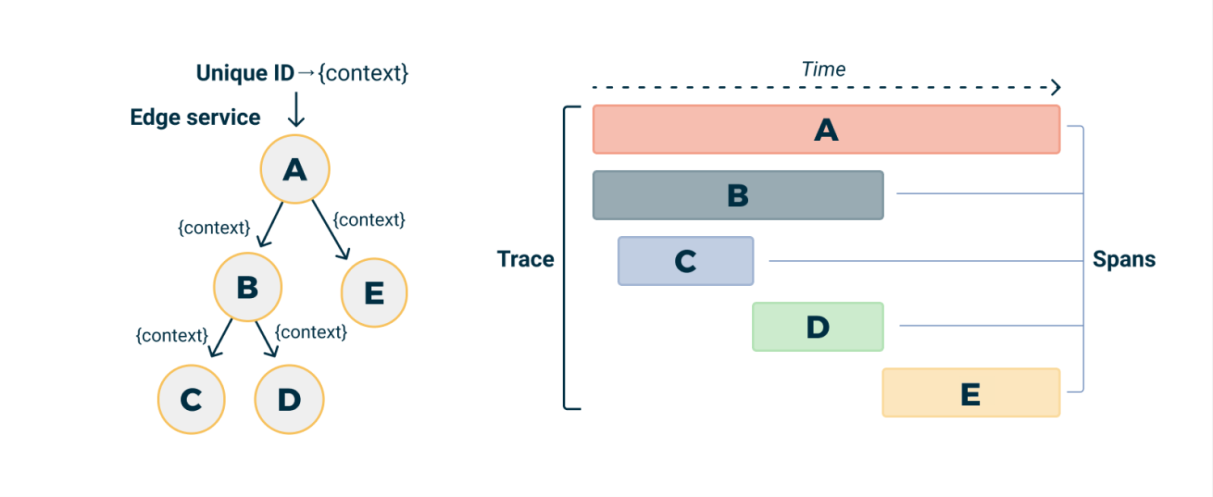
After understanding the relevant terms, we can find that there are three key and interconnected types in the OpenTracing specification: Tracer, Span, and SpanContext. The technical model of OpenTracing is also clear. The trace is implicitly defined by the span belonging to this trace. Each call is called a span, and each span must contain a global traceID. The trace can be considered a directed acyclic graph (DAG) composed of multiple spans. Spans are connected first and last in a trace. TraceID and related content take SpanContext as the carrier and follow the span path in sequence through the transmission protocol. The info above can be regarded as the whole process of a client request in a distributed application. In addition to the DAG from the business perspective, we try to display the trace call chain based on the timing diagram of the timeline. This can display the component call time, sequence relationship, and other information better.
Developers can use OpenTracing to describe the causal relationship between services and add fine-grained logs.
Libraries that adopt intermediate control requests can be integrated with OpenTracing. For example, a web middleware library can use OpenTracing to create spans for requests, and an ORM library can use OpenTracing to describe high-level ORM syntax and execute specific SQL queries.
Any cross-process subservice can use OpenTracing to standardize the format of tracing.
Products that follow the OpenTracing protocol include tracking components (such as Jaeger, Zipkin, LightStep, and AppDash). They can be easily integrated into open-source frameworks (such as gRPC, Flask, Django, and Go-kit).
O&M personnel began to pay attention to Log and Metrics in addition to traces to implement DevOps in the entire observability field better. Metrics monitoring (as an important part of observability) includes machine metrics (such as CPU, memory, hard disk, and network), network protocol metrics (such as gRPC request latency and error rate), and business metrics (such as the number of users and visits).
OpenCensus provides unified measurement tools (such as cross-service capture tracing spans and application-level metrics).
### Advantages
In addition to using OpenTracing-related terms, OpenCensus defines some new terms:
OpenCensus allows associating metrics with dimensions when recording. Thus, the measurement results can be analyzed from different angles.
It collects observability results of library and application records. It summarizes and exports statistical data and includes two parts: Recording and Viewing (Aggregate Metric Query).
In addition to the span properties provided by Opentracing, OpenCensus supports Parent SpanId, Remote Parent, Attributes, Annotations, Message Events, Links, and other properties.
OpenCensus Agent is a daemon that allows multi-language deployments of OpenCensus to use Exporter. Unlike the traditional removal and configuration of OpenCensus Exporter for each language library and each application, with OpenCensus Agent, you only need to enable OpenCensus Agent Exporter separately for its target language. The O&M Team can implement a single export to manage and obtain data from a multilingual application and send the data to the selected backend. At the same time, minimize the impact of repeated startup or deployment on the application. Finally, the Agent comes with Receivers. Receivers enable the Agent to pass through the backend to receive observability data and route it to the selected Exporter (such as Zipkin, Jaeger, or Prometheus).
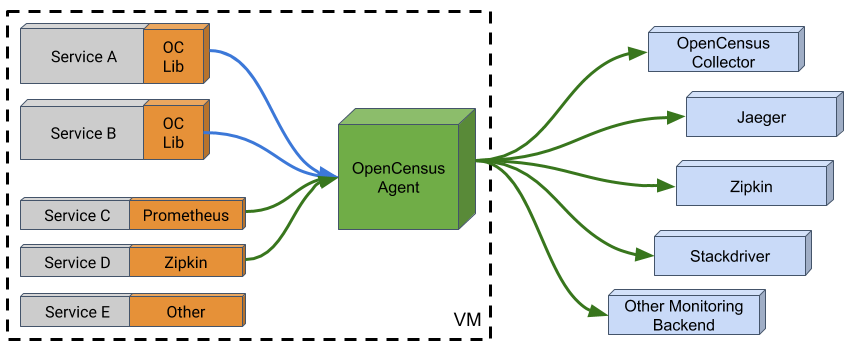
Collector (as an important part of OpenCensus) is written in the Go language. It can accept traffic from any application with receivers available without paying attention to programming languages and deployment methods. This benefit is clear. Only one exporter component is required for services or applications that provide metrics and traces to obtain data from multilingual applications.
Only a single exporter needs to be managed and maintained for developers. All applications use OpenCensus exporters to send data. At the same time, developers are free to choose to send data to the backend required by the business and do it better at any time. The collector has buffers and retry functions to ensure data integrity and availability to solve the problem that sending a large amount of data over the network may need to deal with the sending failure.
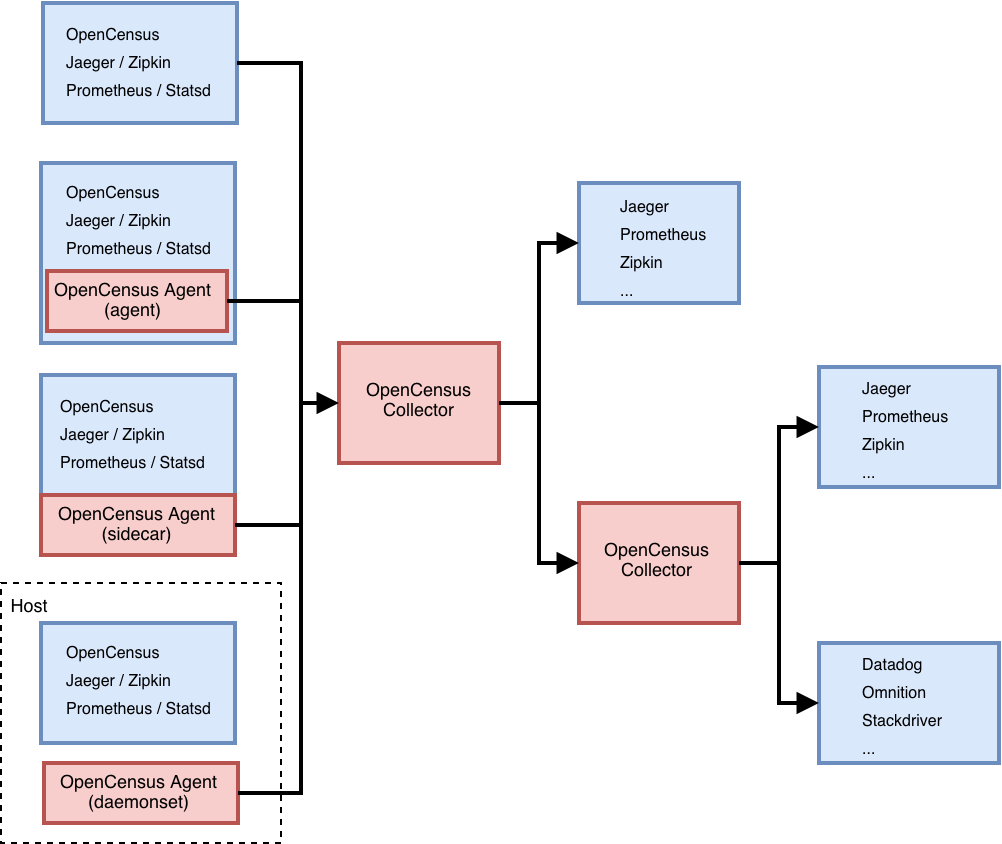
OpenCensus can upload relevant data to various backends through various exporter implementations, such as Prometheus for stats, OpenZipkin for traces, Stackdriver Monitoring for stats and Trace for traces, Jaeger for traces, and Graphite for stats.
Products that follow the OpenCensus protocol include Prometheus, SignalFX, Stackdriver, and Zipkin.
The two above are evaluated in terms of functions, features, and other dimensions. OpenTracing and OpenCensus each have clear advantages and disadvantages. OpenTracing supports more languages and has lower coupling to other systems, but OpenCensus supports Metrics and distributed tracing and supports it from the API layer to the infrastructure layer. For many developers, when the difficulty of selection occurs, a new idea is constantly being discussed. Can there be a project that can integrate OpenTracing and OpenCensus and support the observable data related to logs?

When answering the previous question, let's look at the troubleshooting process of a typical service problem first:
Tracing, metrics, and logs are indispensable to obtain better observability or solve the preceding problems quickly.
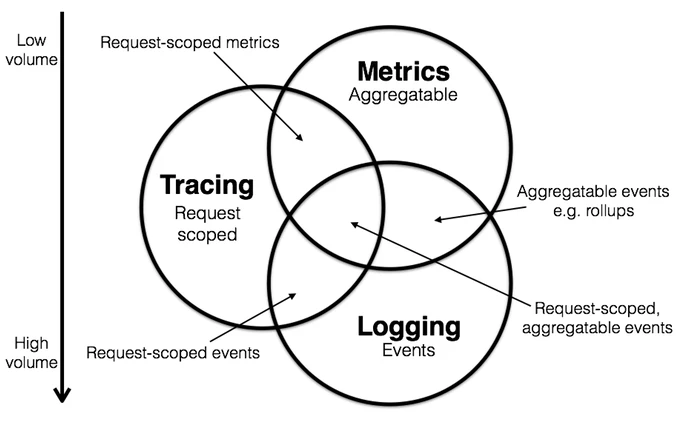
At the same time, the industry already has a wealth of open-source and commercial solutions, including:
At the same time, each scheme has a variety of protocol formats/data types. It is difficult to be compatible/interoperable among different schemes. At the same time, various schemes will be mixed in actual business scenarios, and developers can only develop various adapters to be compatible.
OpenTelemetry was created to integrate traces, metrics, and logs better. As an incubation project of CNCF, OpenTelemetry is a combination of OpenTracing and OpenCensus projects. It is an integration of specifications, API interfaces, SDKs, and tools. It brings a unified standard of metrics, tracing, and logs to developers. All three have the same metadata structure and can be easily related to each other.

OpenTelemetry is independent of the manufacturer and platform. It does not provide backend services related to observability. You can export observability data to different backends (such as storage, query, and visualization) based on user requirements (such as Prometheus, Jaeger, and the cloud services of vendors).
The core benefits of OpenTelemetry are concentrated in the following sections:
When an operation and maintenance personnel finds that the tools are insufficient and cannot be switched due to the high cost of implementation, they will scold the manufacturer. The emergence of OpenTelemetry aims to break this by providing a standardized instrumentation framework. As a pluggable service, common technical protocols and formats can be easily added to make service choices freer.
OpenTelemetry uses a standards-based implementation approach. The focus on standards is especially important for OpenTelemetry because of the need to track interoperability across languages. Many languages have type definitions that can be used in implementations, such as interfaces for creating reusable components. It includes the specifications required for the internal implementation of the observability client, and the protocol specifications required for the observability client to communicate with the outside. The specifications include:
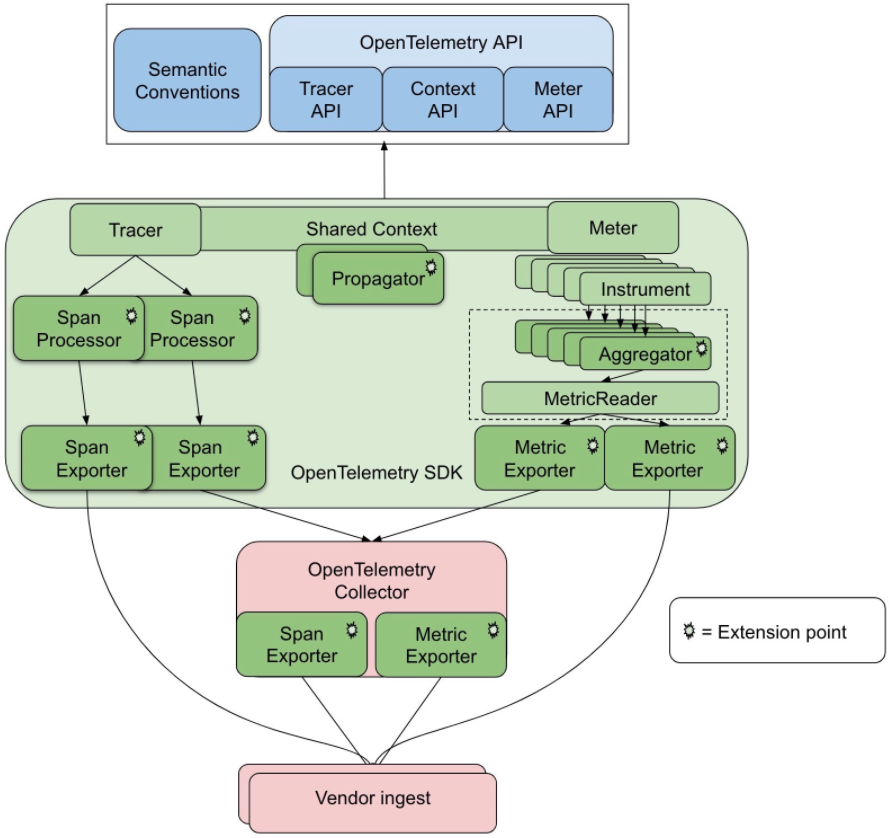
Each language implements the specification through its API. The API contains language-specific types and interface definitions. These are abstract classes, types, and interfaces used by specific language implementations. They also include no-operation (no-op) implementations to support local testing and provide tools for unit testing. The definition of the API is located in the implementation of each language. As the OpenTelemetry Python client said, “The opentelemetry-api package includes abstract classes and no-op implementations, which form the OpenTelemetry API that follows the specification.” A similar definition can be found in the Javascript client, “This package provides everything you need to interact with the OpenTelemetry API, including all TypeScript interfaces, enumerations, and no-op implementations.” It can be used on the server and in the browser.
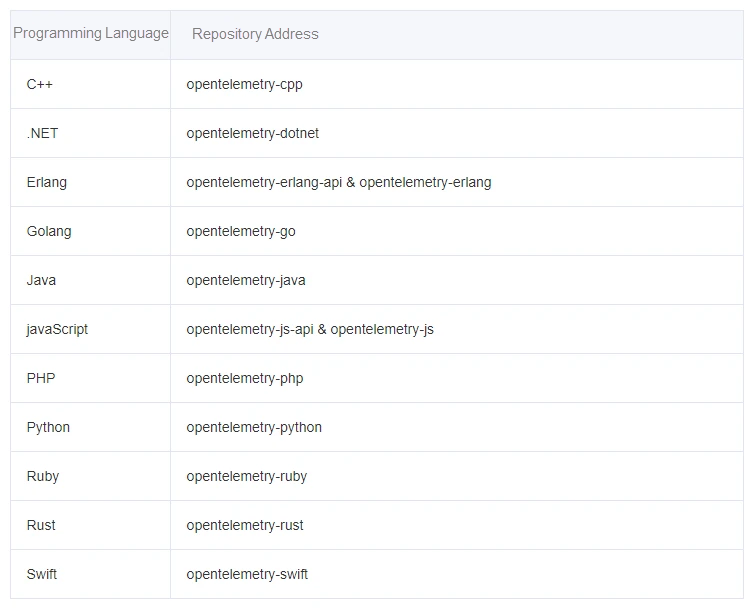
OpenTelemetry implements a corresponding SDK for each common language, which combines the exporter with the API. The SDK is a specific, executable API implementation. It contains C++, NET, Erlang/Elixir, Go, Java, JavaScript, PHP, Python, Ruby, Rust, and Swift.
The OpenTelemetry SDK generates observability data using the selected language by using the OpenTelemetry API and exports the data to the backend. It allows enhancements for public libraries or frameworks. Users can use SDK for automatic code injection and manual tracking and integrate support for other three-party libraries (Log4j and LogBack). Based on the specifications and definitions in the opentelemetry-specification, these packages generally combine the characteristics of the language itself to realize the basic ability to collect observability data at the client, including the transmission of metadata between services and processes, IntelliTrace addition monitoring and data export, the creation and use of metrics, and data export.
In Tracing practice, there is a basic principle that the observability data collection process needs to be orthogonal to business logic processing. Collector is based on this principle that it should minimize the impact of observability clients on the original business logic. OpenTelemetry is based on the collection system of OpenCensus, including agents and collectors. Collector covers the functions of collecting, transforming, and exporting data. It supports receiving data in a variety of formats (such as OTLP, Jaeger, and Prometheus) and sending data to one or more backends. It also supports the processing and filtering of data before output. The collector contrib package supports more data formats and backends.
Collector has two modes at the architectural level. The first one deploys the collector in the same host as the application (such as DaemonSet in Kubernetes) or in the same pod as the application (such as sidecar in Kubernetes). The telemetry data collected by the application is directly passed to the collector through the loopback network. This is Agent mode. The second one treats the collector as an independent middleware. The application transfers the collected telemetry data to this middleware. This mode is called Gateway mode. These two modes can be used alone or in combination. Only the data protocol format of the data export is consistent with the data protocol format of the data ingress.
OpenTelemetry has also begun to provide automatic code injection implementations. Currently, it supports the automatic injection of various mainstream Java frameworks.
OpenTelemetry took cloud-native features into consideration when it was created. Kubernetes Operator is also provided for rapid deployment.
Metric is a metric about a service that is captured in the run time. Logically, the moment that captures one of the metrics is called a Metric event. It includes the metric itself and the time and related metadata when it was acquired. Application and request metrics are important metrics for availability and performance. Customized metrics provide insight into how availability affects the user experience and business. Customized metrics provide insight into how available metrics affect the user experience or business. OpenTelemetry currently defines three metric tools.
A log is a text record with a timestamp, which can be structured with metadata or unstructured. Although each log is a separate data source, it can be attached to the span of trace. Logs can also be seen when node analysis is performed for daily use.
Any data in OpenTelemetry that is not part of distributed trace or metrics is a log. Logs are usually used to determine the root cause of the problem. They usually contain information about who changed the content and the result of the change.
Trace refers to the tracking of a single request, which can be initiated by an application or a user. Distributed tracing is a form of tracing across networks and applications. Each unit of work is called a span in trace, and a trace consists of a tree-shaped span. Span represents the object that validates the work done by the service or component designed by the application. Span also provides metrics that can be used to debug requests, errors, and durations for availability and performance issues. A span contains a span context. The context is a set of globally unique identifiers that represent the unique request to which each span belongs. It is usually called TraceID.
In addition to the spread of trace, OpenTelemetry provides Baggage to spread key-value pairs. Baggage is used to index observable events in service. The service contains attributes provided by previous services in the same transaction, which helps establish a causal relationship between events. Although Baggage can be used as a prototype for other crosscutting concerns, this mechanism is mainly to pass the value of the OpenTelemetry observability system. These values can be consumed from the Baggage. It is used as additional dimensions for the metric or as additional contexts for logs and traces.
Combined with the content above, OpenTelemetry covers the specification definition, API definition, specification implementation, and data acquisition and transmission of various observability data types. Only one SDK is needed to realize the unified generation of all types of data. The cluster only needs to deploy one OpenTelemetry collector to realize the collection of all types of data. Moreover, metrics, tracing, and logging have the same meta information and can be associated seamlessly.
OpenTelemetry wants to solve the first step to unifying observability data. It standardizes the collection and transmission of observability data through API and SDK. OpenTelemetry does not rewrite all components but reuses the tools commonly used in various fields in the industry to the greatest extent. It achieved that by providing a secure, platform-independent, vendor-independent protocol, component, and standard. Its positioning is very clear: the unification of data collection and standards and specifications. How data is used, stored, displayed, and alerted is not officially involved. However, as far as the observability overall solution is concerned, OpenTelemetry only completed the unified production of data. How to store and use these data for analysis and alarm in the future does not clearly provide relevant solutions, but these problems are very prominent.
Metrics can run in Prometheus, InfluxDB, or all types of time series databases. Tracing can be connected to Jaeger, OpenCensus, and Zipkin. However, how to select and perform subsequent operations and maintenance of these backend services is a difficult problem.
What can we do to conduct a unified analysis of the collected data? Different data need to be processed by different data platforms. A lot of customized development work is required to display metrics, logging, and tracing on a unified platform and realize the related jump of the three. It is a great workload for operation and maintenance.
In addition to daily visual monitoring, application anomaly detection and root cause diagnosis are important business requirements for operation and maintenance. In this case, OpenTelemetry data needs to be integrated into AIOps. However, for many development and operation teams, the basic DevOps has not been fully implemented yet, let alone additional AIOps.
Alibaba Cloud Application Real-Time Monitoring Service (ARMS) helps the O&M team solve the problems of data analysis, anomaly detection, and diagnosis. ARMS supports multiple methods to access OpenTelemetry trace data. You can directly report OpenTelemetry trace data to ARMS or forward trace data through OpenTelemetry Collector.
You can install ARMS for OpenTelemetry Collector in Alibaba Cloud Container Service for Kubernetes (ACK) cluster and use the collector to forward trace data. ARMS for OpenTelemetry Collector provides a variety of easy-to-use and reliable functions, including lossless statistics, dynamic parameter tuning, application state management, and out-of-the-box tracing dashboards on Grafana. The lossless statistics function helps pre-aggregate metrics on your machine, which negates the effect of sampling rate during statistics collection.
The following section describes the procedure of installing ARMS for OpenTelemetry Collector:
1. Install ARMS for OpenTelemetry Collector using the application catalog in the ACK console
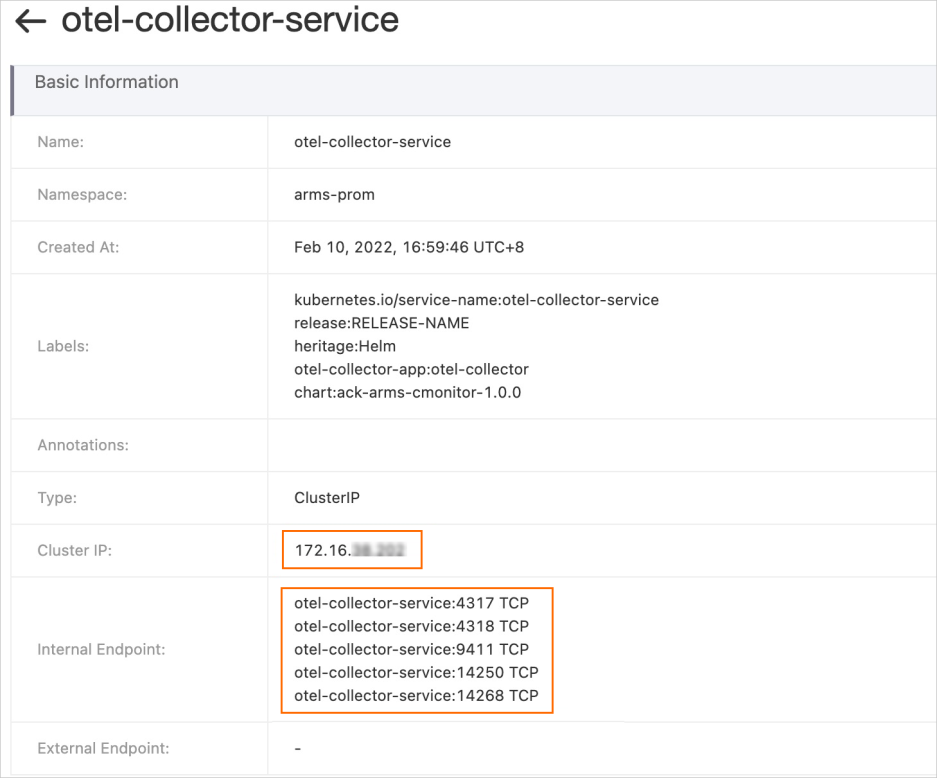
2. Change the Exporter endpoint in the application SDK to otel-collector-service: Port
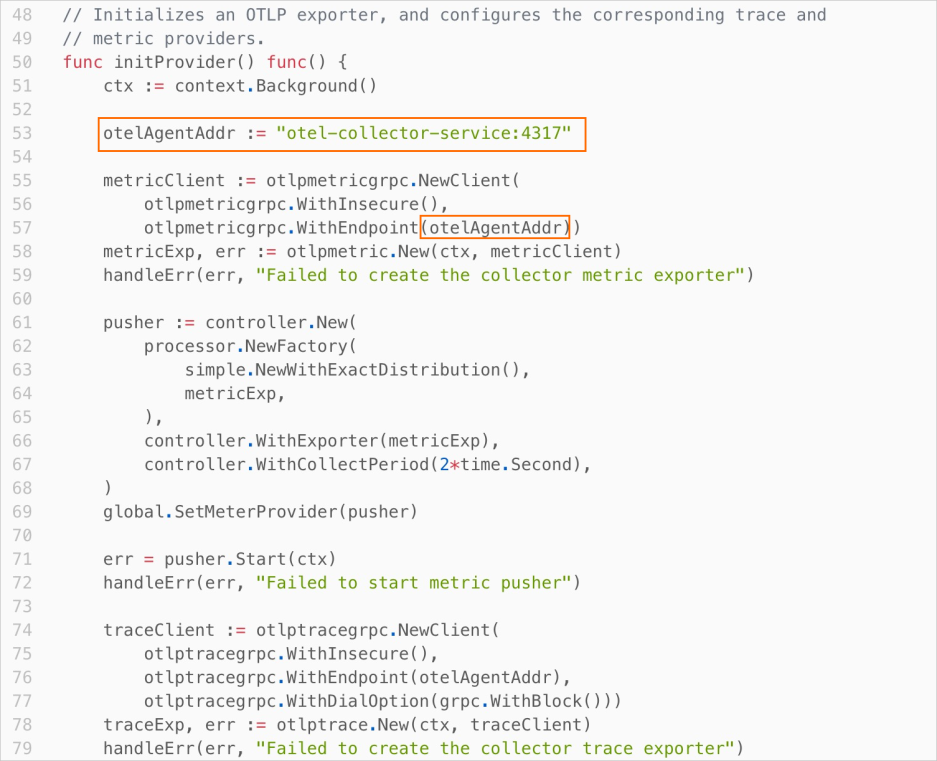
You only need to modify the endpoint and token of the exporter to use the open-source OpenTelemetry Collector to forward trace data to ARMS.
exporters: otlp: endpoint: <endpoint>:8090 tls: insecure: true headers: Authentication: <token>Description
http://tracing-analysis-dc-bj.aliyuncs.com:8090
b590lhguqs@3 a7*********9b_b590lhguqs@53d*****8301
3. OpenTelemetry Trace User Guide
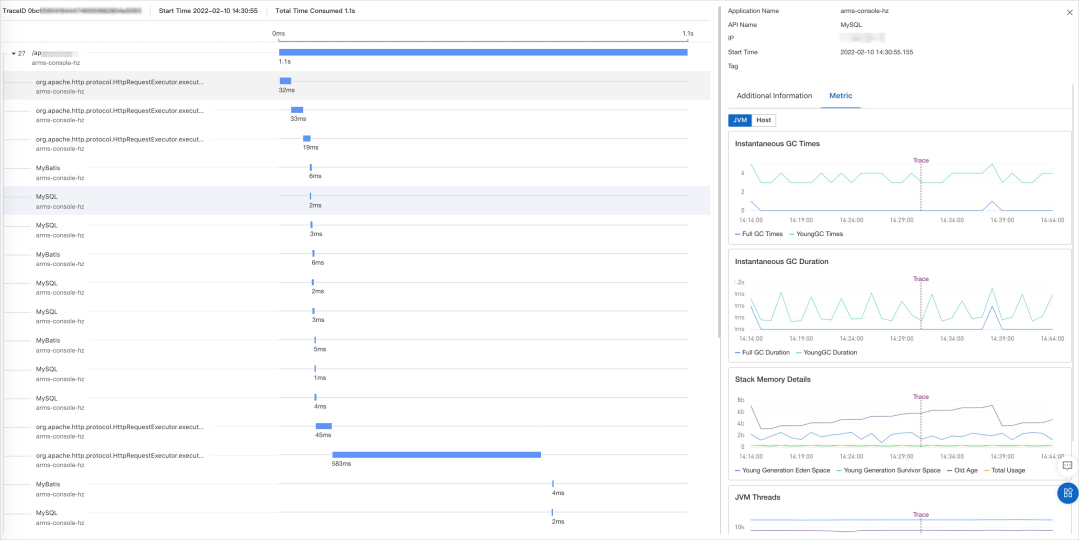
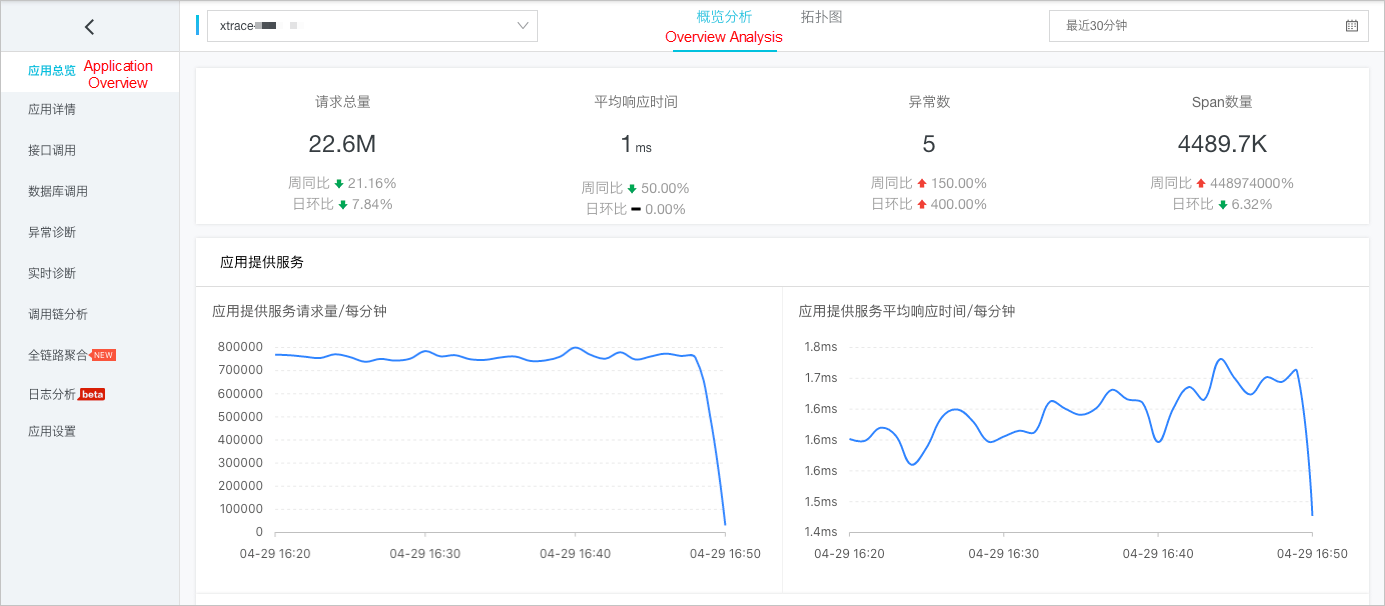
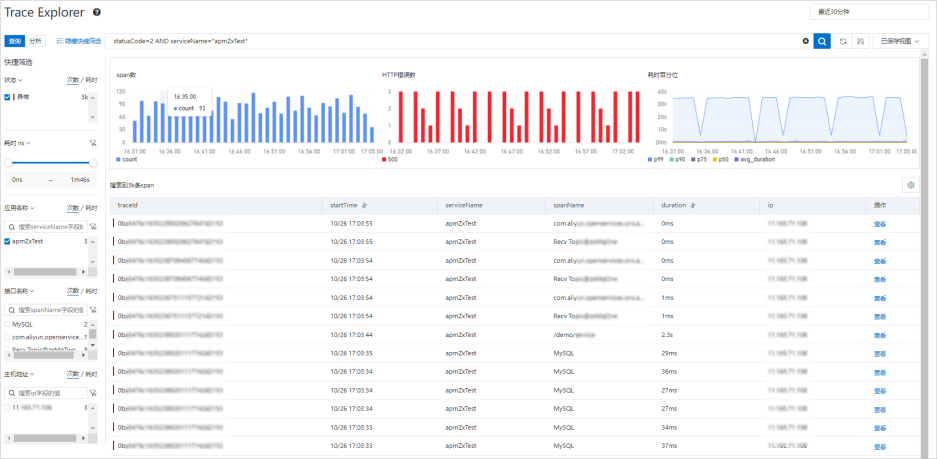
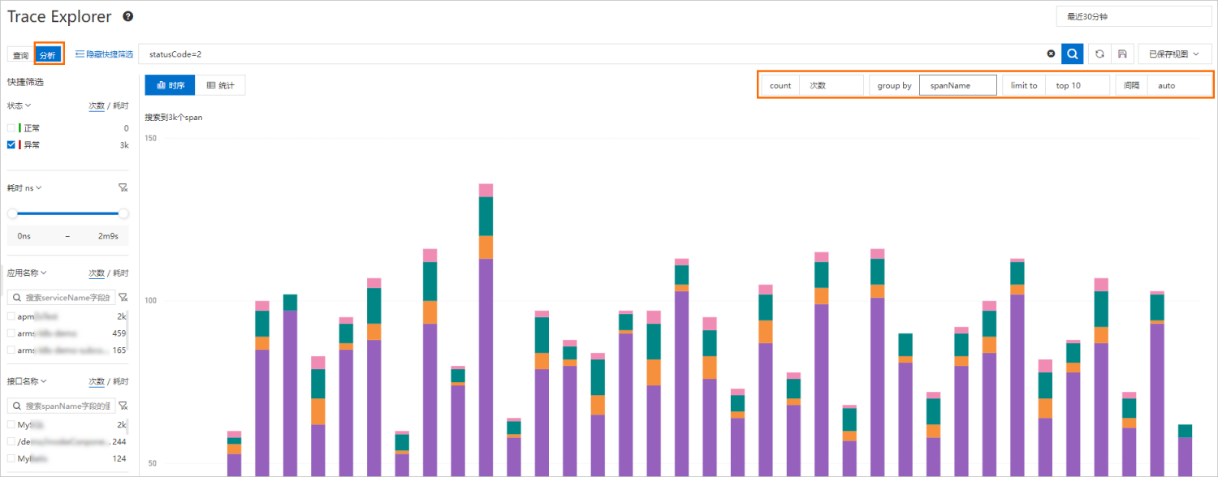
ARMS provides a variety of diagnostic features, such as trace details query, pre-aggregated metric dashboards, post-aggregated metric analysis of Trace Explorer, and access to the logs of trace-associated services, which ensures trace data is used effectively.

[1] "Dapper - a Large-Scale Distributed Systems Tracing Infrastructure"
https://static.googleusercontent.com/media/research.google.com/zh-CN//archive/papers/dapper-2010-1.pdf
[2] Monitor Java Applications
https://www.alibabacloud.com/help/en/application-real-time-monitoring-service/latest/application-monitoring-quick-start
[3] OpenTelemetry SDK for Java
https://www.alibabacloud.com/help/en/application-real-time-monitoring-service/latest/opentelemetry-sdk-for-java
[4] Use OpenTelemetry to submit the trace data of Java applications
https://www.alibabacloud.com/help/en/application-real-time-monitoring-service/latest/opentelemetryjava
[5] Container Service Console
https://cs.console.aliyun.com/
How Does Kubernetes Monitoring Solve the Three Major Challenges the System Architecture Faces?

675 posts | 56 followers
FollowAlibaba Developer - August 2, 2021
DavidZhang - January 15, 2021
DavidZhang - April 30, 2021
Alibaba Cloud Community - June 8, 2022
DavidZhang - July 5, 2022
Alibaba Cloud Native Community - July 4, 2023

675 posts | 56 followers
Follow Microservices Engine (MSE)
MSE provides a fully managed registration and configuration center, and gateway and microservices governance capabilities.
Learn More ChatAPP
Reach global users more accurately and efficiently via IM Channel
Learn More Apsara Stack
Apsara Stack is a full-stack cloud solution created by Alibaba Cloud for medium- and large-size enterprise-class customers.
Learn More ACK One
Provides a control plane to allow users to manage Kubernetes clusters that run based on different infrastructure resources
Learn MoreMore Posts by Alibaba Cloud Native Community