You can play back historical gateway traffic based on gateway access logs with simple configurations in the Performance Testing Service (PTS) console. This topic describes how to start performance testing based on access logs.
Overview

Access log-based performance testing allows you to play back historical gateway traffic with simple configurations, parameterize performance testing requests, and automatically create test scenarios. Access log-based performance testing also resolves logon session timeout issues by using simple logon API configurations. To use access log-based performance testing, complete the following configurations:
Configure log producers: Access logs may come from Application Load Balancer (ALB) instances, Classic Load Balancer (CLB) instances, Microservices Engine (MSE) gateways, or self-managed web services on Elastic Compute Service (ECS) instances. You must first deliver access logs to Simple Log Service. For information about how to deliver logs to Simple Log Service, see Access logs, Configure a CLB access log, Enable log shipping for a cloud-native gateway, and Collect logs in NGINX configuration mode.
Configure Simple Log Service: Configure settings to receive logs from log producers.
Configure performance testing based on access logs: Analyze logs stored in Simple Log Service, identify APIs for testing, and create a test scenario.
Configure a test scenario: After a scenario for access log-based performance testing is created, you are redirected to the Edit Scenario page to configure the scenario. You can also debug the scenario and start performance testing.
Log specifications
The index and value of the URL field must exist, and the index name must be request_uri, path, request_url, url, uri, requestURI, or requestURL. If the path and parameters of a URL are separately recorded, each parameter field must have a value and the index name of the parameter field must be method, http_method, or request_method.
To play back a POST request, the following requirements must be met:
The index and value of the HTTP POST body field must exist, and the index name must be body, http_body, http_request_body, or request_body. The body must be in the application/x-www-form-urlencoded, text/plain, or application/json format. The binary format is not supported.
The index and value of the Content-Type field must exist, and the index name must be content_type or contentType. Otherwise, PTS automatically infers the Content-Type field.
If you use an MSE gateway, you can print the bodies of POST requests in gateway logs. For more information, see Add complete request and response information to access logs. PTS can directly play back POST requests whose bodies are printed in gateway logs.
If you use the simple mode, the following log specifications must be met. Logs that do not meet the specifications are ignored.
The index and value of the domain name field must exist, and the index name must be host, http_host, or authority.
The index and value of the HTTP protocol field must exist, the index name must be http_protocol, protocol, scheme, or http_scheme, and the value must be http or https. Otherwise, http is automatically used.
Step 1: Create a scenario for access log-based performance testing
Before you start, make sure that you have created a project and a Standard Logstore, collected logs, and enabled indexing. For more information, see Create a project, Create a Logstore, and Create indexes.
Log on to the PTS V3.0 console. In the left-side navigation pane, choose . Then, click Access Log.

Query and analyze logs
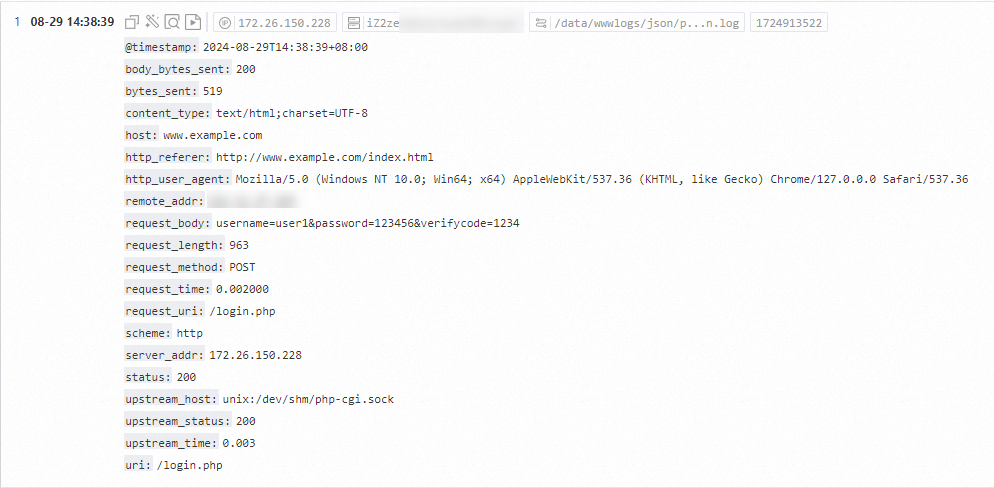
Select the Log Region, Log Project, and Logstore to which the access logs that you want to play back belong. Configure the query parameters and specify a time range. Then, click Search & Analyze to query the logs that you want to play back. The log indexes must meet the log specifications. Logs that do not meet the specifications are ignored. Sample log:

Step 2: Select a performance testing mode
On the Access Log Test Scenario page, turn on Simple Playback Mode and click Select APIs for Testing to configure parameters in simple mode. If you want to use the standard mode, turn off Simple Playback Mode and click Select APIs for Testing.

The simple mode allows you to play back traffic recorded in the logs without parsing the request structure or imposing limits on the number of domain names and APIs. The simple mode controls only the number of requests per second (RPS) in the entire scenario and does not consider the logon status.
The standard mode allows you to configure the logon status, analyze the number of requests and the maximum queries per second (QPS) values of each API, and precisely control the load of each API. However, the standard mode limits the number of domain names and APIs.
You can select the simple mode or standard mode for log playback based on your business requirements. The following table compares the simple mode and standard mode.
Performance testing mode | Description |
Simple mode |
|
Standard mode |
|
Simple mode
Configure playback parameters
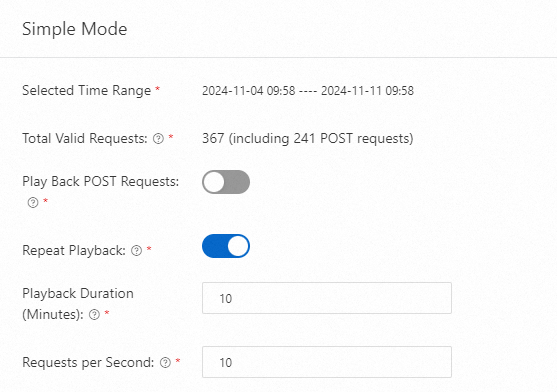
In simple mode, the number of valid requests in the selected time range is displayed in the analysis result. You can configure the following parameters:
Play Back POST Requests: Enable this parameter to allow PTS to play back POST requests. If the request bodies are not recorded in access logs, the POST requests that are played back do not include the request bodies. This may cause errors. Exercise caution when you enable this parameter.
Repeat Playback: Enable this parameter to allow the playback to loop back to the beginning of the logs after the end is reached. If you disable this parameter, PTS stops generating loads when the playback reaches the end of the logs. If the playback duration does not end, the playback does not automatically stop. To prevent excess VUM (Virtual User × Minute) consumption, manually stop the playback after PTS stops generating loads.
Playback Duration (Minutes): Specify the duration of traffic playback. Default value: 10. Unit: minute.
Requests per Second: Specify the rate at which traffic is played back. PTS plays back your access log traffic at the specified rate. The rate is evenly assigned to each abstract API.

Create the test scenario
Click Create Scenario. PTS summarizes the playback configurations. Then, click Confirm to go to the Edit Scenario page. You can configure the created scenario on the Edit Scenario page. You can also skip (Optional) Step 3: Configure the test scenario and proceed to Step 4: Start performance testing.
Standard mode
If the logs contain the requested domain name and the name of the domain name field is host, http_host, or authority, PTS automatically completes the host. You can change the host. Only a single host is supported. All APIs share the same host. If you want to play back multiple domain names, you can select multiple APIs in sequence to create a test scenario and configure the scenario to play back the domain names.
Select APIs for testing
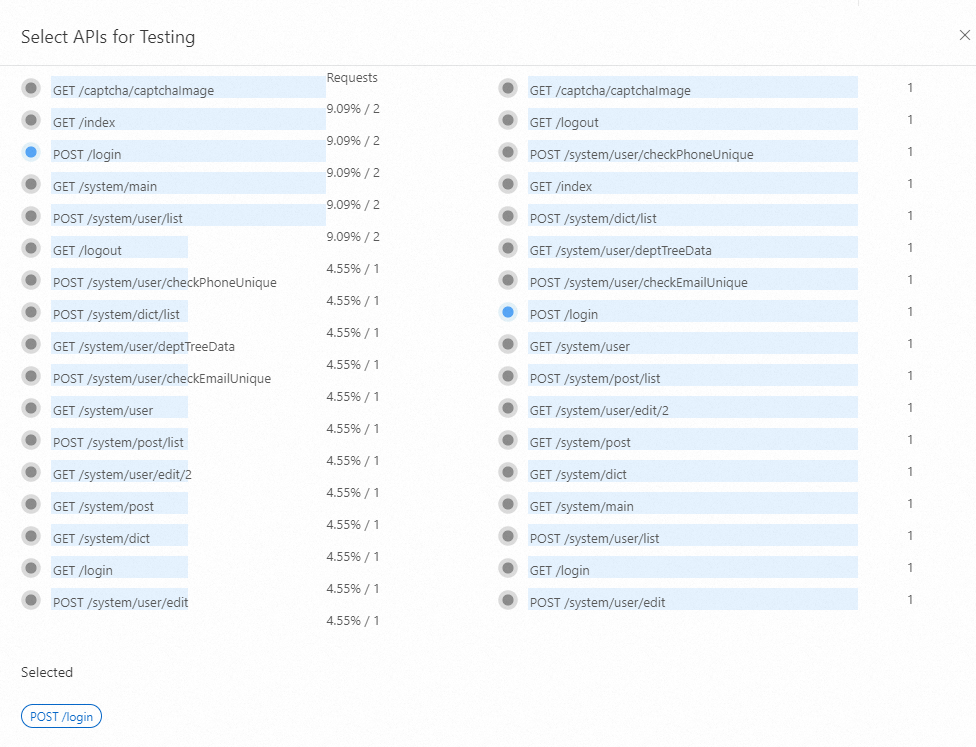
PTS analyzes the access logs and displays the top 10 APIs based on the number of requests and the maximum QPS within the selected time range. To select APIs for testing, click the gray circle next to an API. The selected APIs are displayed in the Selected section.

Configure performance testing parameters
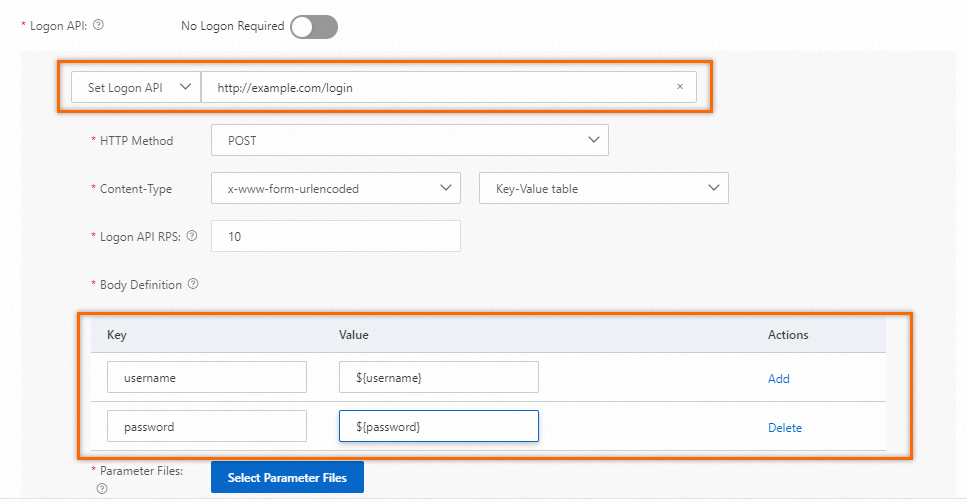
If you do not need to log on to the APIs that you want to test, turn on No Logon Required. If the APIs that you want to test require logon status information, use one of the following methods to specify a logon API:
a. Select Select from APIs. If a logon API is displayed in the Select from APIs drop-down list, you can select the API. PTS uses the selected API as the logon API, uses the parameters in the logs, and exports cookies as the logon status without manual configuration.

b. Select Set Logon API. If no logon API is displayed in the Select from APIs drop-down list, you can configure a logon API. Enter the URL of the logon API. Example: http://example.com/login. Configure body parameters, such as the username and password, for the logon API. You can use ${} to reference parameters. To query the parameters that you can reference, click Select Parameter Files. For more information, see Data sources.

After you confirm that the configurations are correct, click Create Scenario. You are redirected to the Edit Scenario page. You can configure the scenario on the Edit Scenario page. You can also skip (Optional) Step 3: Configure the test scenario and proceed to Step 4: Start performance testing.
(Optional) Step 3: Configure the test scenario
Click Export Data to specify the number of cookies that you can use in the performance test. If you want to use other logon status information, such as tokens, click the logon API, configure output parameters, and then configure export settings on the data export node. For more information, see Use a data export instruction.

Click an API to add a header to the API.

Configure load settings. For more information, see Load modes and Specify the number of IP addresses from which the testing traffic originates.
Step 4: Start performance testing
Click Debug to debug the scenario that you created and check whether the configurations are correct. For more information, see Debug a stress testing scenario.
Click Save and Start. In the dialog box that appears, select Execute Now and click Start. The performance testing process page appears. You can view various performance metrics on this page.

Step 5: Analyze the performance testing results
After the performance test is complete, you can view the test report on the Reports page. For more information, see View a PTS-based stress testing report.