All Products
Search
Document Center

Simple Log Service:Collect text logs from servers

Last Updated:Nov 29, 2024

This topic describes how to use Logtail to collect text logs from servers.

Prerequisites

  • A machine group has been created, and servers have been added to the machine group. We recommend that you create a custom identifier-based machine group. For more information, see Create a custom identifier-based machine group or Create an IP address-based machine group.

  • Ports 80 (HTTP) and 443 (HTTPS) for outbound traffic are enabled for the server on which Logtail is installed. If the server is an Elastic Computing Service (ECS) instance, you can reconfigure the related security group rules to enable the ports. For more information about how to configure a security group rule, see Add a security group rule.

  • The server from which you want to collect logs continuously generates logs. Logtail collects only incremental logs. If a log file on your server is not updated after a Logtail configuration is delivered and applied to the server, Logtail does not collect logs from the file. For more information, see Read log files.

Procedure

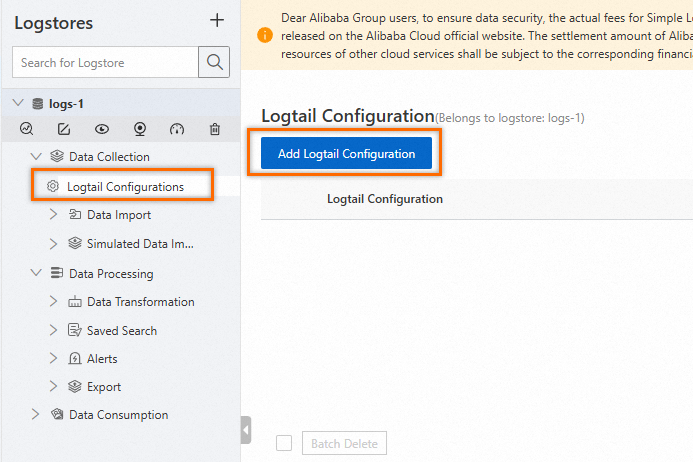
  1. Log on to the Simple Log Service console.

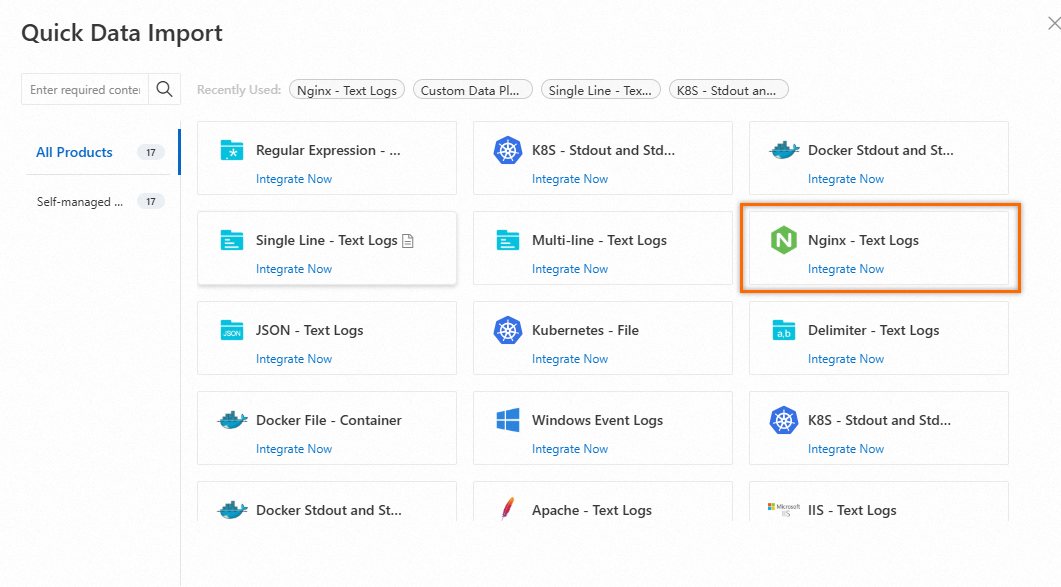
  2. In the Import Data section, search by Text Logs and click one of the cards that are displayed. In this example, click Multi-line - Text Logs.

    image

  3. In the Select Logstore step, select a project and a logstore and click Next.

    image

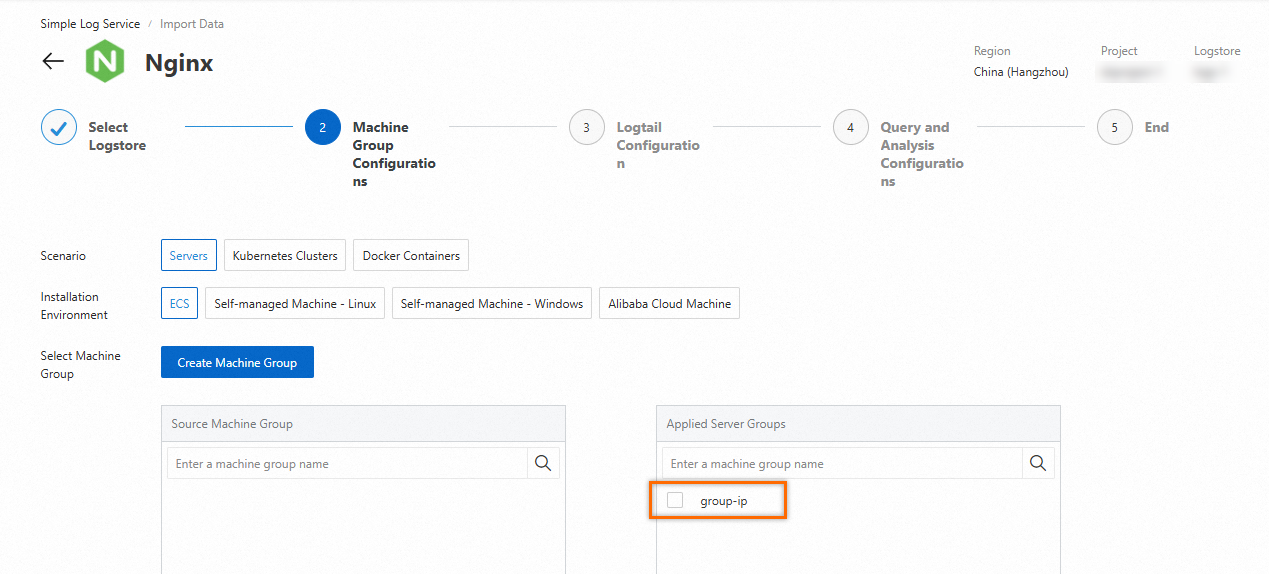
  4. In the Machine Group Configurations step, configure a machine group.

    1. Configure the Scenario and Installation Environment parameters based on your business requirements.

      Important

      You must configure the Scenario and Installation Environment parameters regardless of whether a machine group is available. The parameter settings affect subsequent configurations.

    2. Make sure that a machine group is displayed in the Applied Server Groups section and click Next.

      Machine group available

      Select a machine group from the Source Machine Group section.

      image

      No machine group available

      Click Create Machine Group. In the Create Machine Group panel, configure the parameters. You can set the Machine Group Identifier parameter to IP Address or Custom Identifier. For more information, see Create a custom identifier-based machine group or Create an IP address-based machine group.

      Important

      If you apply a machine group immediately after you create the machine group, the heartbeat status of the machine group may be FAIL. This issue occurs because the machine group is not connected to Simple Log Service. To resolve this issue, you can click Retry. If the issue persists, see What do I do if no heartbeat connections are detected on Logtail?

  5. Create a Logtail configuration and click Next. A Logtail configuration requires up to 3 minutes to take effect.

    • Global Configurations

      Parameter

      Description

      Configuration Name

      Enter a name for the Logtail configuration. The name must be unique in a project. After you create the Logtail configuration, you cannot change its name.

      Log Topic Type

      Select a method to generate log topics. For more information, see Log topics.

      • Machine Group Topic: The topics of the machine groups are used as log topics. If you want to distinguish the logs from different machine groups, select this option.

      • File Path Extraction: You must specify a custom regular expression. A part of the file path that matches the regular expression is used as the log topic. If you want to distinguish the logs from different sources, select this option.

      • Custom: You must specify a custom log topic.

      Advanced Parameters

      Optional. Configure the advanced parameters that are related to global configurations. For more information, see CreateLogtailPipelineConfig.

    • Input Configurations

      Parameter

      Description

      File Path

      Specify the directory and name of log files based on the location of the logs on your server, such as an ECS instance.

      • If you specify a file path in a Linux operating system, the path must start with a forward slash (/). Example: /apsara/nuwa/**/app.Log.

      • If you specify a file path in a Windows operating system, the path must start with a drive letter. Example: C:\Program Files\Intel\**\*.Log.

      You can specify an exact directory and an exact name. You can also use wildcard characters to specify the directory and name. For more information, see Wildcard matching. When you configure this parameter, you can use only the asterisk (*) or question mark (?) as wildcard characters.

      Simple Log Service scans all levels of the specified directory to find the log files that match the specified conditions. Examples:

      • If you specify /apsara/nuwa/**/*.log, Simple Log Service collects logs from the log files whose names are suffixed by .log in the /apsara/nuwa directory and the recursive subdirectories of the directory.

      • If you specify /var/logs/app_*/**/*.log, Simple Log Service collects logs from the log files that meet the following conditions: The file name is suffixed by .log. The file is stored in a subdirectory of the /var/logs directory or in a recursive subdirectory of the subdirectory. The name of the subdirectory matches the app_* pattern.

      • If you specify /var/log/nginx/**/access*, Simple Log Service collects logs from the log files whose names start with access in the /var/log/nginx directory and the recursive subdirectories of the directory.

      Maximum Directory Monitoring Depth

      Specify the maximum number of levels of subdirectories that you want to monitor. The subdirectories are in the log file directory that you specify. This parameter specifies the levels of subdirectories that can be matched by the ** wildcard characters included in the value of File Path. A value of 0 indicates that only the log file directory that you specify is monitored.

      File Encoding

      Select the encoding format of log files.

      First Collection Size

      Specify the size of data that Logtail can collect from a log file the first time Logtail collects logs from the file. The default value of First Collection Size is 1024. Unit: KB.

      • If the file size is less than 1,024 KB, Logtail collects data from the beginning of the file.

      • If the file size is greater than 1,024 KB, Logtail collects the last 1,024 KB of data in the file.

      You can configure First Collection Size based on your business requirements. Valid values: 0 to 10485760. Unit: KB.

      Collection Blacklist

      If you turn on Collection Blacklist, you must configure a blacklist to specify the directories or files that you want Simple Log Service to skip when it collects logs. You can specify exact directories and file names. You can also use wildcard characters to specify directories and file names. When you configure this parameter, you can use only the asterisk (*) or question mark (?) as wildcard characters.

      Important
      • If you use wildcard characters to specify a value for File Path and you want to skip some subdirectories in the specified directory, you must configure Collection Blacklist to specify the subdirectories. You must specify complete subdirectories.

        For example, if you set File Path to /home/admin/app*/log/*.log and you want to skip all subdirectories in the /home/admin/app1* directory, you must select Directory Blacklist and enter /home/admin/app1*/** in the Directory Name field. If you enter /home/admin/app1*, the blacklist does not take effect.

      • When a blacklist is in use, computational overhead is generated. We recommend that you add no more than 10 entries to a blacklist.

      • You cannot specify a directory that ends with a forward slash (/). For example, if you specify the /home/admin/dir1/ directory in a directory blacklist, the directory blacklist does not take effect.

      The following types of blacklists are supported: File Path Blacklist, File Blacklist, and Directory Blacklist.

      File Path Blacklist

      • If you select File Path Blacklist and enter /home/admin/private*.log in the File Path Name field, all files whose names are prefixed by private and suffixed by .log in the /home/admin/ directory are skipped.

      • If you select File Path Blacklist and enter /home/admin/private*/*_inner.log in the File Path Name field, all files whose names are suffixed by _inner.log in the subdirectories whose names are prefixed by private in the /home/admin/ directory are skipped. For example, the /home/admin/private/app_inner.log file is skipped, but the /home/admin/private/app.log file is not skipped.

      File Blacklist

      If you select File Blacklist and enter app_inner.log in the File Name field, all files whose names are app_inner.log are skipped.

      Directory Blacklist

      • If you select Directory Blacklist and enter /home/admin/dir1 in the Directory Name field, all files in the /home/admin/dir1 directory are skipped.

      • If you select Directory Blacklist and enter /home/admin/dir* in the Directory Name field, all files in the subdirectories whose names are prefixed by dir in the /home/admin/ directory are skipped.

      • If you select Directory Blacklist and enter /home/admin/*/dir in the Directory Name field, all files in the dir subdirectory in each second-level subdirectory of the /home/admin/ directory are skipped. For example, the files in the /home/admin/a/dir directory are skipped, but the files in the /home/admin/a/b/dir directory are not skipped.

      Allow File to Be Collected for Multiple Times

      By default, you can use only one Logtail configuration to collect logs from a log file. If you want to collect multiple copies of logs from a log file, you must turn on Allow File to Be Collected for Multiple Times.

      Advanced Parameters

      Optional. Configure the advanced parameters that are related to input plug-ins. For more information, see CreateLogtailPipelineConfig.

    • Processor Configurations

      Parameter

      Description

      Log Sample

      Add a sample log that is collected from an actual scenario. You can use the sample log to configure parameters that are related to log processing with ease. You can add multiple sample logs. Make sure that the total length of the logs does not exceed 1,500 characters.

      [2023-10-01T10:30:01,000] [INFO] java.lang.Exception: exception happened
          at TestPrintStackTrace.f(TestPrintStackTrace.java:3)
          at TestPrintStackTrace.g(TestPrintStackTrace.java:7)
          at TestPrintStackTrace.main(TestPrintStackTrace.java:16)

      Multi-line Mode

      • Specify the type of multi-line logs. A multi-line log spans multiple consecutive lines. You can configure this parameter to identify each multi-line log in a log file.

        • Custom: A multi-line log is identified based on the value of Regex to Match First Line.

        • Multi-line JSON: Each JSON object is expanded into multiple lines. Example:

          {
            "name": "John Doe",
            "age": 30,
            "address": {
              "city": "New York",
              "country": "USA"
            }
          }
      • Configure Processing Method If Splitting Fails.

        Exception in thread "main" java.lang.NullPointerException
            at com.example.MyClass.methodA(MyClass.java:12)
            at com.example.MyClass.methodB(MyClass.java:34)
            at com.example.MyClass.main(MyClass.java:½0)

        For the preceding sample log, Simple Log Service can discard the log or retain each single line as a log when it fails to split the log.

        • Discard: The log is discarded.

        • Retain Single Line: Each line of log text is retained as a log. Four logs are retained.

      Processing Method

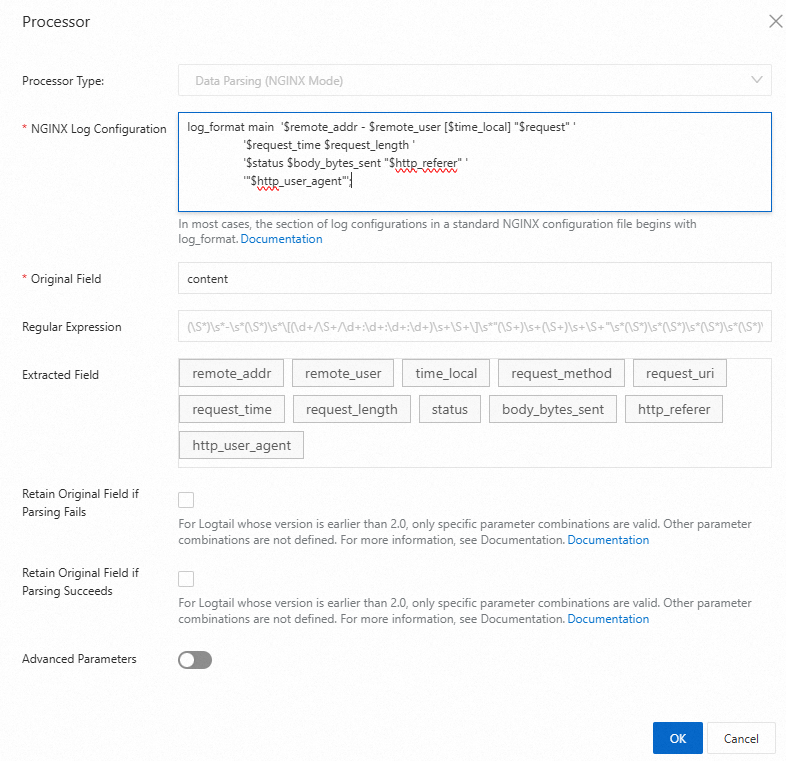
      Select Processors. You can add native plug-ins and extended plug-ins for data processing. For more information about Logtail plug-ins for data processing, see Logtail plug-ins overview.

      Important

      You are subject to the limits of Logtail plug-ins for data processing. For more information, see the on-screen instructions in the Simple Log Service console.

      • Logtail earlier than V2.0

        • You cannot add native plug-ins and extended plug-ins at the same time.

        • You can use native plug-ins only to collect text logs. When you add native plug-ins, take note of the following items:

          • You must add one of the following Logtail plug-ins for data processing as the first plug-in: Data Parsing (Regex Mode), Data Parsing (Delimiter Mode), Data Parsing (JSON Mode), Data Parsing (NGINX Mode), Data Parsing (Apache Mode), and Data Parsing (IIS Mode).

          • After you add the first plug-in, you can add one Time Parsing plug-in, one Data Filtering plug-in, and multiple Data Masking plug-ins.

        • You can add extended plug-ins only after you add native plug-ins.

      • Logtail V2.0

        • You can arbitrarily combine native plug-ins for data processing.

        • You can combine native plug-ins and extended plug-ins. Make sure that extended plug-ins are added after native plug-ins.

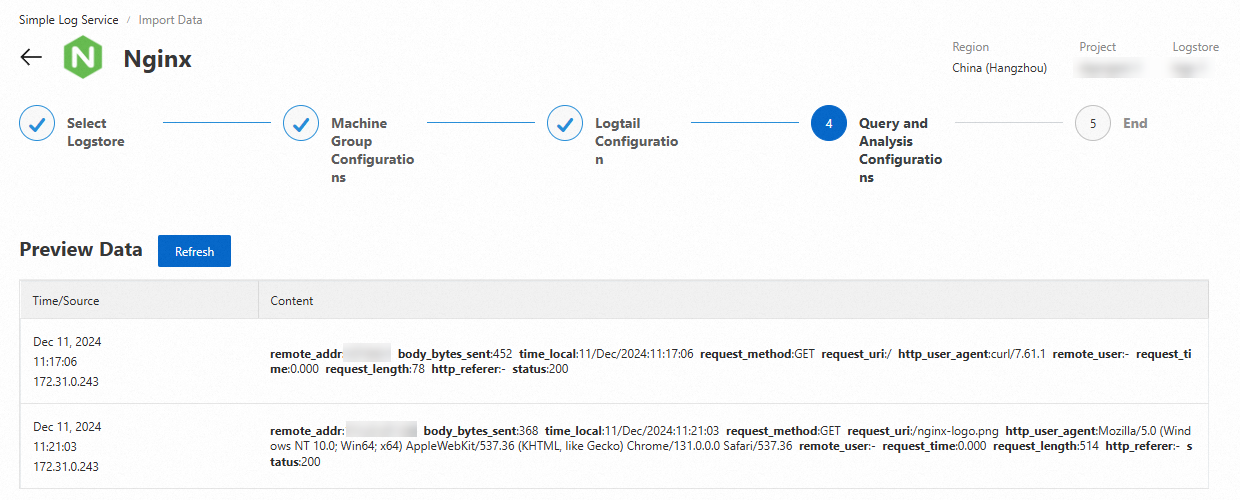
  6. Create indexes and preview data. Then, click Next. By default, full-text indexing is enabled in Simple Log Service. You can also manually create field indexes for the collected logs or click Automatic Index Generation. Then, Simple Log Service generates field indexes. For more information, see Create indexes.

    Important

    If you want to query all fields in logs, we recommend that you use full-text indexes. If you want to query only specific fields, we recommend that you use field indexes. This helps reduce index traffic. If you want to analyze fields, you must create field indexes. You must include a SELECT statement in your query statement for analysis.

  7. Click Query Log. Then, you are redirected to the query and analysis page of your Logstore.

    You must wait approximately 1 minute for the indexes to take effect. Then, you can view the collected logs on the Raw Logs tab. For more information about how to query and analyze logs, see Query and analyze logs.

References