To query and analyze logs in a logstore, you must first create an index. This topic explains what indexes are, the available types, and how to configure them. It also covers billing, configuration examples, and how to disable indexing.
Why do I need to create indexes?
In most cases, you can use keywords to query data from raw logs. For example, you want to obtain the curl/7.74.0 log that contains the curl keyword. If log splitting is not performed, the log is considered as a whole and the system does not associate the log with the curl keyword. In this case, you cannot obtain the log in Simple Log Service.
To search for the log, you must split the log into separate and searchable words. You can split a log by using delimiters. Delimiters determine the positions at which a log is split. In this example, you can use the following delimiters to split the preceding log: \n\t\r,;[]{}()&^*#@~=<>/\?:'". The log is split into curl and 7.74.0. Simple Log Service creates indexes based on the words that are obtained after log splitting. After indexes are created, you can query and analyze the log.
Simple Log Service supports full-text indexes and field indexes. If you define a field index for a specific field, the rules of that field index override the global full-text indexing rules for that field.
Index types
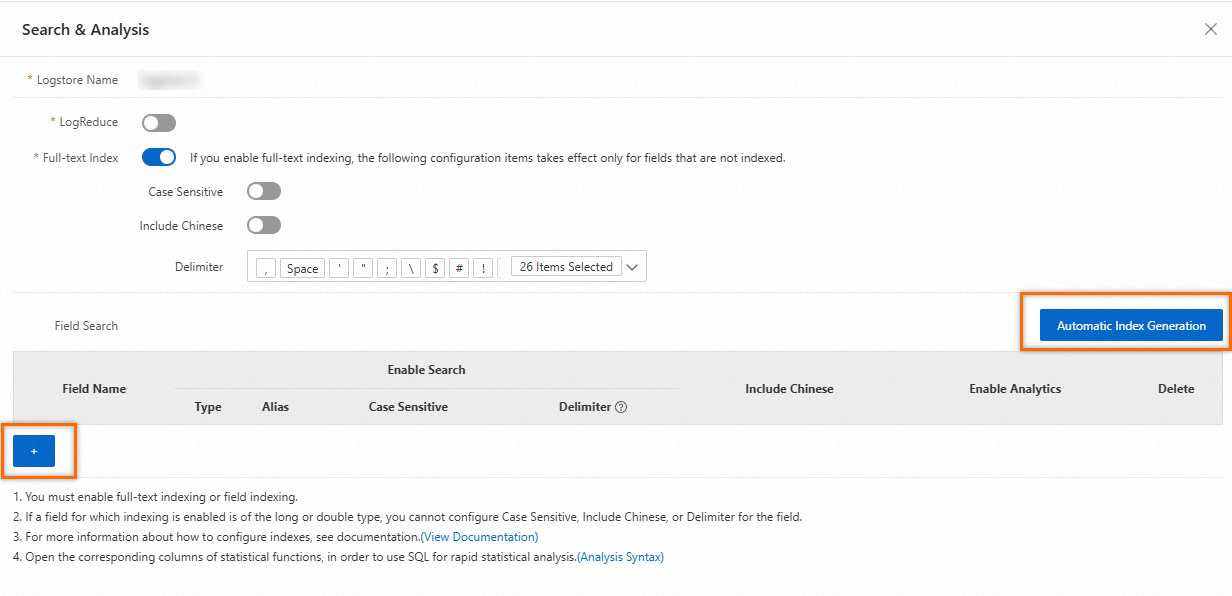
Full-text indexes
Simple Log Service splits a log into multiple words that are of the TEXT type by using delimiters. After you create full-text indexes, you can query logs by using keywords. For example, you can query logs that contain Chrome or Safari based on the following search statement: Chrome or Safari.
Chinese content cannot be split by using delimiters. However, if you want to split Chinese content, you can turn on Include Chinese. Then, Simple Log Service automatically splits the Chinese content based on Chinese grammar.
If you create only full-text indexes for your Logstore, you can use only the full-text search syntax to specify query conditions. For more information, see Search syntax and functions.
Field indexes
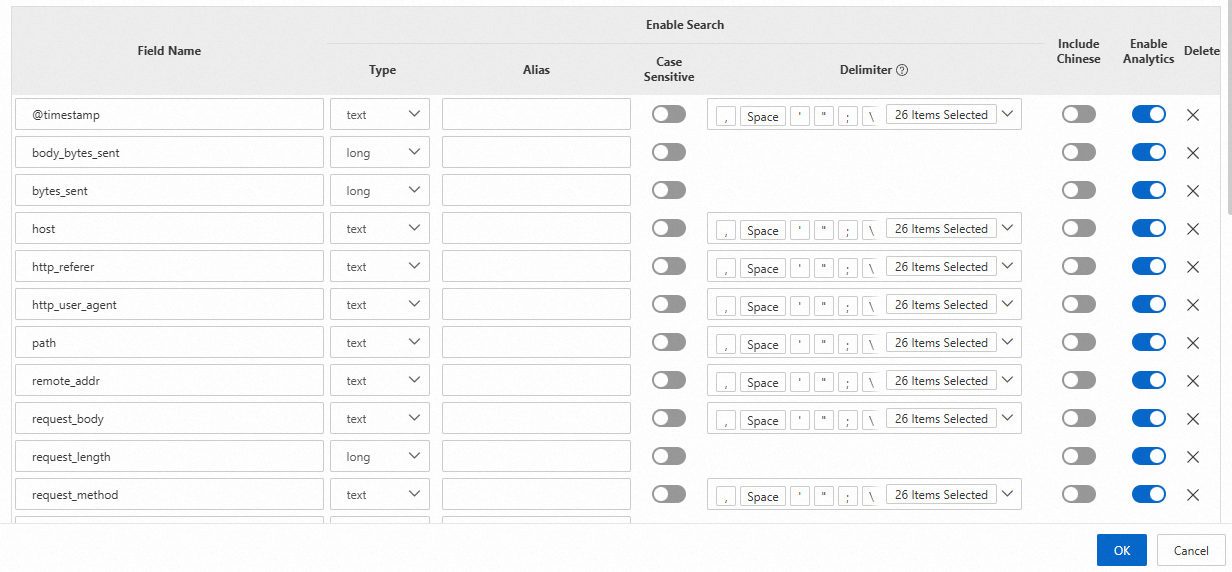
Simple Log Service distinguishes logs by field name and then splits the fields by using delimiters. Supported field types are TEXT, LONG, DOUBLE and JSON. For more information, see Data types. After you create field indexes, you can specify field names and field values in the key:value format to query logs. You can also use a SELECT statement to query logs. For more information, see Search syntax and functions.
If you want to query and analyze fields, you must create field indexes and use a SELECT statement. Field indexes have a higher priority than full-text indexes. If you define a field index for a specific field, the rules of that field index override the global full-text indexing rules for that field.
Fields of the TEXT type: You can use full text-based search statements, field-based search statements, and analytic statements to query and analyze data. An analytic statement includes a SELECT statement.
If full-text indexing is not enabled, full text-based search statements query data from all fields of the TEXT type.
If full-text indexing is enabled, full text-based search statements query data from all logs.
Fields of the LONG or DOUBLE type: You can use field-based search statements and analytic statements to query and analyze data. An analytic statement includes a SELECT statement.
Create indexes
Query and analysis results vary based on index configurations. You must create indexes based on your business requirements. After indexes are created, the indexes take effect within approximately 1 minute.
New indexes take effect only for new logs. To query historical logs, you must reindex the logs. For more information, see Reindex logs for a Logstore.
Simple Log Service automatically creates indexes for specific reserved fields. For more information, see Reserved fields.
Simple Log Service leaves delimiters empty when it creates indexes for the
__topic__and__source__reserved fields. Therefore, only exact match is supported when you specify keywords to query the two fields.Fields that are prefixed with
__tag__do not support full-text indexes. If you want to query and analyze fields that are prefixed with __tag__, you must create field indexes. Sample query statement:*| select "__tag__:__receive_time__".If a log contains two fields whose names are the same, such as request_time, Simple Log Service displays one of the fields as request_time_0. The two fields are still stored as request_time in Simple Log Service. If you want to query, analyze, ship, transform, or create indexes for the fields, you must use request_time.
Console
API
SDK
CLI
Update indexes
Procedure
Disable the indexing feature
After you disable the indexing feature for a Logstore, the storage space that is occupied by historical indexes is automatically released after the data retention period of the Logstore elapses.
Procedure
Index configuration examples
Example 1
A log contains the request_time field, and the request_time>100 field-based search statement is executed.
If only full-text indexes are created, logs that contain
request_time,>, and100are returned. The greater-than sign (>) is not a delimiter.If only field indexes are created and the field types are DOUBLE and LONG, logs whose
request_timefield value is greater than 100 are returned.If both full-text indexes and field indexes are created and the field types are DOUBLE and LONG, the full-text indexes do not take effect for the
request_timefield and logs whoserequest_timefield value is greater than 100 are returned.
Example 2
A log contains the request_time field, and the request_time full text-based search statement is executed.
If only field indexes are created and the field types are DOUBLE and LONG, no logs are returned.
If only full-text indexes are created, logs that contain the
request_timefield are returned. In this case, the statement queries data from all logs.If only field indexes are created and the field type is TEXT, logs that contain the
request_timefield are returned. In this case, the statement queries data from all fields of the TEXT type.
Example 3
A log contains the status field, and the * | SELECT status, count(*) AS PV GROUP BY status query statement is executed.
If only full-text indexes are created, no logs are returned.
If a field index is created for the
statusfield and analytics are enabled for it, the query returns the total page views (PVs) for each status code.
Index traffic descriptions
Full-text indexes
All field names and field values are stored as text. In this case, field names and field values are both included in the calculation of index traffic.
Field indexes
The method that is used to calculate index traffic varies based on the data type of a field.
TEXT type: Field names and field values are both included in the calculation of index traffic.
LONG and DOUBLE types: Field names are not included in the calculation of index traffic. Each field value is counted as 8 bytes in index traffic.
For example, if you create an index for the
statusfield of the LONG type and the field value is200, the stringstatusis not included in the calculation of index traffic and the value200is counted as 8 bytes in index traffic.JSON type: Field names and field values are both included in the calculation of index traffic. The subfields that are not indexed are also included. For more information, see Why is index traffic generated for JSON subfields that are not indexed?
If a subfield is not indexed, index traffic is calculated by regarding the data type of the subfield as TEXT.
If a subfield is indexed, index traffic is calculated based on the data type of the subfield. The data type can be TEXT, LONG or DOUBLE.
Billing overview
Logstores that use the pay-by-ingested-data billing mode
Indexes occupy storage space. For more information about storage types, see Configure intelligent tiered storage.
Reindexing does not generate fees.
For more information about the billing of index traffic, see Billable items of pay-by-ingested-data.
Logstores that use the pay-by-feature billing mode
Indexes occupy storage space. For more information about storage types, see Configure intelligent tiered storage.
When you create indexes, traffic is generated. You are charged for index traffic based on the "index traffic of log data" and "index traffic of log data in Query Logstores" billable items. For more information, see Billable items of pay-by-feature. For more information about how to reduce index traffic, see How do I reduce index traffic fees?
Reindexing generates fees. During reindexing, you are charged based on the same billable items and prices as when you create indexes.
What to do next
For more information about query and analysis examples, see the following topics:
For more information about how to improve query performance, see Accelerate the query and analysis of logs.
For more information about how to query and analyze JSON-formatted website logs, see Query and analyze JSON logs.


