After a batch synchronization task that is created in DataStudio is committed and deployed to the production environment, you can go to Operation Center to manage the batch synchronization task, monitor the status of the task, change the resource group that is used to run the task, and view the run logs of the task. This ensures that the synchronization task can be run as expected. This topic describes the common O&M operations that you can perform on a batch synchronization task.
Prerequisites
A batch synchronization task is created, deployed, and run as expected. For more information, see Configure a batch synchronization task by using the codeless UI and Configure a batch synchronization task by using the code editor.
Usage notes
The O&M operations that can be performed on batch synchronization tasks are the same as the O&M operations that can be performed on other types of auto triggered tasks. This topic describes how to perform common O&M operations on batch synchronization tasks. For more information about O&M for auto triggered tasks, see Perform basic O&M operations on auto triggered tasks.
To ensure that a batch synchronization node can be run as expected after you deploy the node, you can go to the Auto Triggered Nodes page in Operation Center in the production environment to check whether the configurations of the node in the production environment meet your requirements. The configurations include the code of the node and the resource groups for scheduling and for Data Integration used to run the node.
Batch synchronization tasks are issued to a resource group for Data Integration by using a resource group for scheduling. Therefore, execution of batch synchronization tasks requires both a resource group for Data Integration and a resource group for scheduling. If you use an exclusive resource group for scheduling, you are charged for scheduling instances. For more information, see Overview.
Workspaces in standard mode support isolation of data sources.
Before a task is deployed to the production environment, the system accesses the databases or data warehouses in the development environment that correspond to the data sources you added to the task by default.
After a task is deployed to the production environment, the system accesses the databases or data warehouses in the production environment that correspond to the data sources you added to the task by default.
For more information, see Isolate a data source in the development and production environments.
Schedule and manage a batch synchronization task
DataWorks provides powerful scheduling capabilities for you to run batch synchronization tasks. You can configure scheduling parameters for a batch synchronization task to write incremental and full data to a specific partition of a destination table. The O&M operations that can be performed on batch synchronization tasks are the same as the O&M operations that can be performed on other types of auto triggered tasks. You can also manually run a batch synchronization task.
Operation | Description |
Run a batch synchronization task | After you deploy a batch synchronization task to the production environment, you can go to the Auto Triggered Nodes page in Operation Center in the production environment to view the task. The scheduling system runs the task based on the configurations of the scheduling parameters. You can also manually run the task.
|
Suspend scheduling of a batch synchronization task | On the Auto Triggered Nodes page in Operation Center, you can freeze an auto triggered task for a period of time. After you freeze the auto triggered task, the auto triggered task and its descendant tasks cannot be run. Note Instances are generated for an auto triggered task after the task is run. If an auto triggered instance and its descendant instances do not need to be run, you can freeze the current auto triggered instance. |
Resume scheduling of a batch synchronization task | On the Auto Triggered Nodes page in Operation Center, you can unfreeze an auto triggered task. After you unfreeze the auto triggered task, the task can be run as expected. Note Instances generated for a frozen auto triggered task are also frozen. If you want to run a frozen auto triggered instance and its descendant instances, you can unfreeze the current auto triggered instance. |
Synchronize historical data
DataWorks allows you to synchronize historical data to a specified table or partition in the destination database or data warehouse based on the scheduling parameter configurations and data backfill configurations of a batch synchronization task. If you want to configure a batch synchronization task to synchronize incremental data and historical data to a specified partition in the destination table, you must configure the data backfill settings for the task. When you backfill data for the task, the system assigns the value that you specify for the Data Timestamp parameter to the variable of the related scheduling parameter. For more information about how to backfill data for a task, see Backfill data and view data backfill instances (new version).
Monitor the status of a batch synchronization task
You can create an alert rule to monitor the status of an auto triggered task on the Rule Management page. To go to the Rule Management page, perform the following operations: In the left-side navigation pane of the Operation Center page, choose . An alert notification is sent if the task is in a specified state, such as Completed, Uncompleted, Error, or Overtime. For more information, see Overview.
Perform O&M operations on resource groups
Monitor resource groups: On the Resource page of Operation Center, you can monitor the usage of resource groups that are used to run nodes. For more information, see Resource O&M.
Change resource groups: You can change the resource group that is used to run tasks to another resource group by using one of the methods described in the following table.
NoteBefore you change a resource group, make sure that network connections are established between the resource group that you want to select and the required data sources. If you do not establish the required network connections, nodes fail to run.
Operating environment
Supported operation
Entry point
Production environment
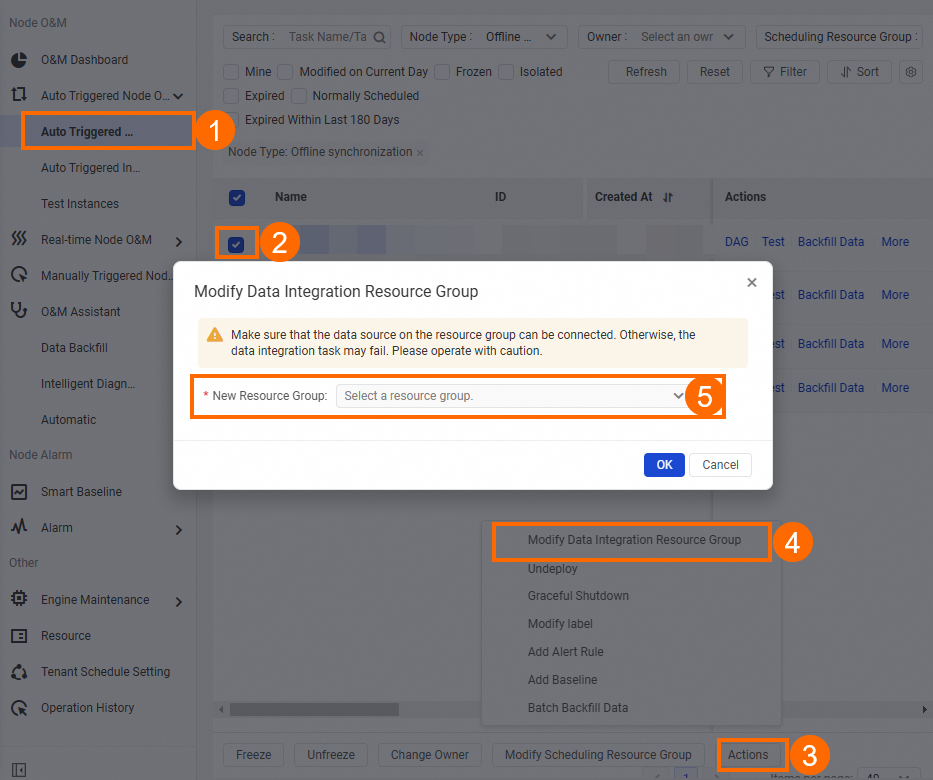
Change the resource groups for multiple tasks at the same time
Go to the Operation Center page. In the left-side navigation pane, choose .
Select the tasks for which you want to change the resource groups and click Modify Data Integration Resource Group at the bottom of the Auto Triggered Nodes page.

Development environment
NoteAfter you change the resource group for a task in the development environment, you must commit and deploy the task to the production environment again.
Change the resource group for a single node
Change the resource groups for multiple nodes at the same time
Go to the DataStudio page.
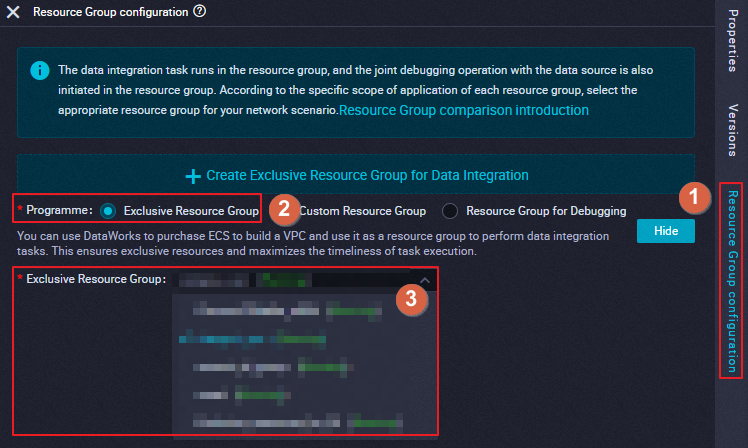
Change the resource group for a single task
Go to the configuration tab of the task for which you want to change the resource group and click Resource Group configuration in the right-side navigation pane. On the Resource Group configuration tab, you can change the resource group for the task.

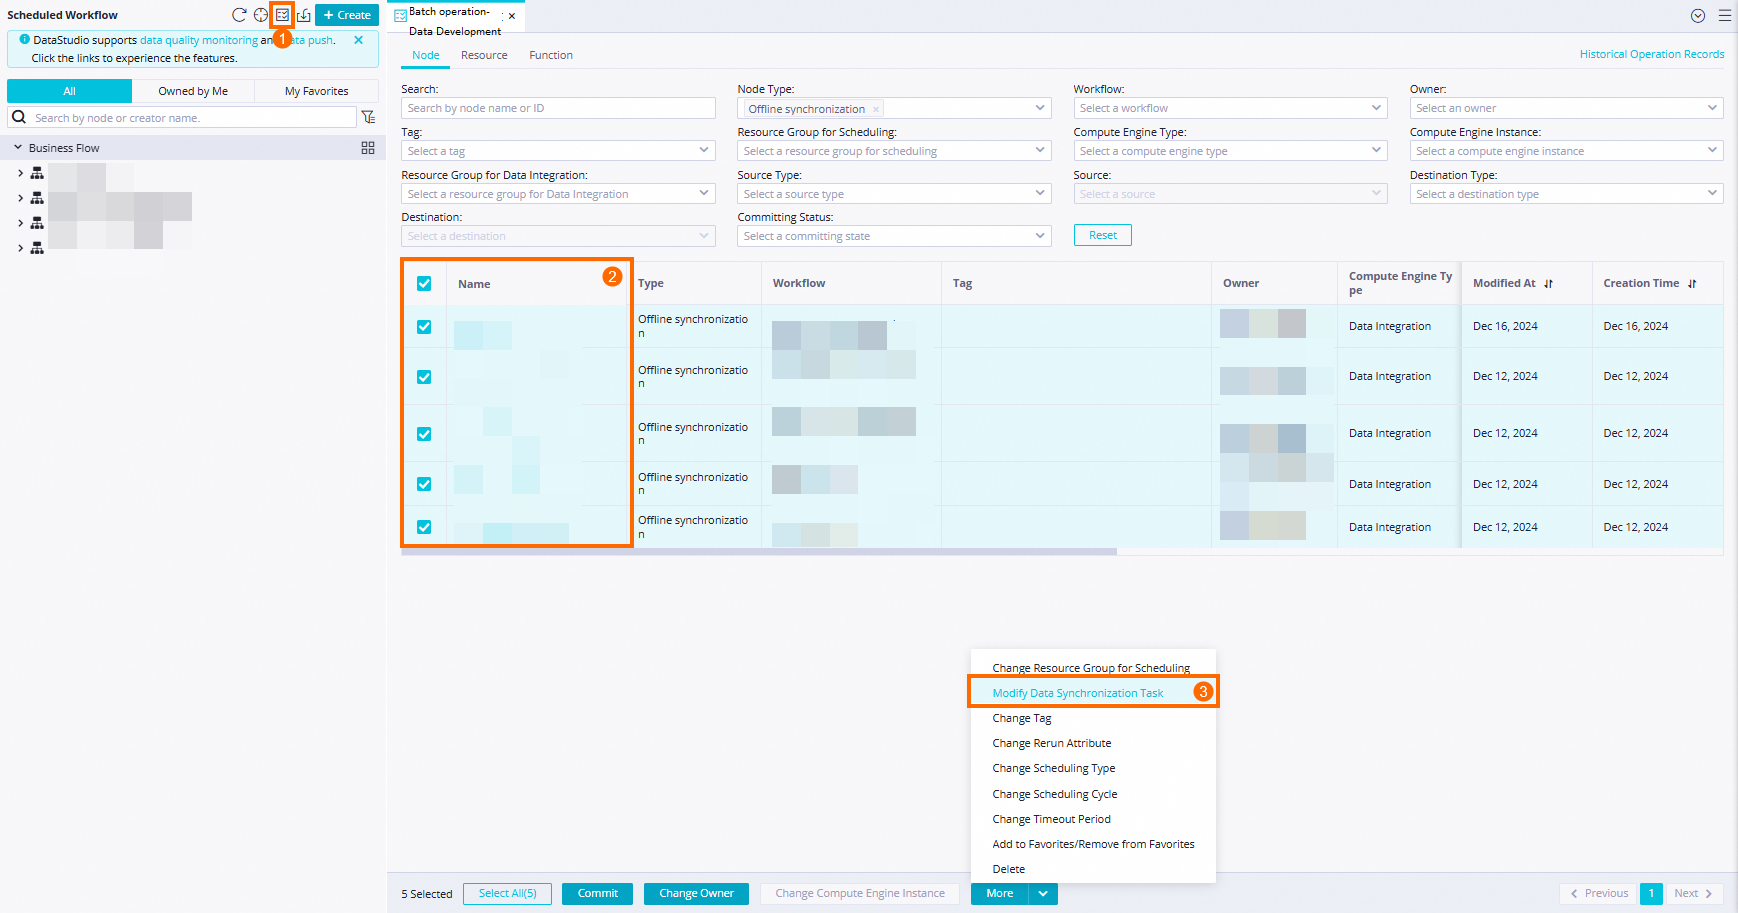
Change the resource groups for multiple nodes at the same time
Click the
 icon. On the Node tab, select the tasks for which you want to change the resource groups, click More in the lower part of the tab, and then select Change Resource Group for Data Integration.
Monitor the quality of table data
On the Data Quality page, you can configure monitoring rules for tables of some destinations to monitor the data quality of data in the tables. If you configure monitoring rules for a table, the monitoring rules are triggered after the scheduling node with which you associate the table is successfully run. If exceptions are detected, Data Quality determines whether to fail the task and block the descendant tasks based on the check result and rule settings, such as the rule type. This way, dirty data is stopped from being forwarded as downstream data. For more information about the destinations that support monitoring rules and how to use Data Quality, see Overview.
If you want to configure monitoring rules for tables generated by a batch synchronization task, make sure that a network connection is established between the resource group for scheduling that you use to run the task and the destination.
View the run logs of a batch synchronization task
After an auto triggered task instance, a data backfill instance, or a test instance is successfully run, you can go to the DAG page in Operation Center to view the run logs of the instances. For more information, see Appendix: Use the features provided in a DAG.
For more information about the parameters in the run logs, see Analyze run logs generated for a batch synchronization task.
View the statistics on batch synchronization tasks
On the Batch Synchronization subtab of the Data Integration tab under O&M Dashboard in Operation Center, you can view the statistics on node execution, such as execution status distribution, data synchronization progress, synchronized data volume, and details of synchronization tasks. You can search for the desired synchronization task based on the filter conditions such as Source Name, Destination Name, and Whether Internet Traffic Exists. For more information, see View the statistics on the O&M Dashboard page.
Use LogView to view the running information about tasks
This feature is in invitational preview. If you want to use the feature, contact technical personnel.
The LogView feature in Data Integration is used to collect data about data synchronization tasks in Data Integration based on events, analyze and process the data, and display analysis and processing results in a visualized manner. LogView can display and analyze information such as the data transmission rate and logs of a data synchronization task at a finer-grained granularity.
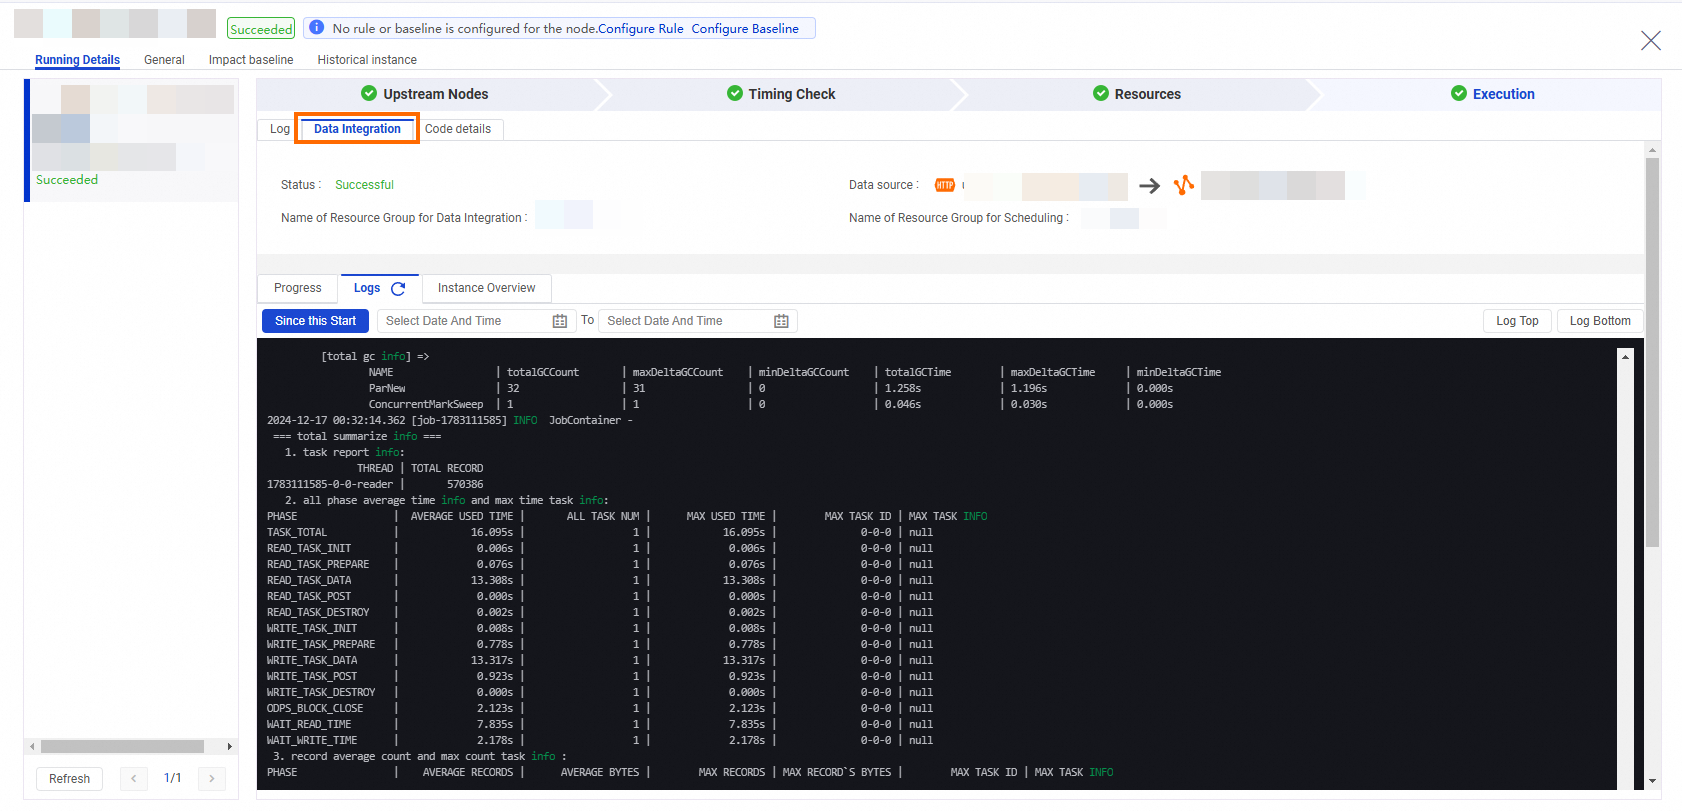
In the left-side navigation pane of Operation Center, choose Auto Triggered Node O&M > Auto Triggered Instances. On the Instance Perspective tab, find the desired instance and click Perform Diagnostics in the Actions column.

On the page that appears, click the Data Integration tab.
 Intelligent diagnosis
 Subtab
Description
Logs
On the Logs subtab, you can view the log details of Data Integration synchronization tasks.
Progress
On the Progress subtab, you can view the progress information about Data Integration synchronization tasks. The progress information includes the number of synchronized data records, the number of synchronized bytes, synchronization rate for synchronized data records, and synchronization rate for synchronized bytes.
You can also perform the following operations on this subtab:
Search for the synchronization information about a batch synchronization task in a specified period of time by using a time picker.
NoteYou can view the synchronization details about a task in the recent 15 days.
In the Processes section, click the
 icon to select the columns that you want to view.
 In the Processes section, click the value of a metric for a task to view the value changes of the metric in a curve chart.
Instance Overview
If your instance is an auto triggered instance, you can view the comparison details of the instance in various dimensions in different cycles on the Instance Overview subtab.
In the Tasks section, you can view the status and instance ID of the task. You can click the instance ID to view the task details.
You can also compare the synchronization rate, the number of synchronized records, the waiting time, and the synchronization duration of different instances in the column charts.