Directed acyclic graphs (DAGs) provided in Operation Center allow you to view the dependencies of nodes or instances, aggregate nodes or instances from different dimensions, and analyze the ancestor or descendant nodes of a node or the ancestor or descendant instances of an instance. This helps improve O&M efficiency. This topic describes the features provided in the DAG of an instance and how to use the features to manage instances in the DAG. In this topic, the DAG of an auto triggered instance is used.
Limits
Only users of DataWorks Professional Edition or a more advanced edition can use the aggregation, upstream analysis, and downstream analysis features provided by DAGs. For more information about how to upgrade the edition of DataWorks, see Billing of DataWorks editions.
Manage instances in a DAG
Click DAG in the Actions column of an auto triggered instance to view the DAG of the instance. You can perform the following operations in the DAG.
Aggregate instances
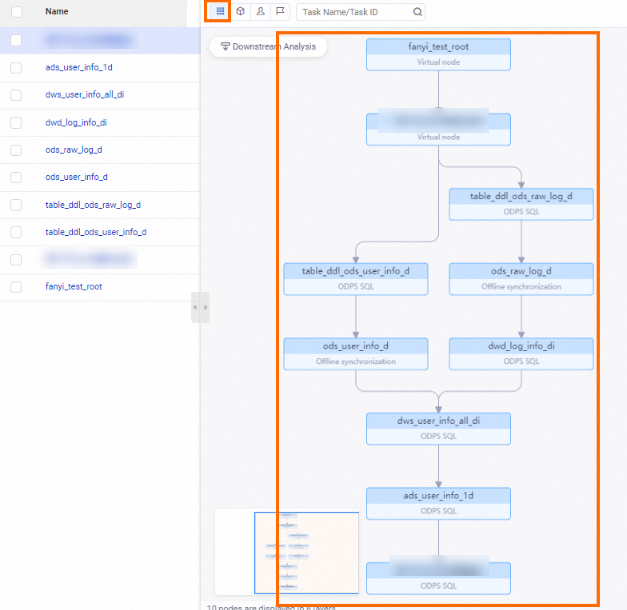
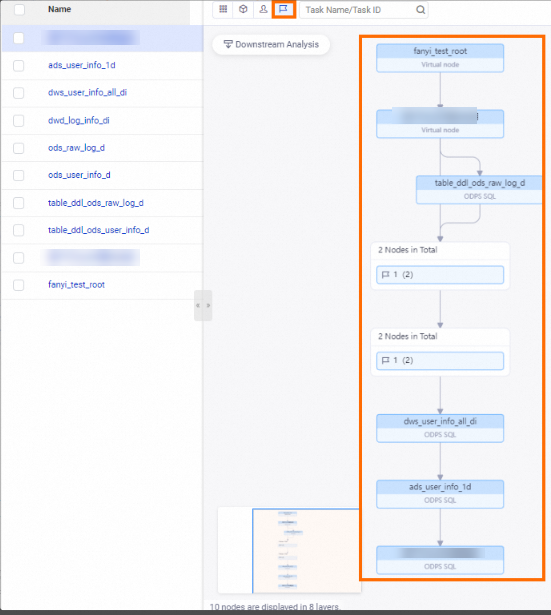
If an auto triggered instance has multiple ancestor or descendant instances or the ancestor or descendant instances are distributed at multiple levels, you can aggregate the instances from dimensions such as instance status, workspace, owner, and priority. Then, you can view the number of instances from your desired dimension. This allows you to have a command of the number of instances from different dimensions and helps the system properly run the instances. The following figures show the instance distribution when the descendant instances of an auto triggered instance are not aggregated or are aggregated by priority.
NoteYou can aggregate instances by status only in the DAG of an instance. The instance can be an auto triggered instance, a data backfill instance, or a test instance.
The following figure shows the instance distribution when the descendant instances of an auto triggered instance are not aggregated.
The following figure shows the instance distribution when the descendant instances of an auto triggered instance are aggregated by priority. The figure shows that the current auto triggered instance has six descendant instances whose priorities are 1.
Analyze ancestor instances
In most cases, an auto triggered instance has dependencies. If an auto triggered instance is not run for a long period of time, you can analyze the ancestor instances of the instance. You can view the ancestor instance that blocks the running of the instance in the DAG of the instance, and troubleshoot the issue in an efficient manner. This improves the running efficiency of the instance.
NoteYou can use the upstream analysis feature only in the DAG of an instance. The instance can be an auto triggered instance, a data backfill instance, or a test instance.
You can analyze the ancestor instances only of the auto triggered instances that are not run. A maximum of six levels of instances can be displayed in a DAG. If you want to view more levels of instances, click Continue Analysis in the upper-left corner.
You can use the upstream analysis feature to quickly locate the ancestor instances that are not successfully run and block the running of the current instance. If the ancestor instances are not successfully run, they may be in one of the following states: Running, Failed, Pending (Schedule), Pending (Resources), and Frozen.
The following figure shows how to analyze the ancestor instances of an auto triggered instance. For example, the instance in the figure is not run for a long period of time. In this case, you can click the instance and then click Upstream Analysis in the upper-left corner of the DAG of the instance to analyze the ancestor instances of the instance.
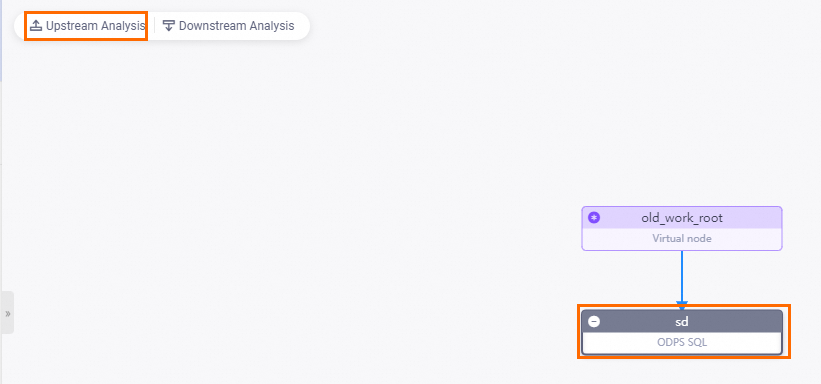 The analysis results show that the ancestor instances that block the running of the instance are the
 old_work_rootinstance. You can quickly locate the two instances and troubleshoot the issue based on the analysis results.NoteAfter you locate the ancestor instances that block the running of the instance, you can perform the following operations:
You can aggregate the ancestor instances of the instance that are displayed in the DAG and view the workspaces to which the ancestor instances belong or the owners of the ancestor instances. This helps improve O&M efficiency.
You can right-click the ancestor instances and select Instance Diagnose to analyze the reasons why the ancestor instances failed to run. For more information, see Intelligent diagnosis.
Analyze descendant instances
When you open the DAG of an instance, only the current instance and its ancestor and descendant instances at the nearest levels are displayed by default. If an auto triggered instance has multiple descendant instances or the descendant instances of an auto triggered instance are distributed at multiple levels, not all the descendant instances that are affected by the current instance are displayed. You can analyze the descendant instances of the auto triggered instance after you aggregate the descendant instances by status, workspace, owner, or priority. Then, you can view the number of instances at each level or the total number of instances at all levels from your desired dimension.
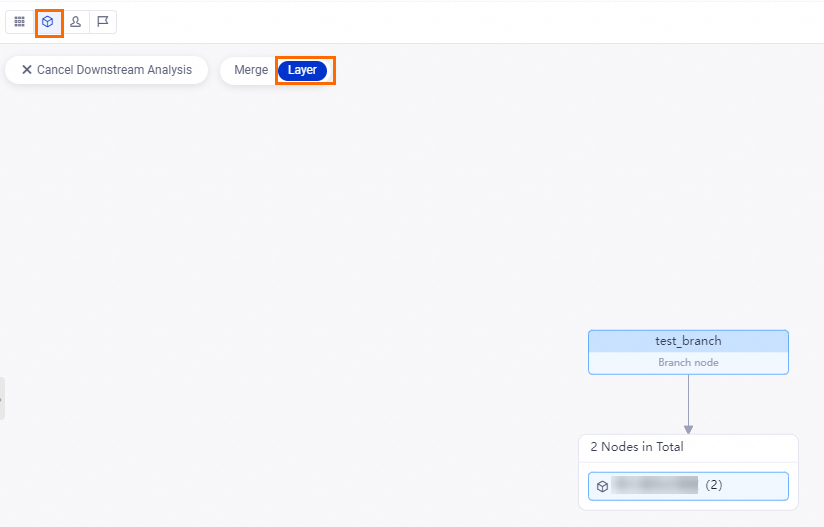
NoteDisplay analysis results by using the merging method or by level with descendant instances aggregated: After you click Downstream Analysis in the DAG of an instance, the system aggregates the descendant instances of the instance by owner by default and displays the total number of instances from the owner dimension by using the merging method or by level.
Display analysis results by group with descendant instances not aggregated: If the descendant instances of an instance are not aggregated and the instance has more than 10 descendant instances, after you click Downstream Analysis in the DAG of the instance, the system displays the downstream analysis results by group by default. This way, you can clearly view the descendant instances that are affected by the instance.
Display analysis results with descendant instances ungrouped: If the descendant instances of an instance are not aggregated but are grouped, you can click the Ungroup icon in the DAG of the instance to ungroup the descendant instances. Then, you can view the dependencies of each instance.
If you analyze the descendant instances of an instance and enable the system to display the analysis results by level, a maximum of six levels of instances can be displayed. If you want to view more levels of descendant instances, click Continue Analysis in the upper-left corner in the DAG of the instance.
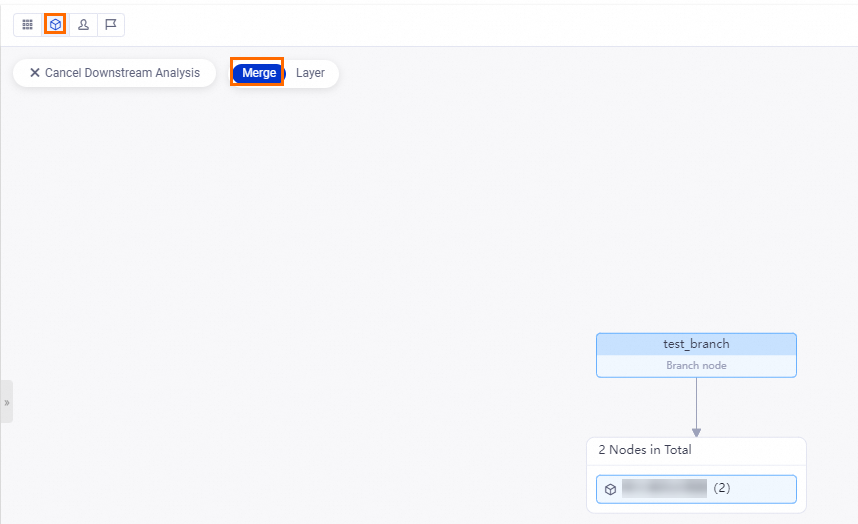
In the following example, the descendant instances of the tag instance are analyzed. The following figures show the analysis results that are displayed by using different methods.
Display analysis results by using the merging method: The system displays the descendant instances of the tag instance by using the merging method from the dimension that you specified. If the descendant instances are not aggregated, the descendant instances are displayed by group. The following figure shows the analysis results that are obtained after the descendant instances of the tag instance are aggregated by workspace and displayed by using the merging method. In the figure, all descendant instances of the tag instance are placed at the same level, and the numbers of the descendant instances that belong to different workspaces are displayed.
Display analysis results by level: The system displays the descendant instances of the tag instance by level from the dimension that you specified. The following figure shows the analysis results that are obtained after the descendant instances of the tag instance are aggregated by workspace and displayed by level. In the figure, the numbers of the descendant instances that belong to different workspaces are displayed at different levels.
Display instances in different patterns by adjusting the display pattern of the DAG
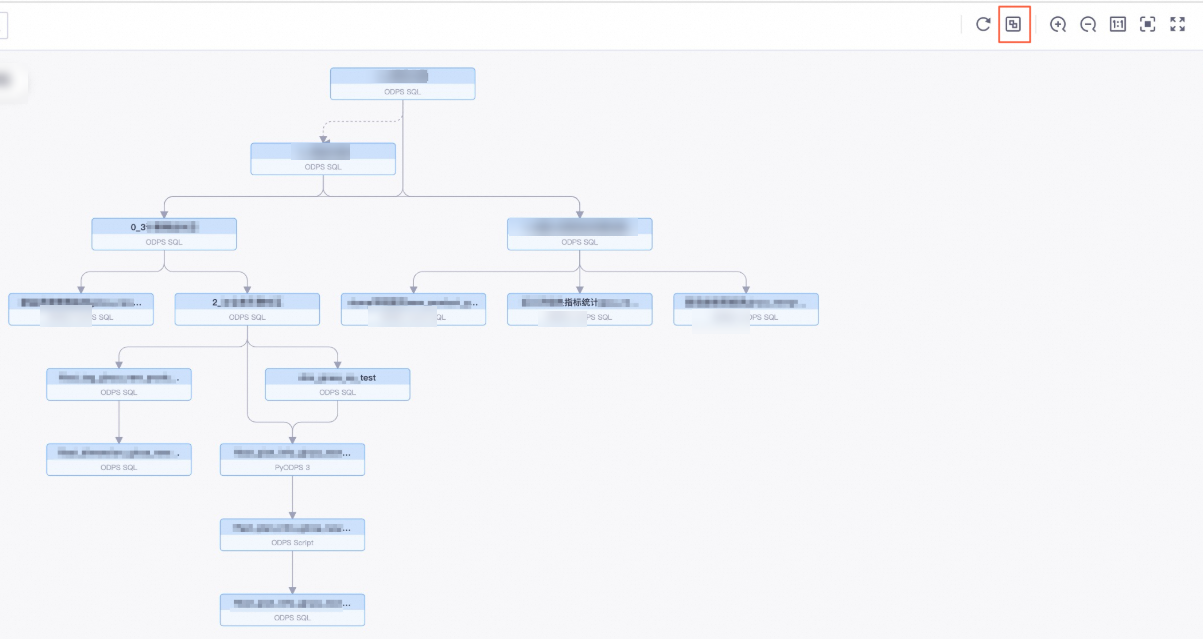
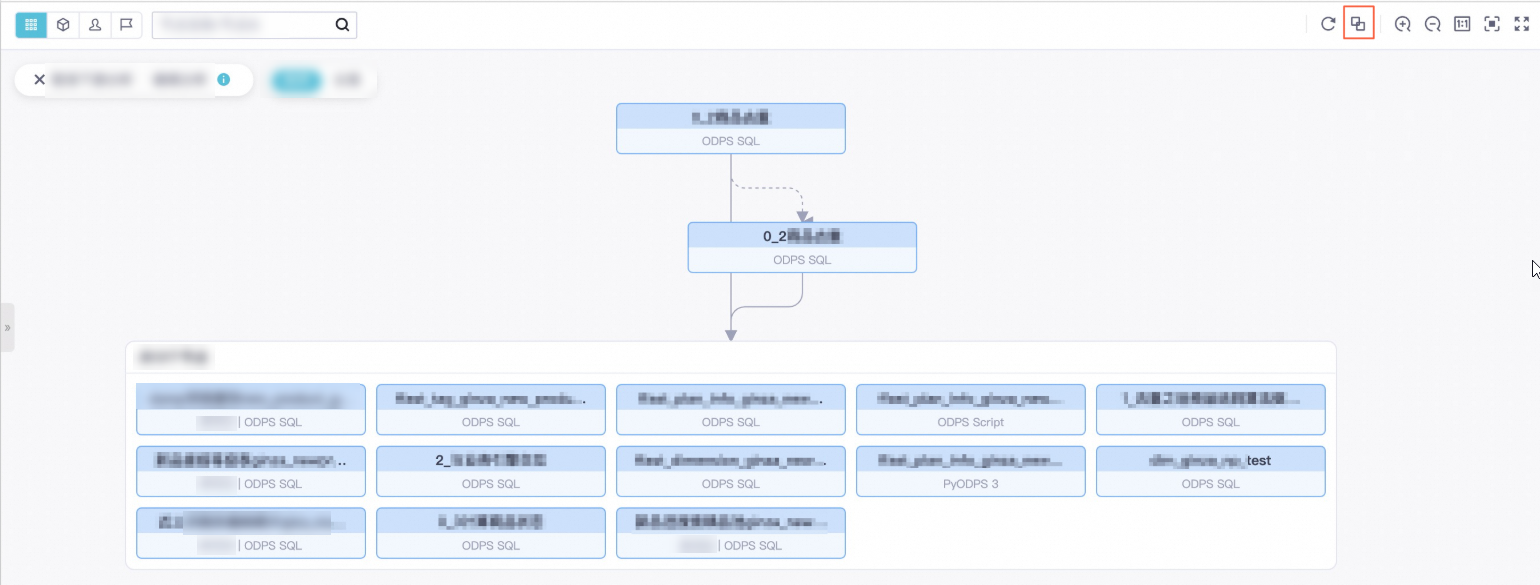
You can click the icons in the upper-right corner of the DAG to adjust the display pattern of the DAG based on your business requirements. For example, you can click the Toggle Full Screen View or Fit Screen icon to perform the operation.
In the following examples, the DAG of the instance is displayed after the descendant instances of the instance are ungrouped or grouped:
The following figure shows the DAG of the instance when the descendant instances of the instance are ungrouped. In this pattern, you can clearly view the dependencies of all the instances.
The following figure shows the DAG of the instance when the descendant instances of the instance are grouped. In this pattern, every five descendant instances of the instance are placed at the same level. This way, the descendant instances are displayed in an orderly manner, and you can quickly obtain the total number of the descendant instances.
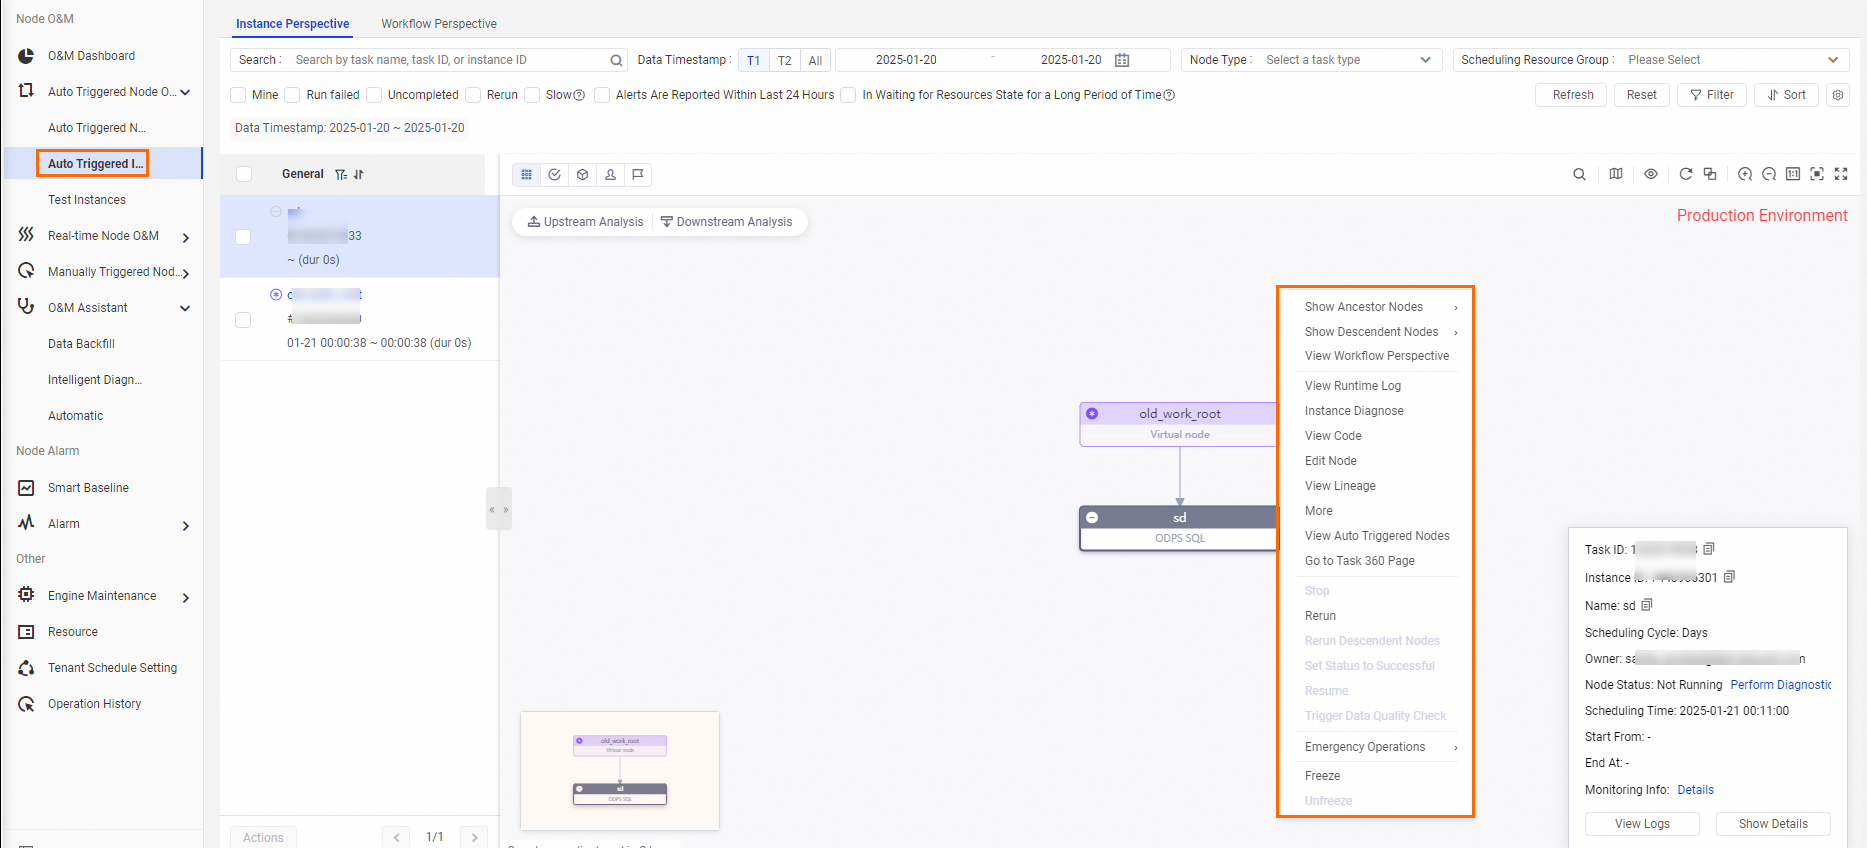
View the dependencies of and perform an operation on an instance in the DAG. The DAG of an instance displays the dependencies of the instance. A solid line represents a same-cycle dependency, and a dashed line represents a cross-cycle dependency. You can right-click an instance in the DAG and perform the desired operations on the instance. The following figure shows the operations that you can perform on an auto triggered instance in a DAG.
Operation
Description
Show Ancestor Nodes or Show Descendant Nodes
View the ancestor or descendant instances of the instance. If a workflow contains three or more instances, specific instances are automatically hidden in DAGs in Operation Center. You can select the number of levels to view specific instances at one or more levels.
View Runtime Log
View the run logs of the instance in a state such as running, successful, or failed.
NoteInstances that run on the shared resource group for scheduling are retained for one month, and logs for the instances are retained for one week.
Instances that run on exclusive resource groups for scheduling are retained for one month, and logs for the instances are also retained for one month.
Instance Diagnose
Track the status of the instance and identify issues. For more information, see Intelligent diagnosis.
View Code
View the code of the instance.
Edit Node
Go to the DataStudio page and modify the current instance.
View Lineage
View the lineage of the instance.
More
View more information about the instance on the General, Context, Runtime Log, Operation Log, and Code tabs.
Stop
Stop the instance. Only instances in the Pending or Running state can be stopped. After the instance is stopped, the instance enters the Failed state.
Rerun
Rerun the instance. After the instance is rerun, its pending descendant instances will be run as scheduled. You can rerun instances that fail to be run or are not run as scheduled.
NoteOnly instances in the Not Running, Succeeded, or Failed state can be rerun.
Rerun Descendent Nodes
Rerun the instance and its descendant instances. You must select the instances that you want to rerun. After they are rerun, their pending descendant instances will be run as scheduled. You can perform this operation to recover data.
NoteOnly instances in the Not Running, Succeeded, or Failed state can be selected. The value No is displayed in the Meet Rerun Condition column for instances in other states, and you cannot select these instances.
Set Status to Successful
Set the state of the instance to Succeeded and run its descendant instances that are not run. You can perform this operation if an instance fails to be run.
NoteOnly the state of a failed instance can be set to Successful. This operation does not apply to workflows.
Resume
Continue running the instance if it fails. You can perform this operation only for instances that are run by using a MaxCompute compute engine instance.
Emergency Operations
Perform emergency operations in emergency scenarios. The operations take effect only once for the current instance.
Select Delete Dependencies to delete the dependencies of the current instance. You can perform this operation to start the current instance if the ancestor instances of the current instance fail and the current instance does not depend on the data of the ancestor instances.
Freeze
Freeze the instance if the instance is in the Running state. If you perform this operation on the instance, the operation takes effect only for the instance. A frozen auto triggered instance cannot be scheduled as expected and does not generate data. After an auto triggered instance is frozen, its descendant instances cannot be scheduled or run as expected.
Sample scenario: If a node is scheduled to run every hour, 24 instances are generated for the node on the current day. If you do not want to run one of the 24 instances, you can freeze the instance. The instance that you freeze does not affect other instances that are scheduled to run.
Unfreeze
Unfreeze the instance if the instance is frozen.
If the instance is not run, it is automatically run after its ancestor instances are successfully run.
If the ancestor instances of the instance are successfully run, the instance enters the Failed state. You must manually rerun the instance.
NoteThe unfreeze operation takes effect only for the current instance. If the node that generates the instance is frozen, instances that are scheduled to run on the next day are also frozen.
Click an instance in the DAG. A dialog box that displays the basic information about the instance appears in the lower-right corner of the DAG. Click Show Details in the dialog box to view the details about the instance. The following figure shows the basic information and details about an auto triggered instance.
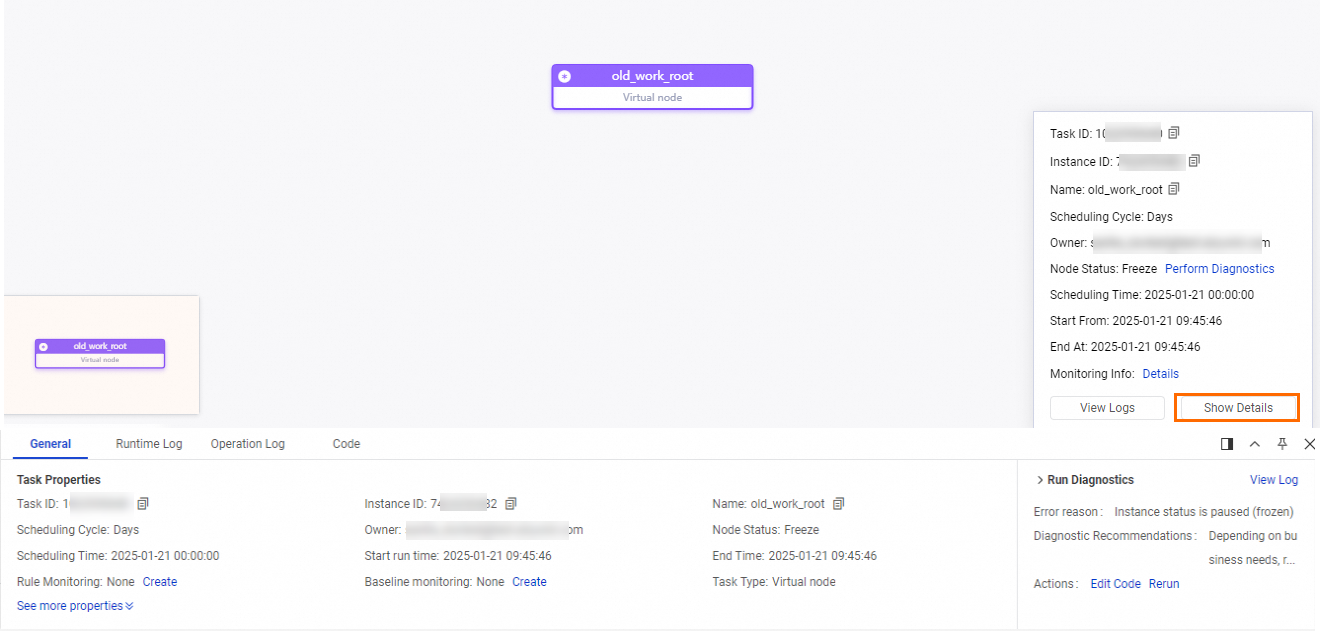
Tab
Description
General
On this tab, you can view the scheduling properties of the node for which the instance is generated in the production environment. For more information about the basic properties, see Configure basic properties.
Relationship between a node ID and an instance ID:
If you want to search for all the instances that are generated on the current day for an auto triggered node scheduled by hour or minute, you can perform the search based on the ID of the node. If you want to search for a specific instance that is generated on the current day for an auto triggered node scheduled by hour or minute, you can perform the search based on the ID of the instance.
Instance status interpretation: If the instance is in the Pending (Ancestor), Pending (Schedule), Pending (Resources), or Freeze state, you can use the intelligent diagnosis feature to quickly troubleshoot issues.
Time spent for waiting for resources: If the instance is in the Pending (Resources) state for a long time, you can use the intelligent diagnosis feature to identify the instances that are competing for resources with the current instance. Then, you can quickly identify the instances on which exceptions occur for troubleshooting.
Long running duration: If the running duration of the instance is much longer than the average running duration over a period of time, you can troubleshoot the issue based on the type of the node that generates the instance:
If the instance is not generated for a data synchronization node, you can consult the owner of the compute engine instance on which the instance is run.
If the instance is generated for a batch synchronization node, the running speed of the instance may be slow in a specific phase or the instance is in the Pending (Resources) state for a long period of time. For more information, see What do I do if a batch synchronization task runs for an extended period of time?.
Alert rule: You can view information about the alert rule associated with the node for which the instance is generated on the General tab. You can click Create to create an alert rule to monitor the status of the node for which the instance is generated. For more information, see Create a custom alert rule.
NoteYou can view only information about the alert rule associated with the node for which the instance is generated on the General tab. Information about monitoring rules used to monitor the data quality of the node for which the instance is generated is not displayed on the General tab.
Baseline: You can view information about the baseline with which the node for which the instance is generated is associated on the General tab. You can click Create on this tab to create a baseline. For more information, see Manage baselines.
Runtime Log
On this tab, you can view the running details about the instance.
Operation Log
On this tab, you can view the operation records of the instance, including the operation time, operator, and specific operations.
Code
On this tab, you can view the latest code of the node for which the instance is generated in the production environment. If the code of the node does not meet your expectations, you must check whether the latest code of the node is successfully deployed to the production environment. For more information, see Deploy nodes.