Answers to common questions about Browser Monitoring in Application Real-Time Monitoring Service (ARMS), covering SDK configuration, performance data, JavaScript errors, and tracing.
Billing
SDK and configuration
What is the difference between console settings and the setConfig method?
| Method | When it takes effect | When to use |
|---|---|---|
| Console settings | After you publish the generated code | During initial ARMS setup for an application |
setConfig method | Immediately | After the application is already being monitored |
Console settings generate configuration code that only takes effect after publishing. Once the application is being monitored, use the setConfig method to modify configurations.

How do I set the environment and version in the SDK?
Use the release parameter to tag versions and the environment parameter to distinguish environments. For details, see SDK reference (release) and SDK reference (environment).
Supported environment values:
| Value | Environment |
|---|---|
prod | Production |
gray | Phased-release |
pre | Staging |
daily | Daily |
local | Local |
How do I check which version is deployed?
Log on to the ARMS console.
In the left-side navigation pane, choose Browser Monitoring > Browser Monitoring. Click the name of your application.
Choose Application > View Details.
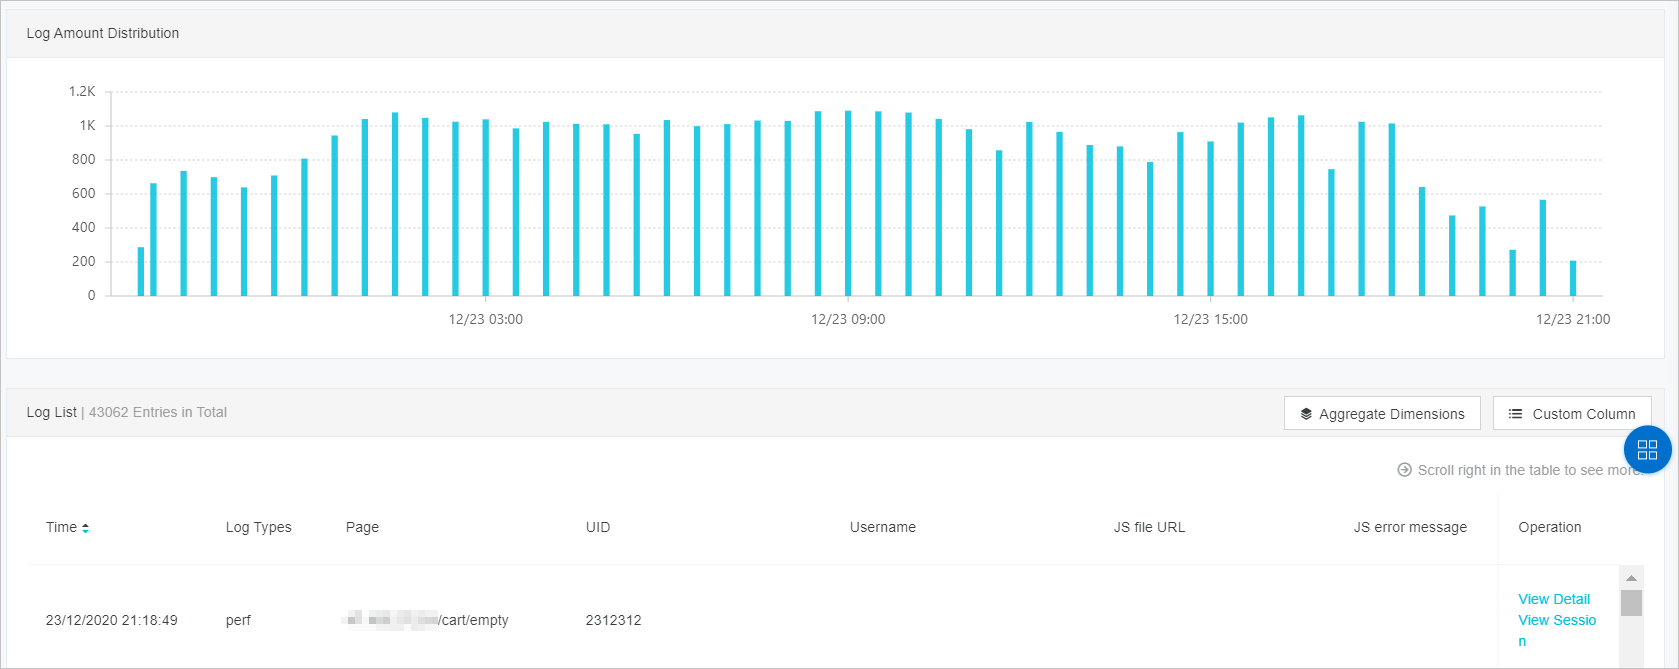
The Version column in the Log List section shows the version number for each log entry.

You can also filter logs by environment and version in the menu bar. Filtering requires that PV logs already have a version number set.

ARMS configuration does not take effect
This is typically caused by browser caching. To troubleshoot:
In the ARMS console, navigate to Application > View Details.
Switch to the latest version and check the trend chart.
If no version number appears, set the
releaseparameter in the ARMS SDK. For details, see SDK reference.After setting
release, confirm that the specified value appears as the latest version.
Not sure whether the SDK has loaded when calling \_\_bl.performance()
See Page data reporting of SPAs for a pattern that handles this safely.
Version numbers in the application edition and host edition
| Edition | Version source | How to set |
|---|---|---|
| Application edition | Your current online project version | Set the release parameter. See SDK reference. |
| Host edition | The app hosting your project (auto-detected by SDK) | Automatic. Only Taobao, Alipay, and WeChat versions can be resolved. Other hosted app versions cannot be resolved. |
Page views and performance
Why is the PV list different from the page speed list?
This happens in single-page applications (SPAs) with SPA auto-resolution enabled. PVs and page speed are measured differently:
| Metric | Measurement method | Result |
|---|---|---|
| PVs | Each hashchange event triggers a PV report | PV list shows page views broken down by hash value |
| Page speed | Recorded only on full page loads | Speed does not change when the hash value changes, avoiding redundant reports |
Why do PV counts differ between modules in the ARMS console?
| Module | PV calculation |
|---|---|
| Page Speed page | Performance log entries multiplied by the sampling rate |
| Page page (under Dimensions) | Direct PV log count |
Performance logs are reported once per full page load. In SPA mode, PV logs are reported on every route change, so PV log counts exceed performance log counts.
How do I view time on page (TP) for a specific user?
Log on to the ARMS console.
In the left-side navigation pane, choose Browser Monitoring > Browser Monitoring. Click the name of your application.
Choose Application > Session Traces.
In the Session List section, click a session ID in the Session ID column.
On the Session Tracking Details page, hover over the timeline area in the Visit Timeline column to view the time on page (TP).
How do I view custom performance metrics?
Log on to the ARMS console.
In the left-side navigation pane, choose Browser Monitoring > Browser Monitoring. Click the name of your application.
Choose Application > Page Speed.
Custom performance metrics appear in the Page Speed section.
Why is duration smaller than connect download for some resources?
This is a cross-domain resource timing issue. ARMS reads performance data from the performance.getEntriesByType('resource') API. The domain of a third-party ARMS resource must match the domain of the site requesting the resource. For cross-domain resources, browsers return 0 for the following timing properties due to the same-origin policy:
redirectStart, redirectEnd, domainLookupStart, domainLookupEnd, connectStart, connectEnd, secureConnectionStart, requestStart, responseStart
Since connect download equals responseEnd - responseStart, a zero responseStart inflates the result beyond the actual duration.
| Scenario | Resolution |
|---|---|
| Self-managed CDN resources | Add the Timing-Allow-Origin response header to allow the browser to access detailed timing data |
| Third-party resources | Use the duration value as the primary reference, since it remains accurate for cross-domain resources |
URL convergence
Why do some monitored URLs or APIs contain asterisks (*)?
The asterisks are not part of the actual URLs. They indicate URL convergence -- ARMS groups similar URLs by replacing variable segments (IDs, query parameters, etc.) with *.

ARMS uses a proprietary URL convergence algorithm to group similar URLs and reduce the total number of URLs while preserving semantic information. URL convergence works in two steps:
Aggregation: Group URLs with similar structures.
Variable identification: Replace variable segments with asterisks.

To disable URL convergence, configure the urlHelper option in the SDK.
Tracing and API diagnostics
Missing trace IDs in API logs
First, check whether Associate with Application Monitoring is enabled:
Log on to the ARMS console.
In the left-side navigation pane, choose Browser Monitoring > Browser Monitoring. Click the name of your application.
Choose Settings > Application Settings.
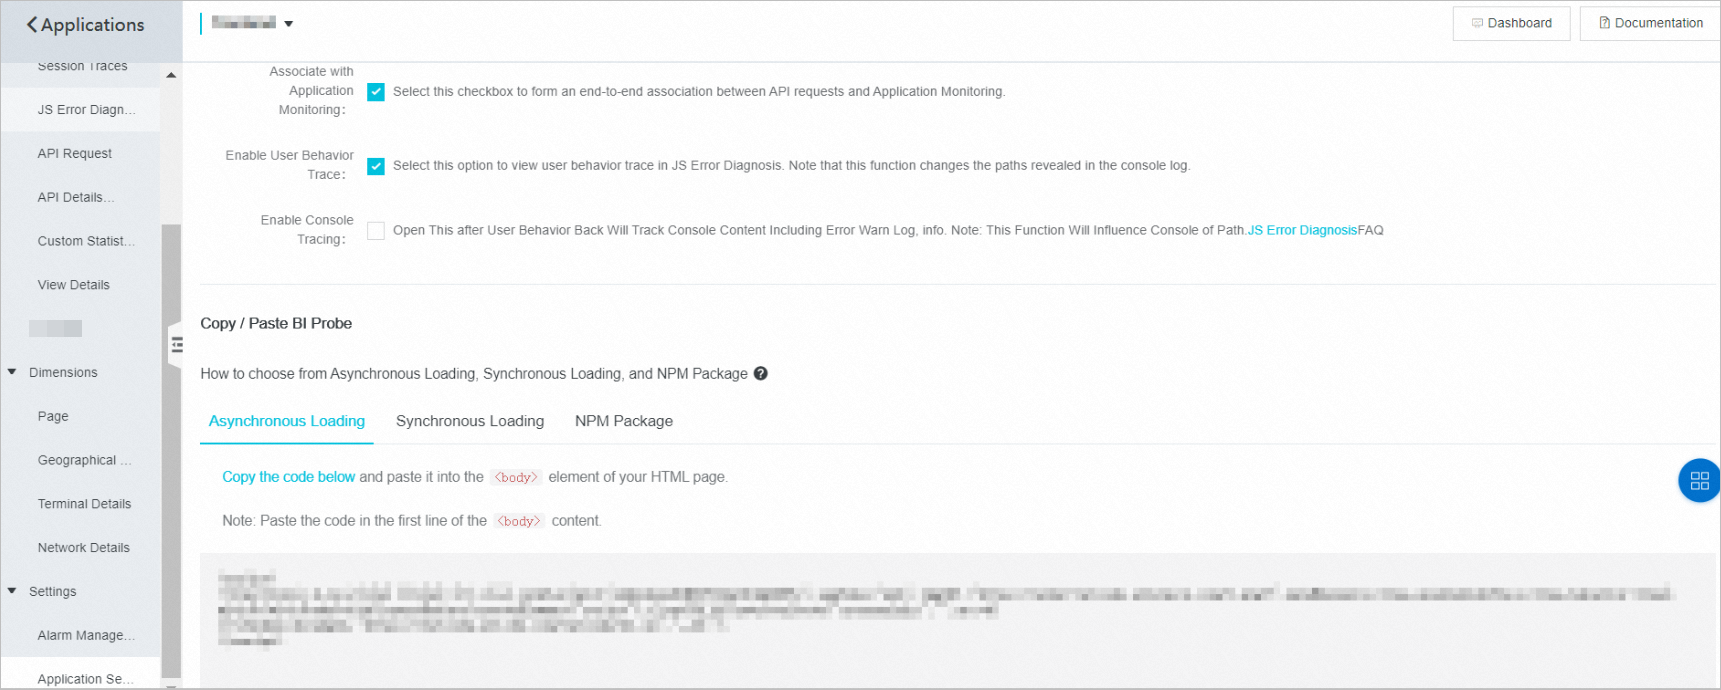
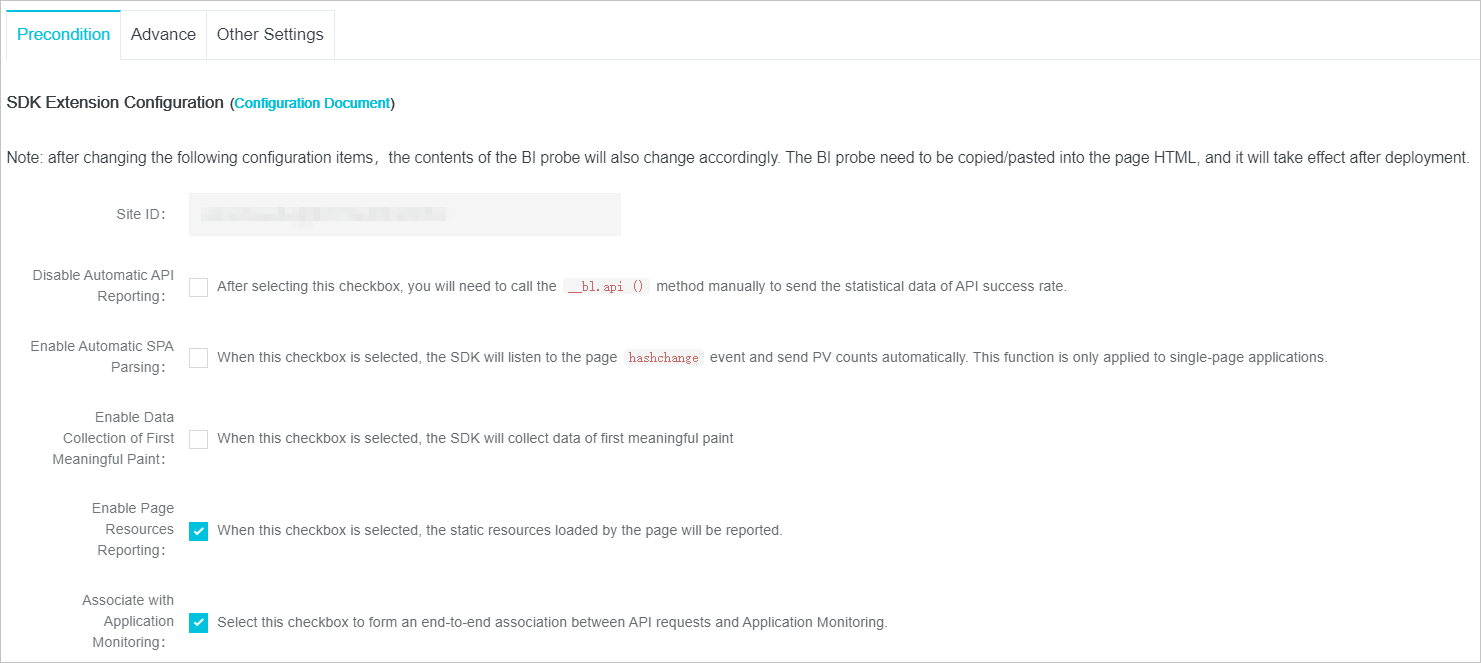
On the Precondition tab, check whether Associate with Application Monitoring is selected. If not, select it and reconnect the ARMS agent to your frontend application.

If trace IDs still do not appear, check whether the page request domain matches the API request domain. A domain mismatch indicates a cross-domain request. ARMS skips trace ID generation for cross-domain requests to prevent API failures caused by cross-domain authentication.
For full resolution steps, see Use the front-to-back tracing feature to diagnose API errors.
JavaScript errors
Source map file error during JS error troubleshooting
| Possible cause | Resolution |
|---|---|
| Incorrect file extension | Confirm the file has a .js.map extension |
| Insufficient permissions | Confirm your account has write permissions to ARMS. If not, contact your administrator |
Script errors
JS errors in mini programs are not reported
The underlying framework of mini programs uses try-catch in asynchronous operations, which captures errors before ARMS can detect them. Report errors manually instead. For details, see API reference.
Does ARMS capture JS errors from console.error?
| Platform | Behavior |
|---|---|
| Web browsers | Yes. ARMS automatically captures console.error calls that match the JS error format. |
| Mini programs | No. Report errors manually. See API reference. |
Mini programs
UID set for a mini program in Weex does not take effect
| Scenario | Resolution |
|---|---|
setConfig not called | Check whether you specified a UID during initialization. If not, add one. |
setConfig already called | Specify a different UID and call the method again. |
Data retention and editions
Log retention period
| Edition | Retention period |
|---|---|
| ARMS Basic Edition | Up to 7 days |
| ARMS Pro Edition | Up to 30 days |
Can I keep trial-period sites after activating ARMS Pro Edition?
No. Within 15 days after the trial expires, sites are suspended for overdue payments. Restart the application to restore access.
If Pro Edition is not activated within 15 days, the sites are permanently deleted and all resources are released. Data cannot be recovered.