In browser monitoring, you do not know the performance of the network transmission or the trace and performance of backend services even if you know the API response time. Therefore, you cannot immediately troubleshoot API errors in applications. The front-to-back tracing feature can resolve this issue. This feature connects the frontend and backend traces of an API request to reproduce the code execution process.
Prerequisites
The browser monitoring and application monitoring features of Application Real-Time Monitoring Service (ARMS) are enabled. For more information, see Activate ARMS. The version of application monitoring is 2.4.5 or later. For more information, see What is Application Monitoring?.
Background information
The application monitoring feature provides the backend processing performance and traces of API requests. However, the data does not reflect real user experience. The browser monitoring feature can monitor the overall response time and statuses of API requests, but cannot provide the traces or performance of backend services. In this case, the front-to-back tracing feature connects the frontend and backend to provide you with a one-stop troubleshooting experience.
Configure ARMS browser monitoring
Same-domain API request to the application
Check whether the frontend browser is connected to the backend application.
Deselect the Disable Automatic API Reporting option to enable the automatic API reporting feature.
Set the enableLinkTrace parameter to
trueto enable the front-to-back tracing feature. The following sample code provides an example on how to enable the front-to-back tracing feature:<script> !(function(c,b,d,a){c[a]||(c[a]={});c[a].config={pid:"xxx",imgUrl:"https://arms-retcode.aliyuncs.com/r.png?", enableLinkTrace: true}; with(b)with(body)with(insertBefore(createElement("script"),firstChild))setAttribute("crossorigin","",src=d) })(window,document,"https://retcode.alicdn.com/retcode/bl.js","__bl"); </script>
Cross-domain API request to the application
Check whether the frontend browser is connected to the backend application.
Set the enableLinkTrace and enableApiCors parameters to
true.<script> !(function(c,b,d,a){c[a]||(c[a]={});c[a].config={pid:"xxx",imgUrl:"https://arms-retcode.aliyuncs.com/r.png?", enableLinkTrace: true, enableApiCors: true}; with(b)with(body)with(insertBefore(createElement("script"),firstChild))setAttribute("crossorigin","",src=d) })(window,document,"https://retcode.alicdn.com/retcode/bl.js","__bl"); </script>ImportantIf you set the enableApiCors parameter to
true, the backend service must also support cross-origin requests and custom header values. Make sure that all requests can be called in combinations as expected. Otherwise, the requests may fail. The following sample code provides an example on how to configure NGINX:upstream test { server 192.168.220.123:9099; server 192.168.220.123:58080; } server { listen 5800; server_name 192.168.220.123; root /usr/share/nginx/html; include /etc/nginx/default.d/*.conf; location / { proxy_pass http://test; proxy_set_header Host $host:$server_port; proxy_set_header X-Real-IP $remote_addr; proxy_set_header X-Real-PORT $remote_port; proxy_set_header X-Forwarded-For $proxy_add_x_forwarded_for; proxy_set_header EagleEye-TraceID $eagleeye_traceid; proxy_set_header EagleEye-SessionID $eagleEye_sessionid; proxy_set_header EagleEye-pAppName $eagleeye_pappname; }Configure the Ignore method. For more information, see ignore. The following sample code provides an example on how to configure the Ignore method:
let whitelist = ['api.xxx','source3']; // Configure the whitelist. let blacklist = ['source2','source6']; // Configure the blacklist. // You can configure a blacklist and a whitelist based on your business requirements. You can specify return true or return false to determine whether to enable the whitelist and the blacklist. ignore: { ignoreApis: [ function(str) { // Configure the Ignore method. if (whitelist.includes(str)) { return false; } return true; // If true is returned, ignore the API request. }] }NoteThe Ignore method is similar to blacklists and whitelists. This method prohibits header modifications on unauthorized third-party resource requests to prevent errors in the resource requests.
Principle
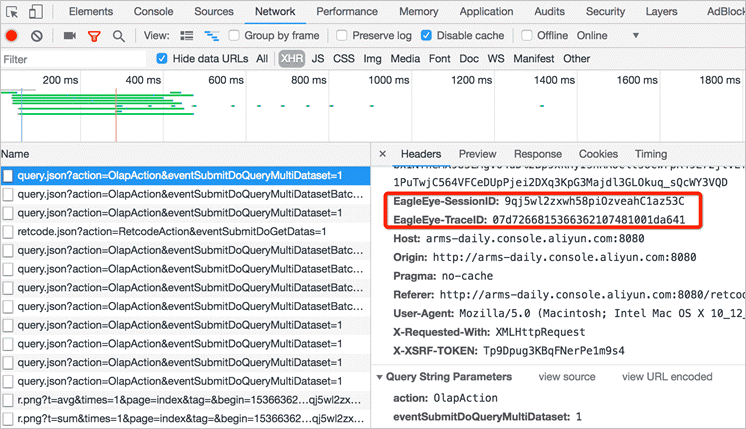
If automatic API reporting is enabled and the API and the domain name of the application have the same origin, the EagleEye-TraceID and EagleEye-SessionID custom headers are added to the API request headers. EagleEye-TraceID is the identifier of the trace that connects the frontend and backend.
If the API and the domain name of the application do not have the same origin, no custom headers are added to the API request headers. This ensures that the application can send requests as expected.
To check whether the front-to-back tracing configurations have taken effect, go to the ARMS console and view the API request headers. If the EagleEye-TraceID and EagleEye-SessionID headers are included in the API request headers, the configurations have taken effect.
WarningThe values of the EagleEye-TraceID and EagleEye-SessionID headers are automatically generated. We recommend that you do not manually set the values.

Scenarios and cases
If a request takes a longer time than expected, you can determine whether the cause is network transmission or backend call process based on the call timeline. You can also click the method stack of the backend application to view the complete backend trace of the request. In this case, you can identify the cause of an API error based on the business.
Perform the following operations to identify the error cause if the API returns an error code or a business logic error occurs:
Log on to the ARMS console. In the left-side navigation pane, choose .
On the Browser Monitoring page, select a region in the top navigation bar and click the name of the application that you want to manage.
In the left-side navigation pane, choose Application > API Request.
On the API Failure List tab of the API Link Trace(TOP20) section, find the relevant API or trace ID, and click Link Trace. You can then view the overall response time of browser monitoring and the call sequence chart of the backend application.

Determine whether the network transmission or backend call process takes a longer time based on the call timeline.
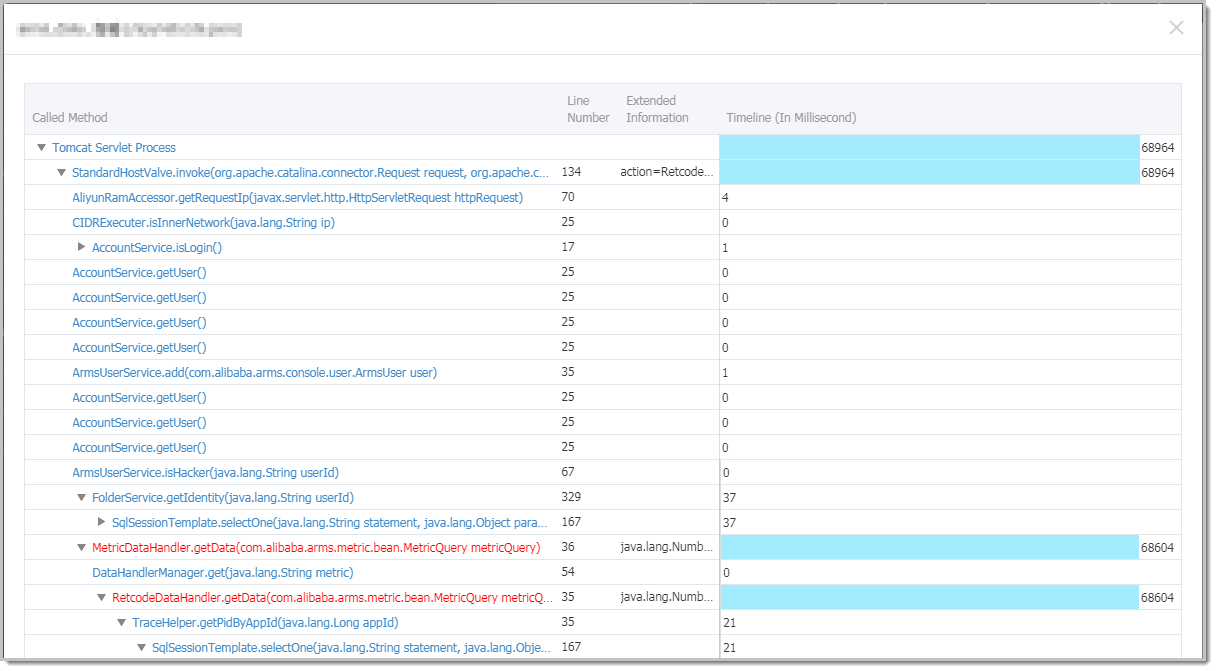
Click the Magnifier icon in the Method Stack column of the backend application to view the overall backend trace of the request. You can then identify the cause of the API error based on the business.

Perform the following operations to identify the error cause if the response time of the API is longer than expected:
Log on to the ARMS console. In the left-side navigation pane, choose .
On the Browser Monitoring page, select a region in the top navigation bar and click the name of the application that you want to manage.
In the left-side navigation pane, choose Application > API Request.
In the API Link Trace(TOP20) section, the APIs are sorted in descending order by response time. Find the API or trace ID whose response time is longer than expected.
Click Link Trace. Then, view the overall response time of browser monitoring and the call sequence chart of the backend application.
If the processing time of the backend application is short but the overall response time is long, the time consumed from API request sending to the server to data returning to the frontend is long. In this case, click View Details. On the details page, view the network, region, browser, device, and operating system of the access request.
If the backend application takes a long time to process the access request, the backend processing performance is poor. In this case, click the magnifier icon in the Method Stack column. In the Method Stack dialog box, check which part of backend tracing is time-consuming to locate the issue.