By Sajid Qureshi, Alibaba Cloud Tech Share Author. Tech Share is Alibaba Cloud's incentive program to encourage the sharing of technical knowledge and best practices within the cloud community.
Prometheus is a free and open source system monitoring tool that stores all its data in a time series database. You can easily fine-tune the definition of your metrics and generate more accurate reports as well because it offers a powerful query language and multidimensional data. It helps you graphing the resulting data on dashboards.
Grafana is a leading graph and dashboard builder visualizing time series infrastructure and application metrics. It allows you to create alerts, notifications, and ad-hoc filters for your data.
In this tutorial, we will learn how to set up and monitor system using Prometheus and Grafana. In this first half of the tutorial, we will be looking at installing the Prometheus and Grafana using Docker. In the second half of the tutorial, we will be adding Prometheus to Grafana data source, importing the Prometheus stats dashboard and analyzing the data.
In this guide, we will be installing Prometheus server using Docker on an Alibaba Cloud Elastic Compute Service (ECS) Ubuntu server.
We recommend you to install any new packages on a freshly updated server. So, let's upgrade all the available packages using the following command.
sudo apt-get updateAs we know, we will be installing Prometheus using Docker, let's install Docker first if you haven't already. Here we will install Docker by downloading their installation script, it is the quickest way to install Docker.
wget -qO- https://get.docker.com/ | shThe above command downloads and executes a small installation script written by the Docker team.
Next, you will need to add the user to docker group for working with docker. Execute the following command to do so.
sudo usermod -aG docker $(whoami)Login again your server to activate your new groups.
You have successfully installed Docker on your server. Now, let's install Docker Compose. Before installing Docker Compose you'll have to install 'python-pip' as it is required to install Docker Compose.
sudo apt-get -y install python-pipNow, you can install Docker Compose using the following command.
sudo pip install docker-composeIn this section, we will be installing the Prometheus server using Docker. The Prometheus server is responsible for collecting and storing metrics as well as processing expression queries and generating alerts. There are so many patterns available for organizing the storage of metrics. Here, we will use the Docker image's default behavior of using a Docker data volume to store the metrics.
First of all, create a Prometheus configuration file using any text editor.
nano ~/prometheus.ymlAdd the following contents to the file.
# A scrape configuration scraping a Node Exporter and the Prometheus server
# itself.
scrape_configs:
  # Scrape Prometheus itself every 5 seconds.
  - job_name: 'prometheus'
    scrape_interval: 5s
    target_groups:
      - targets: ['localhost:9090']

  # Scrape the Node Exporter every 5 seconds.
  - job_name: 'node'
    scrape_interval: 5s
    target_groups:
      - targets: ['YourServerIP:9100']
Replace YourServerIP with your actual server IP address.
Next, start the Prometheus Docker container with the external configuration file using the following command.
docker run -d -p 9090:9090 -v ~/prometheus.yml:/etc/prometheus/prometheus.yml prom/prometheus -config.file=/etc/prometheus/prometheus.yml -storage.local.path=/prometheus -storage.local.memory-chunks=10000The above command will pull the docker image from the Docker Hub. You can list all running Docker container using the following command.
docker psYou can inspect the logs of the running Prometheus server using the container ID, execute the following command to do so.
docker logs container_id(Note - You will need to replace container_id with your actual Container ID)
Find out where on the host's filesystem the metrics storage volume is stored using the following command.
docker inspect container_idYou should see the following output:
...
"Mounts": [
    {
        "Source": "/home/sammy/prometheus.yml",
        "Destination": "/etc/prometheus/prometheus.yml",
        "Mode": "",
        "RW": true
    },
    {
        "Name": "111b0abc850a9c758ee35ed5cff69077423a629566082a605a01d8207d57cd6c",
        "Source": "/var/lib/docker/volumes/111b0abc850a9c758ee35ed5cff69077423a629566082a605a01d8207d57cd6c/_data",
        "Destination": "/prometheus",
        "Driver": "local",
        "Mode": "",
        "RW": true
    }
],
...
Now you can access your Prometheus server at http://YourServerIP:9090/ and you can check it is collecting metrics about itself by visiting http://YourServerIP:9090/status.
You will have to install Prometheus Node Exporter because It will expose Prometheus metrics about the host machine it is running on. We recommend you to run the Node Exporter directly on the host system outside of Docker because If we run it on Docker without further options it will only export metrics about the container's environment, which will be different from the host's environment.
Execute the following command to start the Node Exporter on port 9100 using Docker.
docker run -d -p 9100:9100 -v "/proc:/host/proc" -v "/sys:/host/sys" -v "/:/rootfs" --net="host" prom/node-exporter -collector.procfs /host/proc -collector.sysfs /host/proc -collector.filesystem.ignored-mount-points "^/(sys|proc|dev|host|etc)($|/)The Prometheus server will now automatically start scraping the Node Exporter. Please visit your Prometheus server's status page at http://YourServerIP:9090/status and verify that the http://YourServerIP:9100/metrics target for the node job is now showing a HEALTHY state.
Grafana transforms multiple feeds from Prometheus into metrics in a centralized dashboard. You will need to install Grafana here for using both Prometheus and Grafana for system monitoring.
Execute the following command to launch Grafana as a Docker container. Please replace the YourPassword with your actual admin password.
docker run -d -p 3000:3000 -e "GF_SECURITY_ADMIN_PASSWORD=YourPassword" -v ~/grafana_db:/var/lib/grafana grafana/grafanaThe above command will download the Grafana Docker image from the Docker Hub and automatically create a new Docker volume at '~/grafana_db' on the host system and at '/var/lib/grafana' in the container filesystem. Grafana will automatically create its SQLite 3 database.
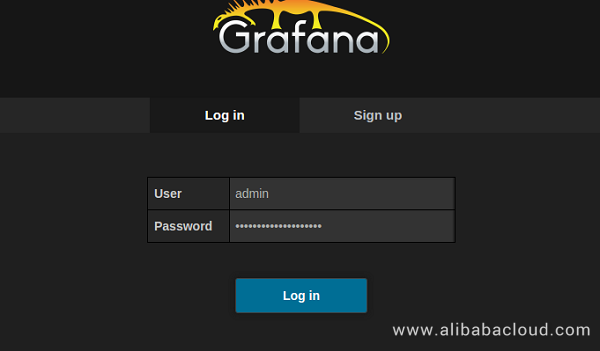
You have successfully installed Grafana on your server. We recommend you to verify this installation by visiting http://YourServerIP:3000/. You should see the Login/SignUp webpage of Grafana like this:

You will need to login to Grafana using admin as username and password that you chose when downloading the Grafana, click on Login button.
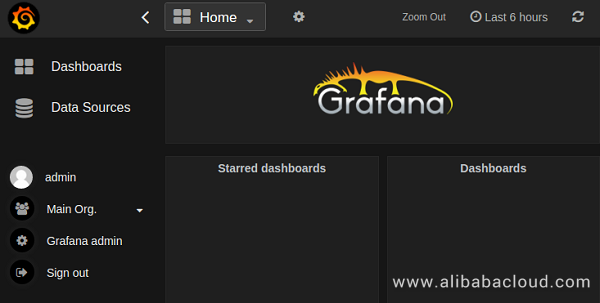
After logging in, you should see Grafana's main view.

We will now add Prometheus to Grafana data source, importing the Prometheus stats dashboard and analyzing the data.
Let's configure Grafana to access Prometheus server as the data source for creating graphs. If in case you have more than one Prometheus server running then you will need to configure this for every Prometheus server because each Prometheus server is a separate data source.
Open up your web browser and visit http://YourServerIP:3000/ and login to your account.
Once you logged in, click on the Grafana icon in the top left corner to show the main menu. Select Data Sources to navigate to the data source list page. Click Add New in the top navigation bar. You should see the following:
Create a new data source using the following values.
Name: PrometheusType: PrometheusURL: http://:9090, (default port is 9090)Access: proxyBasic Auth: According to Your ServerFinally, click on Add button to add your data source, and then click Test Connection to verify everything is working properly.
You have successfully added the data sources and checked that everything is working properly. Now, you will have to download and import the statics dashboard. You can download and import this dashboard from here.
To import a dashboard from a local JSON file, click the Choose file button in the Import File section. Find the downloaded prometheus-dash.json on your local file system, and import it.
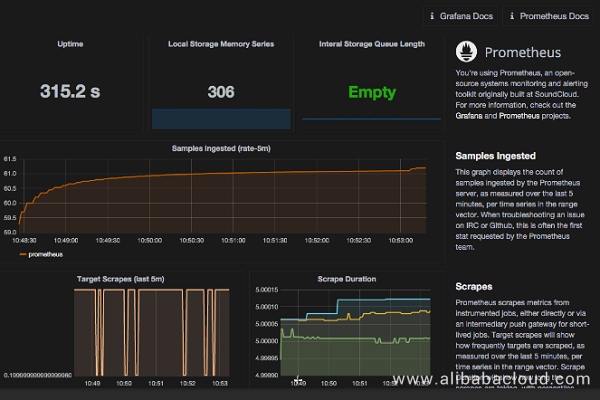
Once you will import the dashboard, you will immediately be taken to the Prometheus Stats Dashboard and you will see statistics from your Prometheus server.

Remember, you don't forget to save your dashboard otherwise it will not appear once you close your browser.
All the panels are explained below individually so that one can easily learn to view the Prometheus stats dashboard.
You have successfully installed and configured Prometheus server and Grafana to monitor your system. you have seen the graphs created by Grafana above. It is important to analyze the data and check usage of the data.
Since your Prometheus server is just newly created so the graphs will appear pretty flat and small. By the time, these graphs will vary greatly depending on your particular use case and workloads. Ideally, you should want these graphs to remain in a stable state. If targets start exporting more metrics, the number of ingested samples and target scrapes per second will increase
If your target scrapes drop unexpectedly, you will have to determine the cause and make the graph stable.
When the node on which the Prometheus server runs is simply not sufficient to handle the load then Slow rule evaluation will indicate you that.
Prometheus has an Alert Management component called AlertManager which gives you the alert via Email and other notification clients. You will need to define your alert rules in file "alert.rules", so that Prometheus server can read the alert rules and can fire alerts at appropriate times.
For example, If the Prometheus server find the value of a metric is different from the threshold range that you have defined in the "alert.rules" file for more than 30 seconds, it will trigger the Alert Manager to fire an alert.
In this guide, you have installed Docker on your ECS Ubuntu server. You have also installed Prometheus and Grafana using Docker and have successfully analyzed the data graphs.
Create Your Own Software Development Platform using Phabricator on CentOS 7

2,593 posts | 792 followers
FollowAlibaba Clouder - April 22, 2019
Alibaba Container Service - February 13, 2019
Alibaba Cloud Native Community - September 28, 2021
Alibaba Cloud Native - November 6, 2024
Alibaba Cloud Native Community - December 11, 2023
Xi Ning Wang - August 21, 2018

2,593 posts | 792 followers
Follow CloudMonitor
Automate performance monitoring of all your web resources and applications in real-time
Learn More ROS(Resource Orchestration Service)
Simplify the Operations and Management (O&M) of your computing resources
Learn More ECS(Elastic Compute Service)
Elastic and secure virtual cloud servers to cater all your cloud hosting needs.
Learn MoreMore Posts by Alibaba Clouder