KubeSkoop exporter provides a standard Prometheus format metric output service. You can quickly integrate KubeSkoop exporter's monitoring information into an existing monitoring system.
If there is no ready-to-use monitoring service, please refer to the following installation guide to set up a visual monitoring service.
Refer to Prometheus Installation to complete the deployment and installation of Prometheus.
Refer to Grafana Installation to complete the deployment and installation of Grafana.
KubeSkoop exporter supports the service discovering of Prometheus running in Kubernetes. After installing Prometheus, you can view the ready instances by entering skoop-exporter in the search bar on the Status->Targets page, for example:
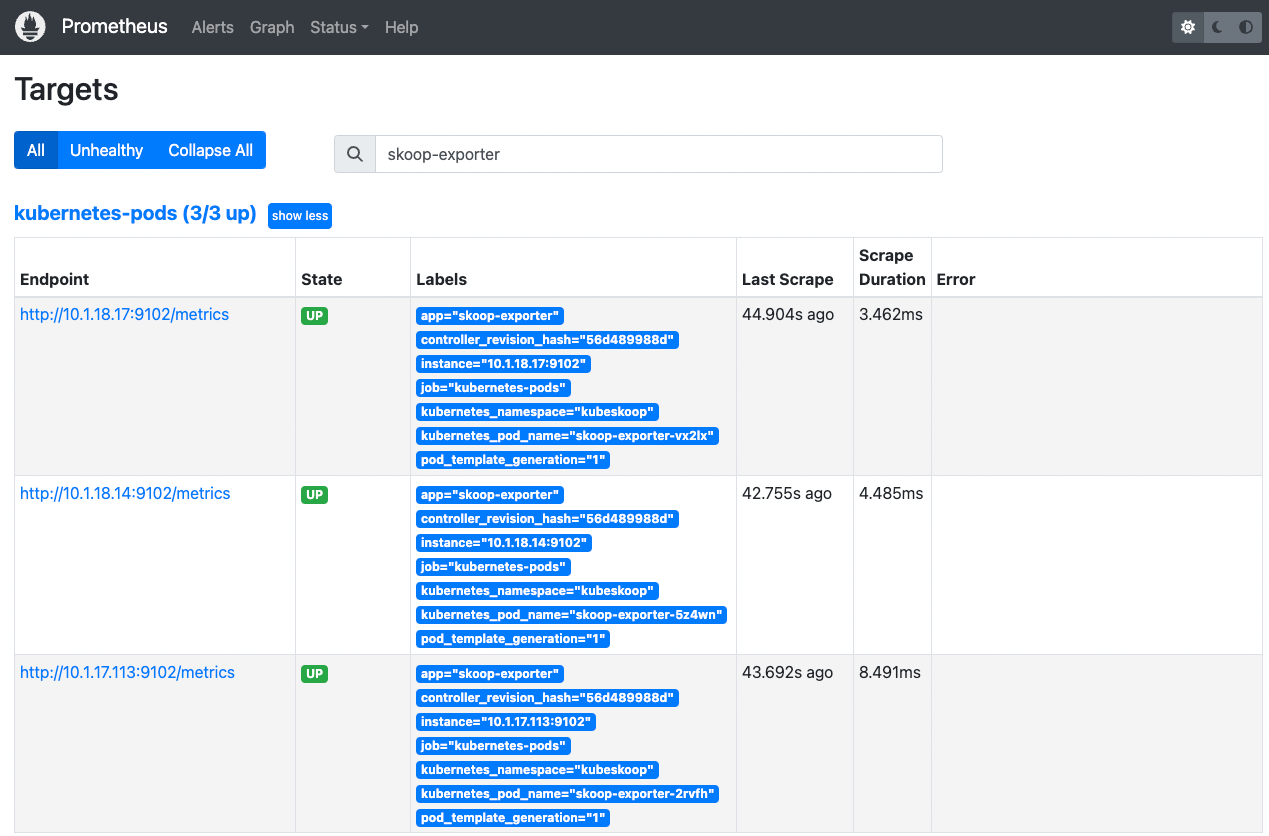
After the KubeSkoop exporter instance is successfully scraped by Prometheus, you can complete the visualization of metrics through the following steps:
1. Enter the Grafana console, click Configuration->Data sources->Add data source, select Prometheus, and add the address of the prepared Prometheus instance to the data source subscription of Grafana
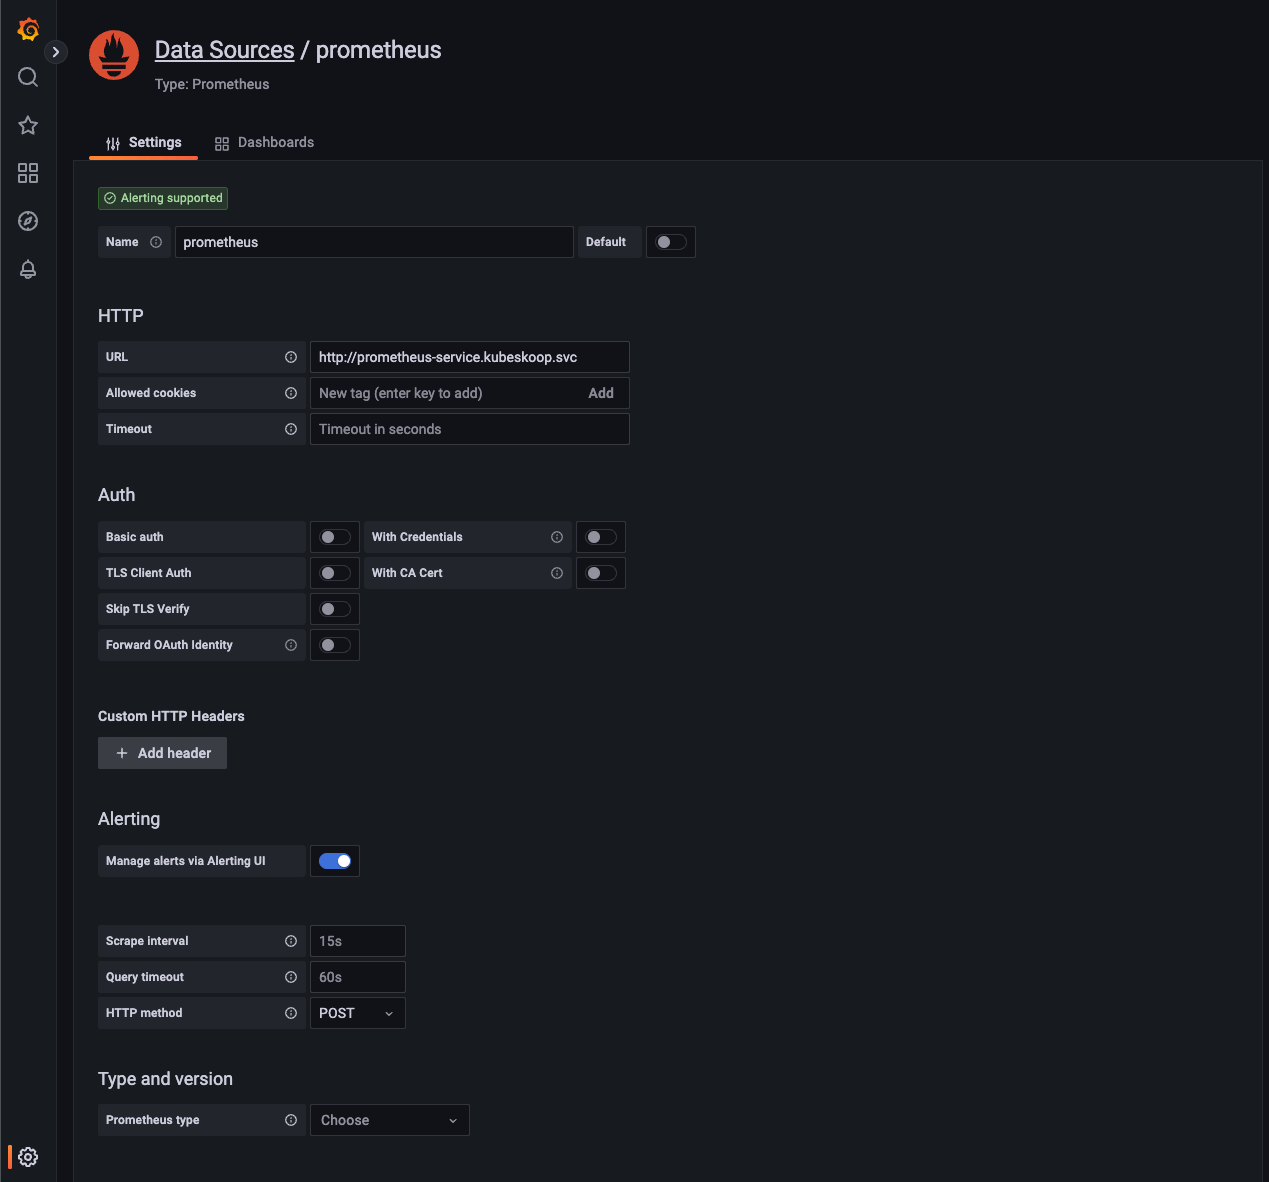
2. Create a new dashboard or select to create a new panel in an existing dashboard. In the panel configuration, select the data source configured in 1, enter inspector in the Metric browser, and you can see the associated KubeSkoop exporter metrics. Select the desired information from it, for example, inspector_pod_netdevrxbytes. After inputting this, you can see the obtained data in the panel.
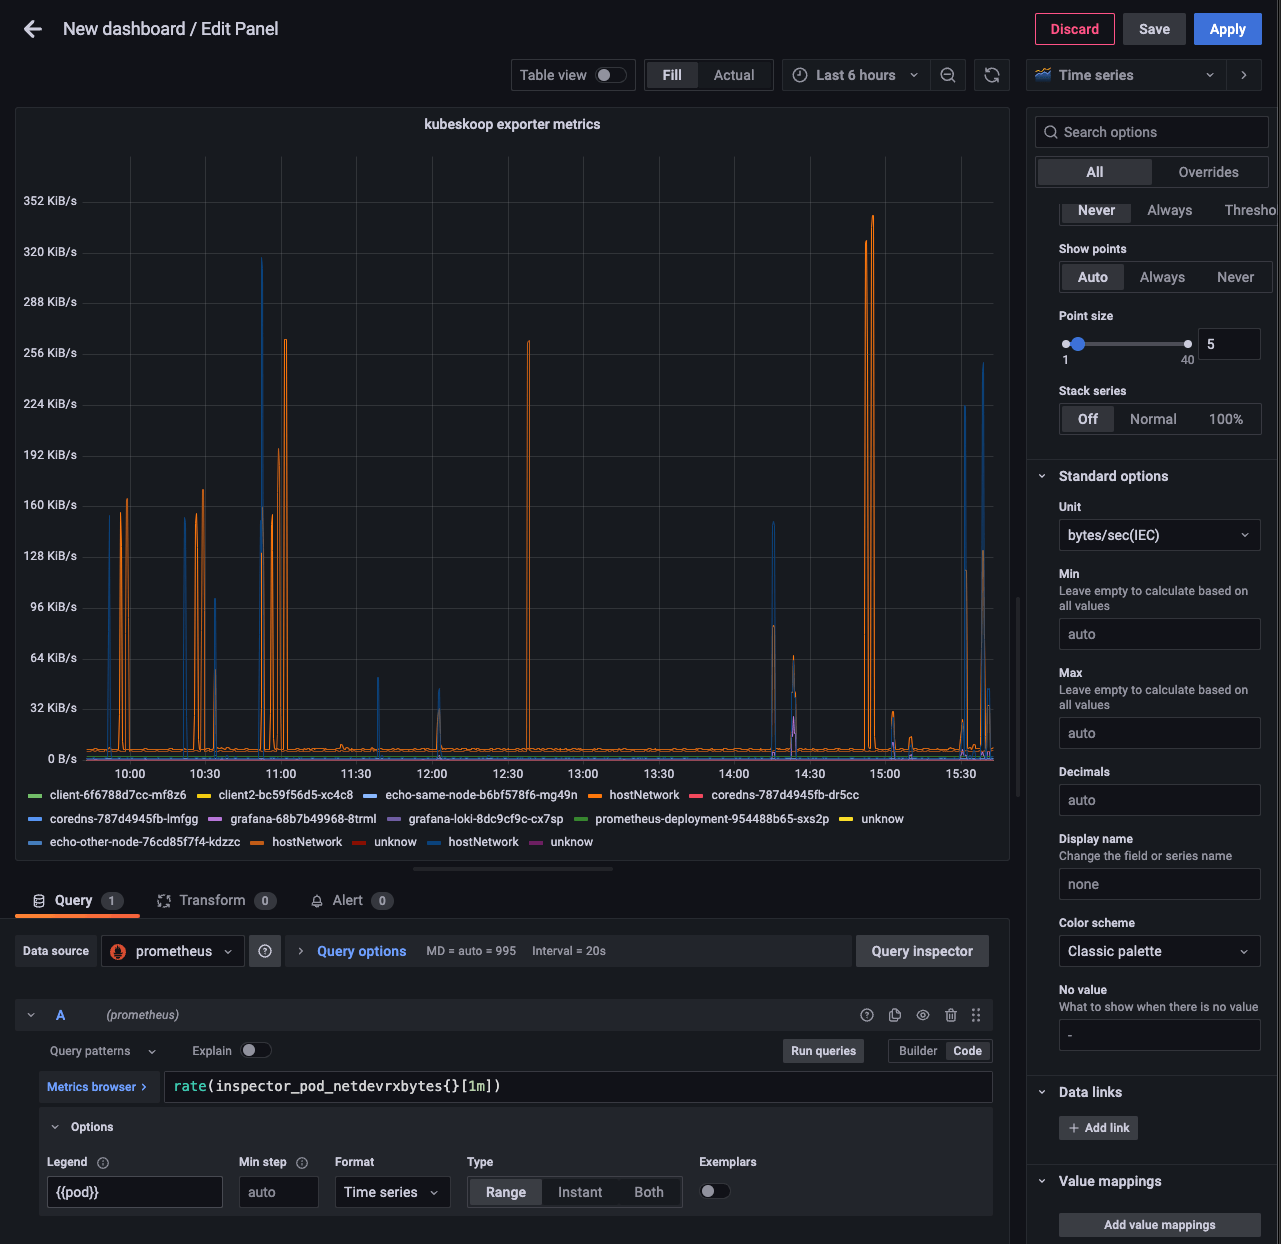
3. In the visualization of metrics, you can set the legend and unit information of the metrics as needed. The legend supports configuring information such as the Pod's namespace, IP, and label. These supported legends can be configured in the panel's Legend.
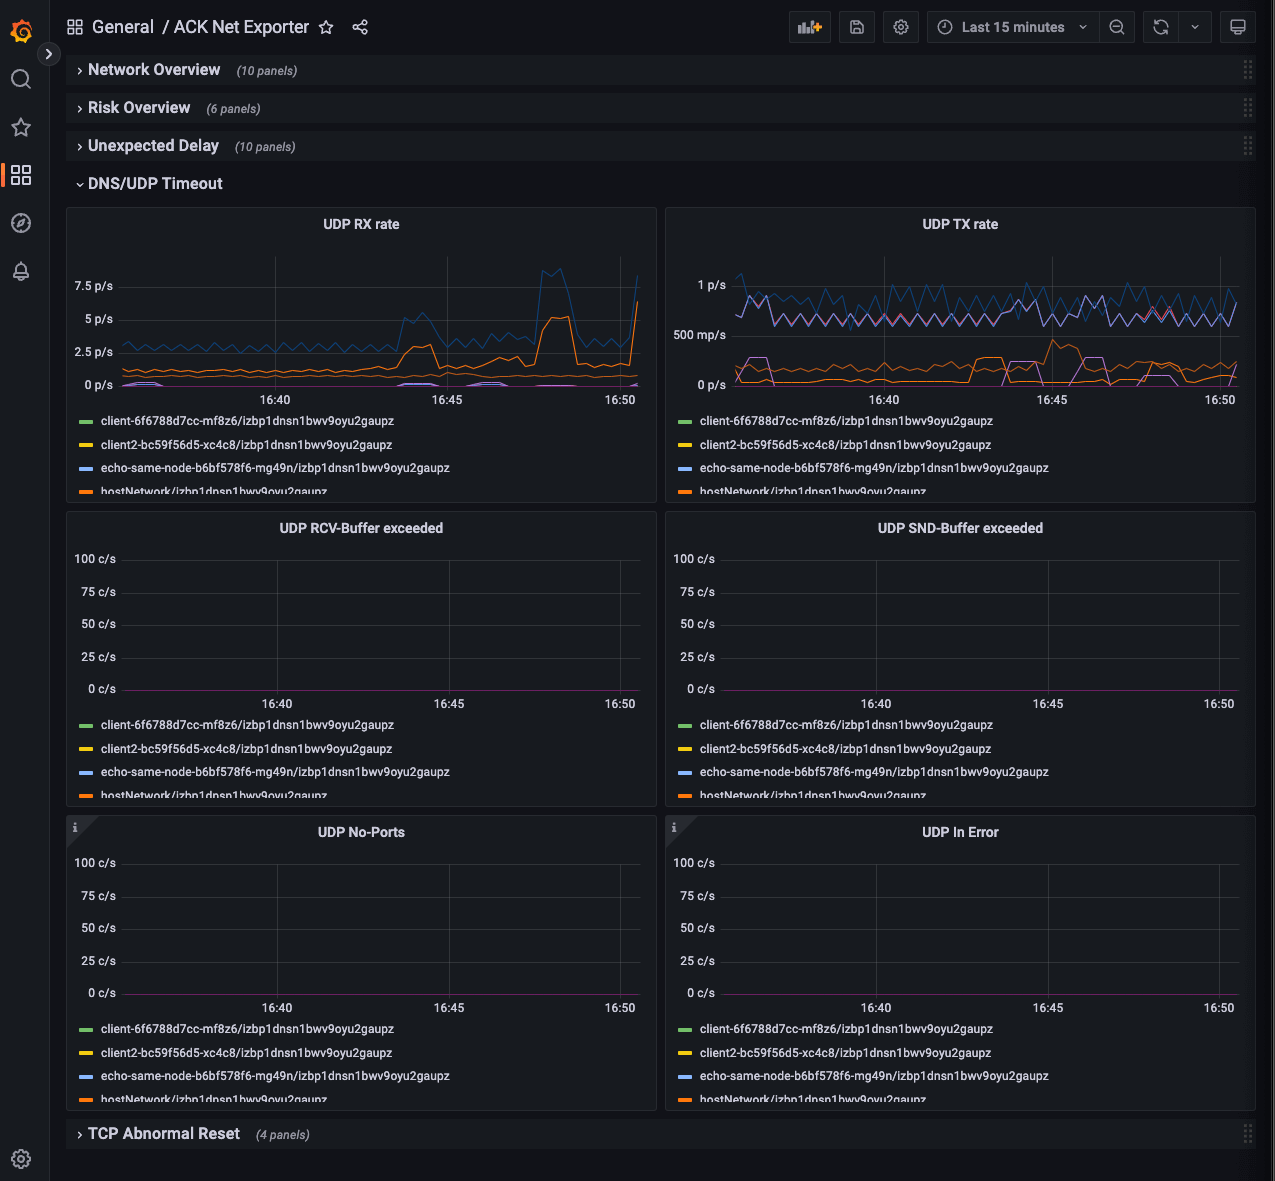
KubeSkoop exporter provides a default Grafana dashboard configuration file that can follow version updates:
curl https://raw.githubusercontent.com/alibaba/kubeskoop/main/deploy/resource/kubeskoop-exporter-dashboard.json -o dashboard.jsonAfter logging in to the Grafana console, click Dashboards->Import->Upload JSON file, select the saved file for upload, select Take Prometheus as data source, and click Import to import it. You can then view the default dashboard. By selecting different panel groups, you can view monitoring metrics of different categories.
Follow the official documentation to install Grafana Loki for different scenarios Grafana Loki Installation
After installation, you can check the availability of Grafana Loki using the following methods:
curl http://[Instance address of Grafana Loki]:3100/readyYou can use Grafana to visualize the KubeSkoop exporter pushed to Grafana Loki events. Follow these steps to achieve visualization:
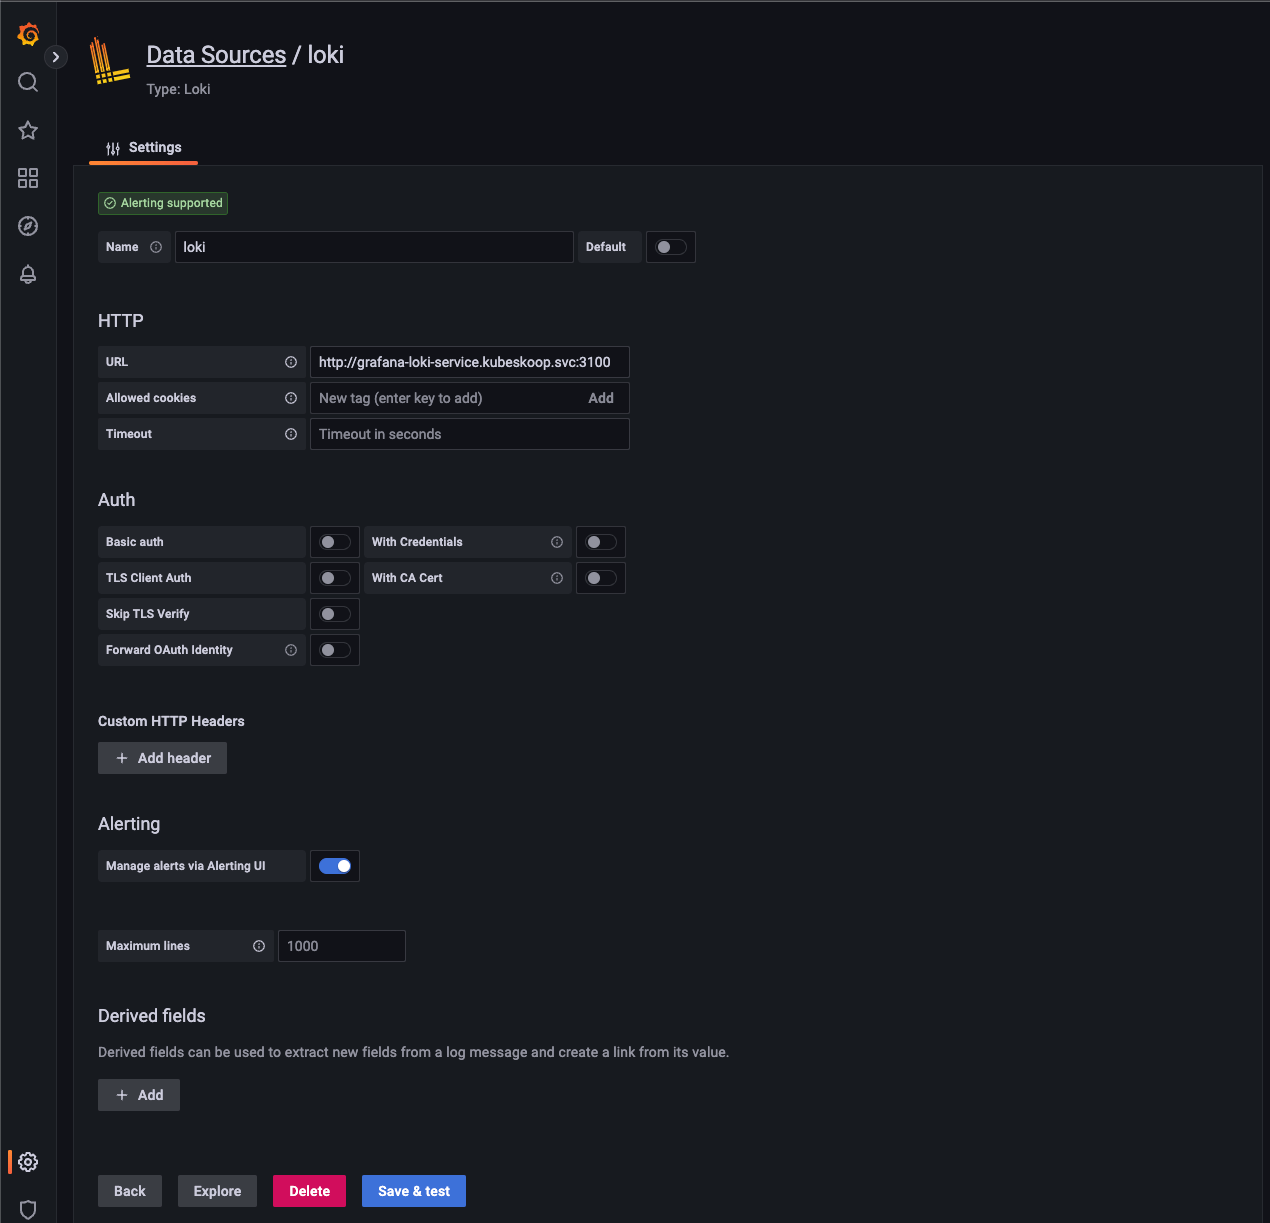
1. After clicking Configuration->Data sources->Add data source, select Loki, and add the address of the Grafana Loki service to the data source subscription of Grafana. This can be an IP address or domain name with a default port of 3100.
2. Create a new dashboard or select a new panel in an existing dashboard. In the panel configuration, select the data source configured in step 1 as the data source, and filter the required event information in the Label browser.
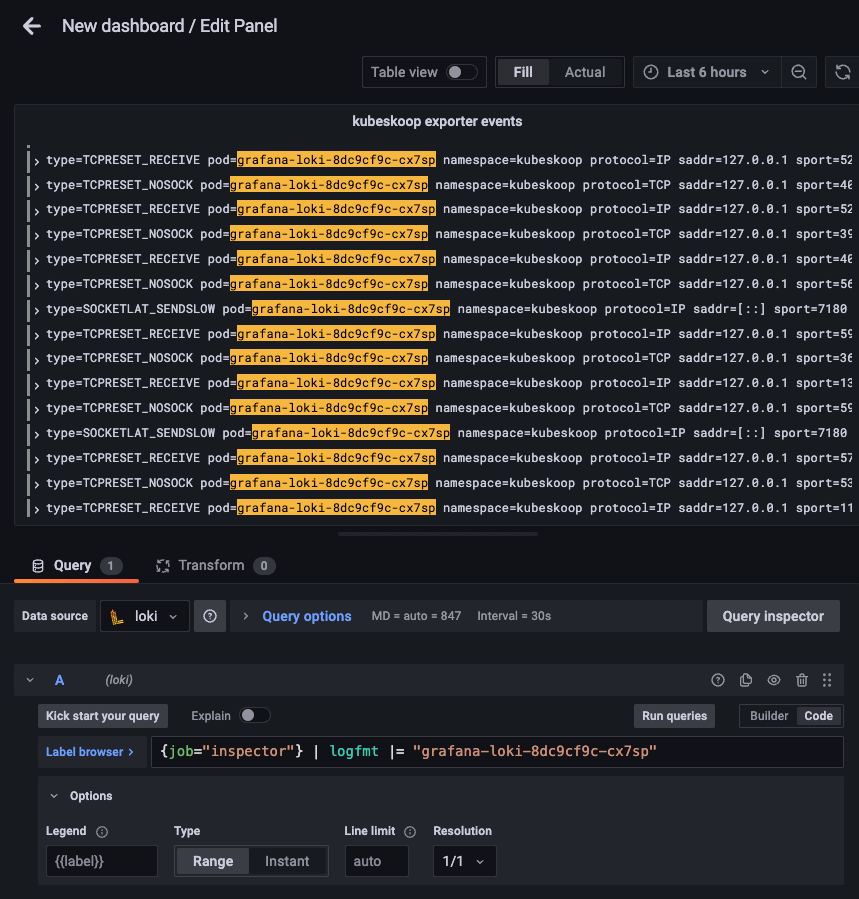
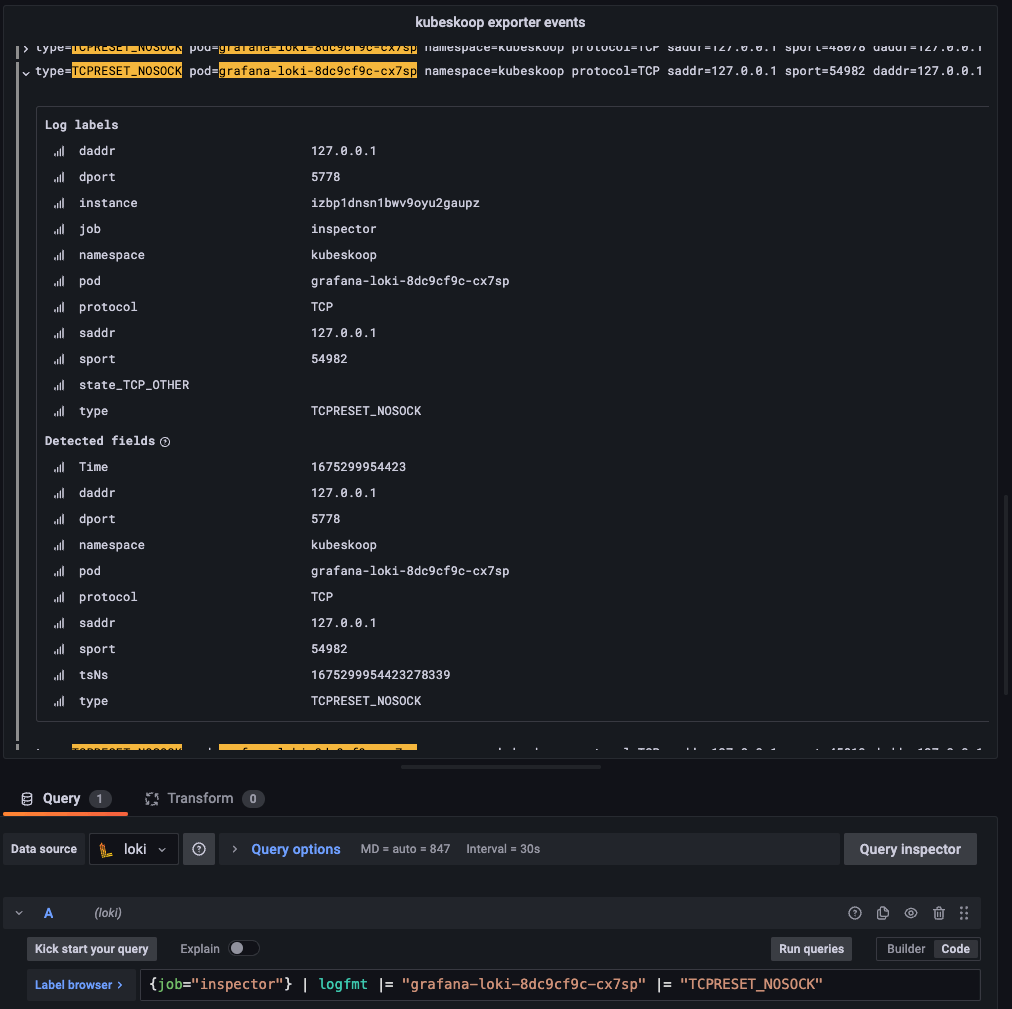
3. In the event panel, you can query specific events through LogQL. After clicking on the event, you can view detailed on-site information.
Analysis of the Implementation of Layer 4 Load Balancing in Istio Ambient Mesh

664 posts | 55 followers
FollowAlibaba Cloud Native Community - December 13, 2023
Alibaba Cloud Native Community - December 11, 2023
Alibaba Cloud Native Community - December 11, 2023
Alibaba Container Service - November 15, 2024
Alibaba Cloud Native Community - December 6, 2022
Alibaba Clouder - April 12, 2021

664 posts | 55 followers
Follow ACK One
Provides a control plane to allow users to manage Kubernetes clusters that run based on different infrastructure resources
Learn More Managed Service for Grafana
Managed Service for Grafana displays a large amount of data in real time to provide an overview of business and O&M monitoring.
Learn More Managed Service for Prometheus
Multi-source metrics are aggregated to monitor the status of your business and services in real time.
Learn More Container Service for Kubernetes
Alibaba Cloud Container Service for Kubernetes is a fully managed cloud container management service that supports native Kubernetes and integrates with other Alibaba Cloud products.
Learn MoreMore Posts by Alibaba Cloud Native Community