In this tutorial, we will explore ways to monitor the activity of a service running on an Alibaba Cloud ECS server. The tools for the job include Prometheus, Alertmanager and Blackbox Exporter. Follow this link to access the latest Prometheus client download. Developers and system managers use Prometheus to log system measurements, control resources, and archive the information in a time-series database. For alerting recipients, it uses an Alertmanager, which may replicate or group separate or identical alert forms. The boss has the benefit of being compatible with communications systems like email.
While Prometheus is a useful tool all by itself, it becomes even handier when integrated with an exporter. Your infrastructure can be separated into various components including web and database servers, messaging systems or APIs. An exporter such as Blackbox Exporter can have alerts configured for all these individual parts. Blackbox Exporter uses several techniques to run request metrics including HTTP, HTTPS, DNS, TCP, and ICMP. For each request, there are detailed data points such as the success of requests and response times. We shall use both tools to see how well a NGINX server running on Alibaba Cloud responds to our requests. We will also create email alerts if the server fails a response test.
To complete the setup guide in this tutorial, you should have the following:
We will all of these set up in this tutorial. Note that it is also possible to configure Alertmanager to send notifications to Slack.
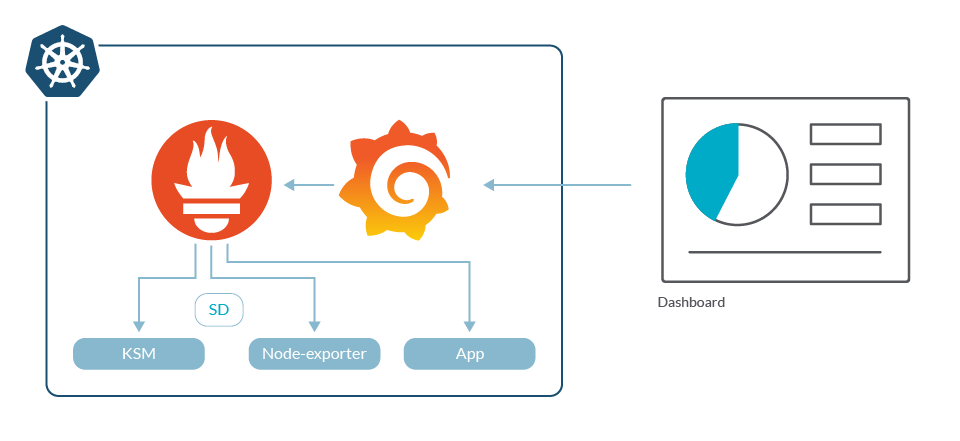
Alibaba Cloud Log Service (SLS) strives to develop itself into a DevOps data mid-end that provides rich capabilities including host data access, storage, analysis, and visualization. This article describes how SLS supports the Prometheus solution to provide a cloud-native Prometheus engine that features high performance, high availability, and zero O&M.
Cloud-native technologies have been booming and flourishing across the world in recent years, and Cloud Native Computing Foundation (CNCF), one of the most influential projects in the IT field, is the strong support behind cloud-native technologies. As a non-profit organization under Linux Foundation, CNCF manages a dozen projects related to cloud-native technologies, among which the best known is Kubernetes, the de-facto standard in the container orchestration field.
Prometheus is the second CNCF graduated project, and has become the most popular one apart from Kubernetes. It is no exaggeration to say that Prometheus has become a de-facto standard of cloud-native monitoring. If the first step of enabling cloud native is to build a Kubernetes environment, then Prometheus is the first step to implement cloud-native monitoring.

After you deploy apps in Kubernetes, you will find it necessary to check the running statuses of the cluster and the apps. However, some of the monitoring methods in the virtual machine (VM) environment are no longer applicable. Although there are several alternatives to Prometheus, it is the best choice for many applications due to these advantages:
Alibaba Cloud Log Service (SLS) strives to develop itself into a DevOps data mid-end that provides rich capabilities such as host data access, storage, analysis, and visualization. It provides an all-in-one platform where you can easily handle data-related tasks in DevOps scenarios and quickly build your enterprise's observable platform.

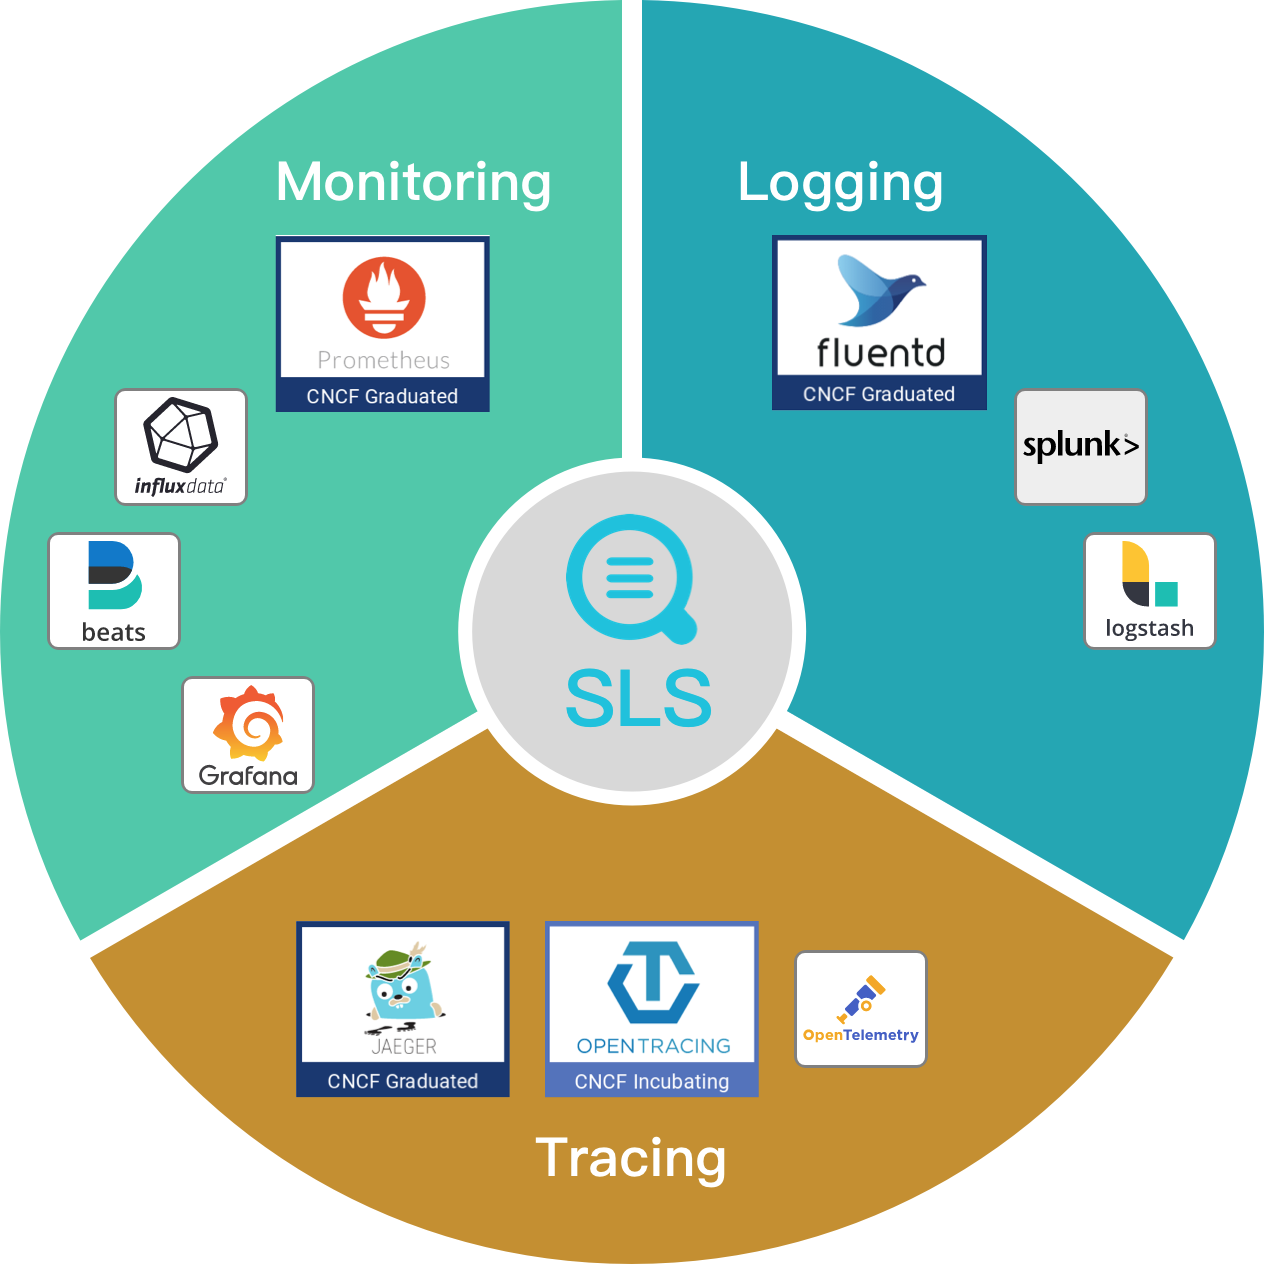
SLS provides a wide range of data access methods and supports many data access approaches related to cloud-native observability. The preceding figure shows the projects that are supported by SLS for data access in the CNCF landscape. The monitoring, logging, and tracing features all support CNCF graduated projects, such as Prometheus, Fluentd, and Jaeger. The main reasons for using SLS to store Prometheus monitoring data include:
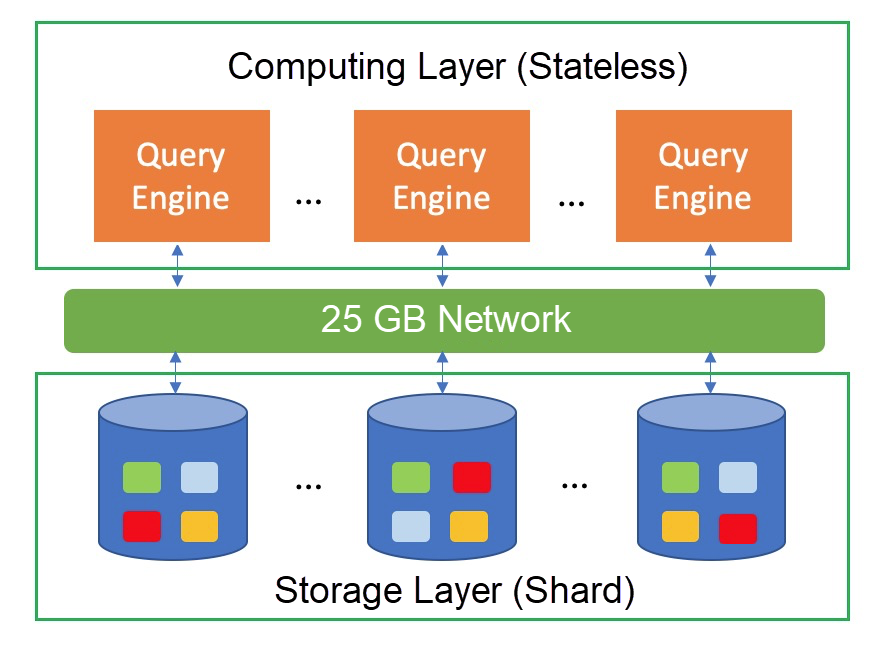
The SLS MetricStore provides native support for PromQL. All data is distributed to multiple hosts for distributed storage as shards. The computing layer integrates a Prometheus QueryEngine module to separate storage and computing, so that massive data processing can be carried out easily.

Compared with the community-provided Prometheus distributed extensions, such as Cortex, Thanos, M3DB, FiloDB, and VictoriaMetrics, the SLS's distributed implementation solution is closer to the community's goal of solving the restrictions on the use of native Prometheus.
In addition to supporting these requirements of the community, SLS can provide the following advantages for Prometheus:
Alibaba Cloud Elastic Compute Service (ECS) provides fast memory and the latest Intel CPUs to help you to power your cloud applications and achieve faster results with low latency.
Log Service is a complete real-time data logging service that has been developed by Alibaba Group. Log Service supports collection, consumption, shipping, search, and analysis of logs, and improves the capacity of processing and analyzing large amounts of logs.
Log Service (SLS) is a one-stop logging service developed by Alibaba Cloud that is widely used by Alibaba Group in big data scenarios. You can use Log Service to collect, query, and consume log data without the need to invest in in-house data collection and processing systems. This enables you to focus on your business, improving business efficiency and helping your business to expand.
This topic describes the features of Log Service.
Alibaba Cloud Red Hat OpenShift Container Platform 4.6 Deployment Guide

2,593 posts | 793 followers
FollowNeel_Shah - July 2, 2025
Alibaba Developer - April 7, 2020
DavidZhang - June 14, 2022
DavidZhang - January 15, 2021
Alibaba Developer - February 3, 2020
Alibaba Cloud Storage - March 1, 2021

2,593 posts | 793 followers
Follow Simple Log Service
An all-in-one service for log-type data
Learn More ECS(Elastic Compute Service)
Elastic and secure virtual cloud servers to cater all your cloud hosting needs.
Learn MoreMore Posts by Alibaba Clouder