By Yuanyi
Alibaba Cloud Log Service (SLS) now supports time-series data storage. This feature provides customers with comprehensive access, storage, visualization, alerting, and intelligent O&M for time-series data. This solution fully supports mainstream open-source monitoring platforms and provides low-cost monitoring data storage and services without the need for O&M. In this blog, we will introduce the concept of time-series data and discuss how we can apply it across various scenarios with Alibaba Cloud Log Service (SLS).
"Time takes away everything, and your name, appearance, character, and fate will change over the years." — Plato
As time passes, everything is constantly in a state of change. People use various numbers, such as age, weight, speed, temperature, and currency, to measure these changes. In the digital era, these pieces of data that vary with time can be stored, and value can be obtained from them. This kind of data is known as time-series data. It describes the changing status of objects with respect to time.
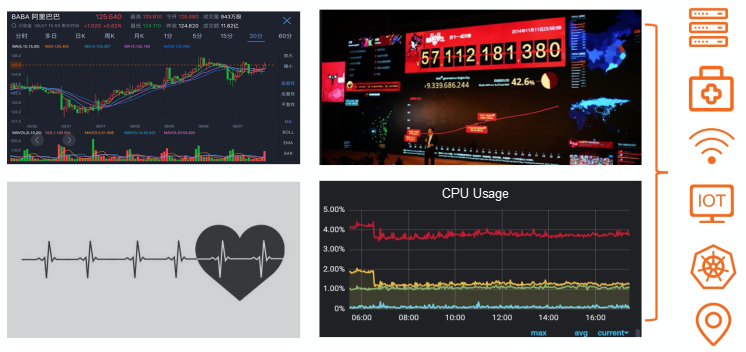
Time-series data is widely used in all industries. Its applications include tracking stock and transaction trends, server metrics, heartbeat information, positioning data, and energy consumption. The following are several of the many scenarios in which time-series data is used:
Recent years have seen the development of a number of time-series storage engines that support time-series analysis and monitoring in various scenarios. These engines include TimescaleDB, CrateDB, InfluxDB, OpenTSDB, and Prometheus. Each of these engines has its own ecosystem and application scenarios. For example, TimescaleDB is based on PostgreSQL, and therefore users familiar with PostgreSQL have an advantage in learning and beginning to use TimescaleDB. InfluxDB has a rich ecosystem, known as the TICK Stack, that includes Telegraf, InfluxDB, Chronograf, and Kapacitor. Prometheus has become the de facto standard for monitoring in Kubernetes thanks to its ease of use in cloud-native scenarios and its convenient, flexible query language, PromQL.
However, actual business scenarios require more than this from time-series data:
The Alibaba Cloud Log Service (SLS) log storage engine was released in 2016. At present, dozens of petabytes of log data from Alibaba and other enterprises are added to SLS each day. Time-series data and data used to compute time-series metrics make up a large part of the log data in SLS. The new time-series storage feature for SLS provides users with comprehensive data access, cleansing, processing, extraction, storage, visualization, monitoring, and problem analysis throughout the entire DevOps lifecycle. Together with SLS, this feature can solve data storage-related problems on all kinds of systems.
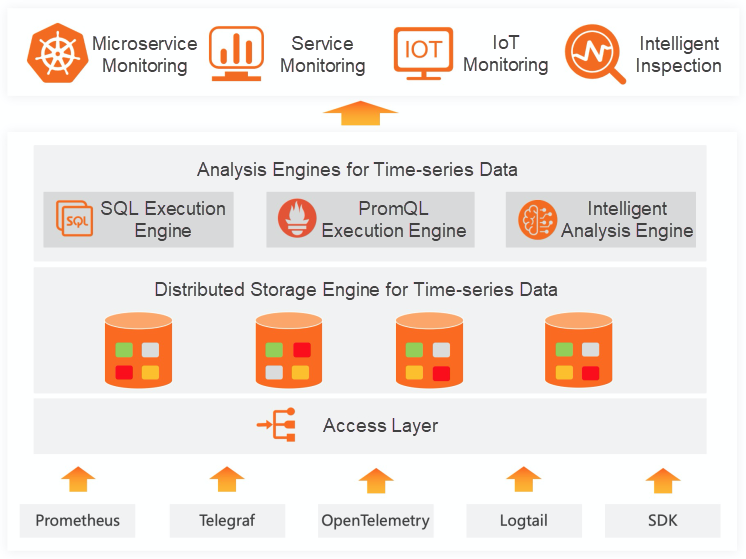
The architecture of the time-series storage feature is shown in the preceding figure. The access layer can connect to Logtail, the high-performance log collection component of SLS, as well as various open-source log collection products. In addition, the access layer can directly write data by using the SDKs of various languages, and open protocols such as Kafka and Syslog are also supported. The storage layer uses a fully distributed architecture. Each time-series database can be horizontally expanded in sharding mode. Three replicas of data are stored by default to achieve high reliability. The computing layer, which is separated from the storage layer, provides intelligent analysis and purely analytical SQL and PromQL syntax. The collection, storage, and analysis features provided by SLS enable enterprises to build their own business and microservice monitoring solutions.
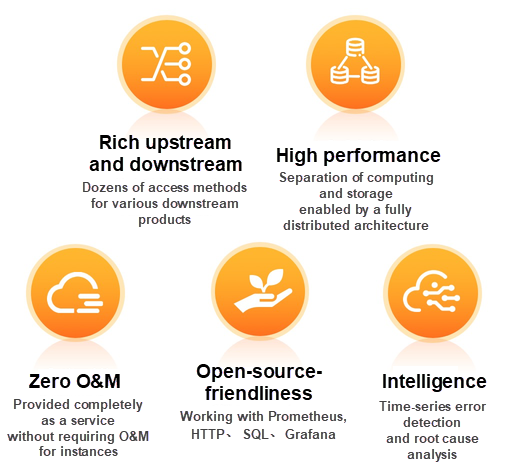
From its inception, time-series storage for Log Service (SLS) was designed to meet the needs of Alibaba and its major enterprise customers. The years of technical experience that Alibaba has accumulated ensure that the feature is adaptable to the monitoring and analysis requirements for time-series data at the vast majority of enterprises. Time-series storage for SLS has the following advantages:

Application and service monitoring is one of the most important tasks at the company level. It has always been considered the most important monitoring metric at Alibaba. The various data collection functions provided by SLS allow all application and service data to be collected in a unified and real-time manner. Data from different time periods and in different styles is transformed into structured data, which can then be analyzed. Owing to the large size of service data, SQL aggregate functions are used on the data to reduce dimensionality. The aggregated time-series data is then used as the basis for alerts and long-term tracing of monitoring metrics.
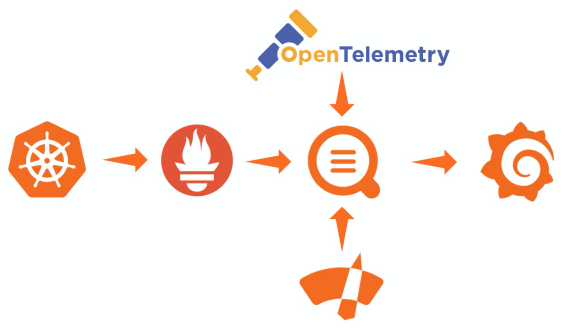
With the popularity of cloud-native technologies, an increasing number of companies are moving their technologies to a cloud-native architecture. By using open-source Cloud Native Computing Foundation (CNCF) projects such as Prometheus and OpenTelemetry, they can collect monitoring information about Kubernetes and various middleware products and applications. Cloud Monitor can then obtain monitoring data from all cloud services. The time-series storage, log storage, and tracing data storage capabilities of SLS enable various types of monitoring data to be stored in a unified manner and seamlessly visualized in Grafana. In addition, a comprehensive monitoring dashboard covering infrastructure, cloud services, middleware, and application software can be built on Grafana.
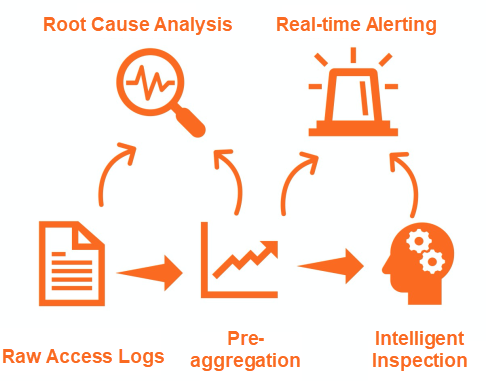
Access logs are necessary metrics for O&M. They record the inbound traffic of a website or application and directly indicate whether the website or application is running normally. You can collect raw access logs with Logtail and analyze or investigate the requests of each user. These logs can also be archived or audited. However, due to the large amount of raw access logs, they are not suitable for direct monitoring. Instead, pre-aggregation is performed to reduce the dimensionality of these logs, and real-time monitoring is performed based on the aggregated time-series data. You can also use the intelligent inspection feature of SLS to independently perform intelligent monitoring on each service site.
Visit Alibaba Cloud Log Service to learn more about its full capabilities!

57 posts | 12 followers
FollowAlibaba Developer - September 6, 2021
Alibaba Cloud Native Community - November 6, 2025
Alibaba Cloud Big Data and AI - December 29, 2025
Ashish-MVP - April 8, 2025
Alibaba Cloud Community - April 25, 2022
Alibaba Cloud ECS - September 13, 2018

57 posts | 12 followers
Follow Container Service for Kubernetes
Alibaba Cloud Container Service for Kubernetes is a fully managed cloud container management service that supports native Kubernetes and integrates with other Alibaba Cloud products.
Learn More Container Compute Service (ACS)
A cloud computing service that provides container compute resources that comply with the container specifications of Kubernetes
Learn More ACK One
Provides a control plane to allow users to manage Kubernetes clusters that run based on different infrastructure resources
Learn More Simple Log Service
An all-in-one service for log-type data
Learn MoreMore Posts by Alibaba Cloud Storage